
In this Level, we will introduce the ALLEXCEPT() function. ALLEXCEPT() supports the removal of filters from all columns in a table except the filters we specify explicitly. Imagine a situation where we have a need to specify “most but not all” of a table’s columns; ALLEXCEPT() can help us to dramatically reduce the amount of coding involved in making a calculation work for “all except,” say, a limited number of columns. Because ALLEXCEPT() is not designed to be used in standalone calculations, but to change a set of results over which some other calculation is employed as an intermediate function, the best way to gain an understanding of its operation is to see it in action. For this reason, our practice exercises will likely be more useful than usual in this Level of the Stairway to DAX and Power BI.
ALLEXCEPT() affords us a convenient shortcut for situations wherein we want to remove the filters on some, but not all, columns in a table. Again, the mechanical action is to remove all context filters in the table except filters that are applied to the specified columns. We’ll introduce ALLEXCEPT() within the setting of a relatively common business need in this Level, and likely come across it again in various uses as we progress through the Stairway to DAX and Power BI.
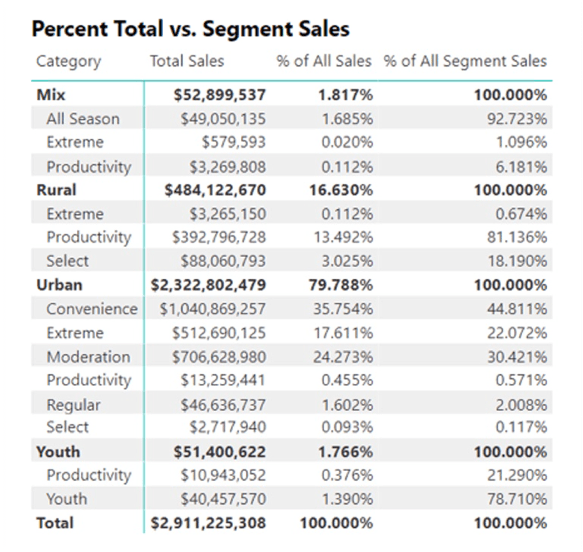
Illustration 1: A Common Use: ALLEXCEPT() for “Percentages of Different Parents”
As a part of our exploration, we will examine how ALLEXCEPT() can be employed to alter context, in meeting the requirements of clients or employers in the business environment. We’ll discuss the purpose of the ALLEXCEPT() function, and demonstrate how it interacts with basic filters, via measures we construct. Moreover, we will:
- Examine the syntax involved in exploiting the function;
- Undertake an illustrative example of the use of the function in a practice exercise;
- Briefly discuss the results we obtain in the steps of the practice example.
Preparation for the Practice Exercises in this Level
Assuming that you have installed Power BI Desktop (the illustrations in this Level reflect the July 2020 release), you are ready to download and open the sample Power BI Desktop file that we will use for hands-on practice with the concepts we introduce.
NOTE: The latest version of Power BI is available for free download at www.powerbi.com.
Download Sample Power BI File (.pbix) for Use in this Level
The sample Power BI file we’ll be using contains fully imported data, and a few pre-existing calculations that might be helpful in general. We will add the calculations and visualizations upon which we focus in this Level as we go. Using the sample dataset we provide will ensure that the results you obtain in following the detailed steps of the exercises agree to the results we obtain (and depict) as we progress.
Once the sample .pbix file is downloaded, take the following steps to open it in Power BI Desktop.
- Open Power BI Desktop.
- Select File - Open other reports from the splash dialog that appears upon entry, as shown.
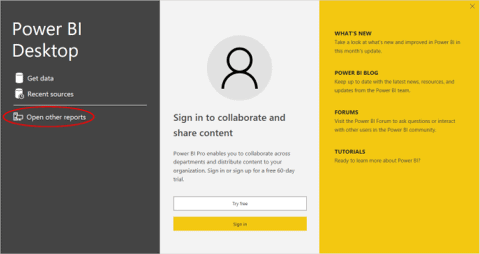
Illustration 2: Select Open Other Reports on the Splash Dialog that Appears
- Navigate to the file we downloaded.
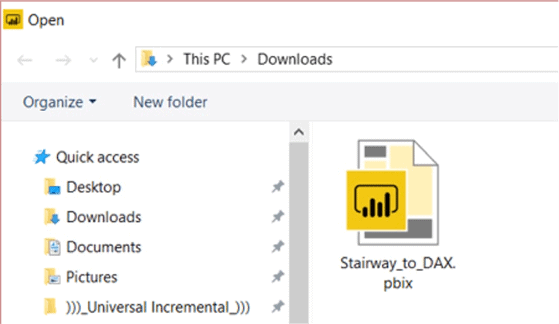
Illustration 3: Select the Stairway to DAX File and Open …
- Click Open.
The .pbix file opens and we arrive within the Report view, which consists of a single tab containing a blank canvas. As many of us are aware, we can tell we are in the Report view because the current view (of the three views available in the upper left corner, Report, Data, and Model) is indicated by the yellow bar to the left of the icon.
- Click the Data and Relationship view icons along the left of Power BI Desktop, as desired, to become familiar with the sample model.
The DAX ALLEXCEPT() Function
Introduction
According to the Data Analysis Expressions (DAX) Reference, the ALLEXCEPT() function “removes all context filters in the table except filters that have been applied to the specified columns.”
We will examine the syntax for the ALLEXCEPT() function in this level, with a focus toward its use within simple visualizations. We’ll then undertake a practice example built around a hypothetical business need that illustrates typical uses for the function.
Discussion
ALLEXCEPT() can be helpful when we already have a group of measures, say, in a reporting / analysis structure, where we have a need to make a calculation work for many of the same columns with which we’re already interacting, but for which we want the influence of one or more others nullified – we wish for the calculation to work with “all except this-and-that column.” ALLEXCEPT() can offer a convenient means to this end within a group of measures we bring together to present a data story.
As a quick illustration, say we have a client that wants to create a matrix presenting product sales data from a couple of perspectives at the same time: Product Category and Product Segment. Management is interested in the contribution of each segment, the second level of aggregation, to the total product sales of the organization, while it is also attentive to the contribution of each segment to the respective Product Categories into which the segment “rolls up.”
While this scenario may or may not be applicable in business environments that resemble our own, the circumstance that may be worthy of extrapolation here is that of a need for a measure to behave differently within a couple of instances within the confines of the same visualization. In this case, we have a need to generate a contribution percentage with a denominator that, in one instance, relates to “all sales of all products,” while the denominator in the second instance would be “all sales for each category.”
We can get a glimpse of an approach to this challenge in a preview of our final matrix visualization display. In this layout the intermediate steps that we will take in assembling the final product are clear and in operational order. As part of the actual construction process, we’ll get some rudimentary exposure to using ALLEXCEPT() to meet requirements similar to those of this hypothetical client.
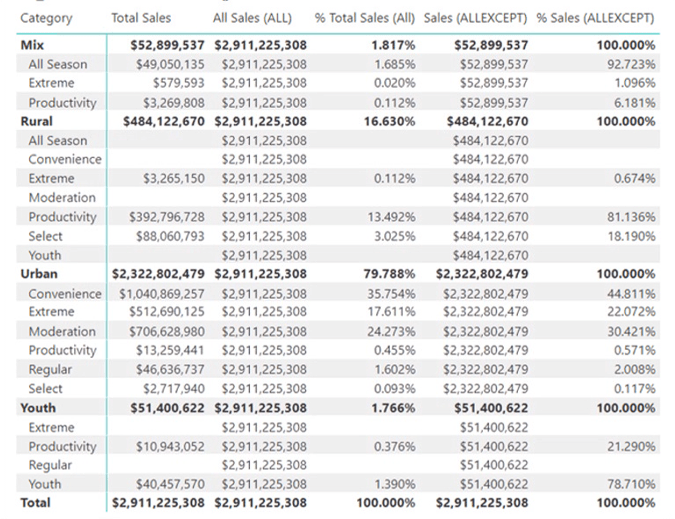
Illustration 4: Approaching the Need with ALLEXCEPT() …
As we’ll see in constructing this visualization, the role of ALLEXCEPT() within the measure involved will be to:
- Return all the rows in a table / matrix visualization, or all the values in a column
- Remove context filters from columns and rows in the current measure / query
- Enforce filters that come from outside the visualization
Syntax
Syntactically, the parameters we provide are specified within the parentheses to the right of ALLEXCEPT as shown:
ALLEXCEPT(<table>,<column>[,<column>[,…]])
The two parameters are:
- Table – The table over which all context filters are removed, except filters on those columns that are specified in subsequent arguments.
- Column – The column for which context filters must be preserved.
ALLEXCEPT() does not allow the use of table expressions or column expressions. The first argument must reference a base table, and all subsequent arguments must refer to base columns.
Return Value and Further Remarks
ALLEXCEPT() returns a table with all filters removed except for the filters on the specified columns. The removal of all context filters except filters that are applied to the specified columns gives us a convenient means, as mentioned earlier, to remove filters on many, but not all, columns in a table.
Hands-on practice with ALLEXCEPT() in the next section will make its objective clearer.
Practice
ALLEXCEPT() is one of many DAX functions whose operation tends to become clearer once we see it in action on some sample data. To do so, we’ll put ALLEXCEPT() to work within the definition of a couple of measures we add to our sample Power BI model within the Power BI Desktop. The intent, as in all the practice sessions of Stairway to DAX and Power BI, is to demonstrate the operation the function under examination in a straightforward, memorable manner. Let's move to the Power BI Desktop model we downloaded earlier as a platform within which to construct and execute the DAX we examine, and to view the results we obtain.
We start with a simple business reporting need: the requirement to present “percentages of two totals” that we outlined above. We examine the basic Power BI file the client team currently has, a sales and marketing model containing a small amount of data for retail merchandise over a few years, and determine upon a quick design to illustrate how we might meet this business need using the ALLEXCEPT() function. We will use the “starter” model as it currently exists for the setup of a simple scenario that both meets the need and demonstrates an approach within which ALLEXCEPT() can be used to make this happen. We’ll create a working example, using a matrix visualization to contain the measures involved.
Practice Exercise: Illustrate the Operation of ALLEXCEPT() through Individual Measures We Create
We’re ready to get some exposure to the DAX ALLEXCEPT() function. Let’s create a simple scenario first, a matrix juxtaposing Product Categories and Product Segments with calculations that we will create to return the total sales for each Product Category.
The Categories of Products are as follows within the sample dataset:
- Mix
- Rural
- Urban
- Youth
The Product Segments within the dataset are as follows:
- All Season
- Convenience
- Extreme
- Moderation
- Productivity
- Regular
- Select
- Youth
Construct a Matrix Visualization to Contain Measures we Create within the Practice Example
- In the sample Power BI model, click the cursor in the upper half the blank canvas.
- Click the matrix icon in the collection atop the Visualizations tab, to create a blank matrix on the canvas.
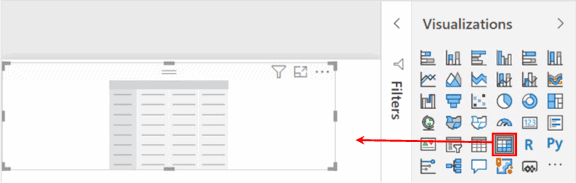
Illustration 5: Create a New Matrix on the Canvas
- Ensuring that the above matrix visualization is selected, add Category and then Segment (from the Product table in the Fields pane) to the Rows section of the Fields tab underneath the Visualizations collection, as shown.
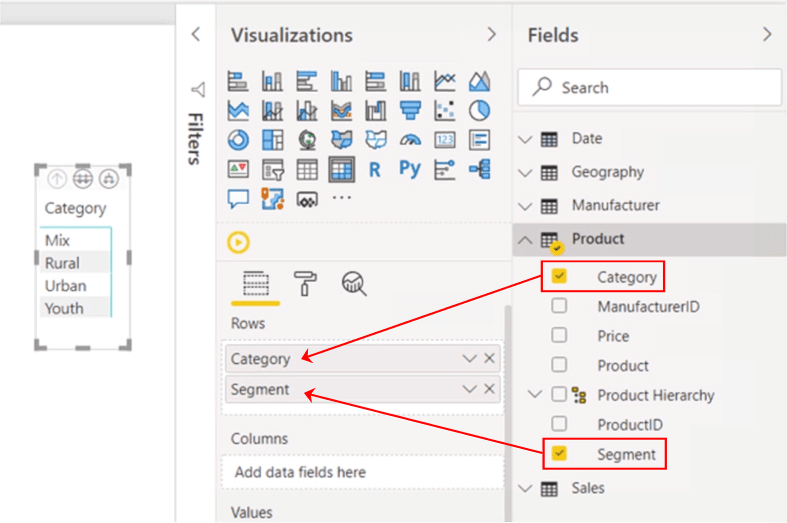
Illustration 6: Row Additions in the Fields Tab
- Expose the Segment level in the new matrix by clicking the button third from the left that appears atop the matrix visual when selected, as depicted.
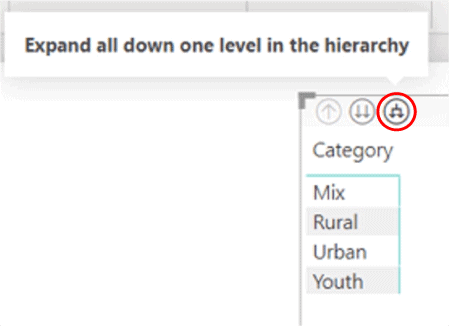
Illustration 7: “Expand All Down” in the New Matrix …
The new matrix visualization appears as shown:
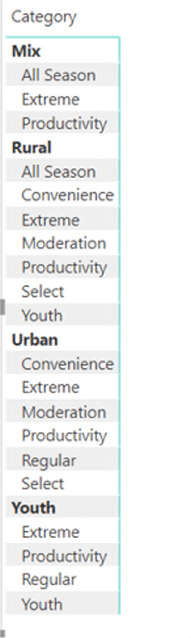
Illustration 8: Row Levels Expanded in the Matrix
Next, let’s label the matrix we are creating – as I’ve said in other Levels and elsewhere, this is a minor point, but, as multiple visualizations tend to accumulate within a development environment, it is often a good idea to make them easily distinguishable via descriptive, “working” titles. We can change the title, of course, before promoting a given visualization to a production environment, etc.
- With the new matrix selected, once again, click the Format (“paint roller”)tab, underneath the visualizations collection atop the Visualizations pane.
- Scroll down to the Title section of the Format settings.
- Click the Title slider to On.
- Expand the Title section by clicking the carat to the left of Title label.
- Type ST_DAX016 – ALLEXCEPT() in the Title text box.
- Set formatting as desired (you can see what I used in the illustration below).
The settings for the Title section of the Format tab appear, alongside the new matrix, somewhat as depicted.
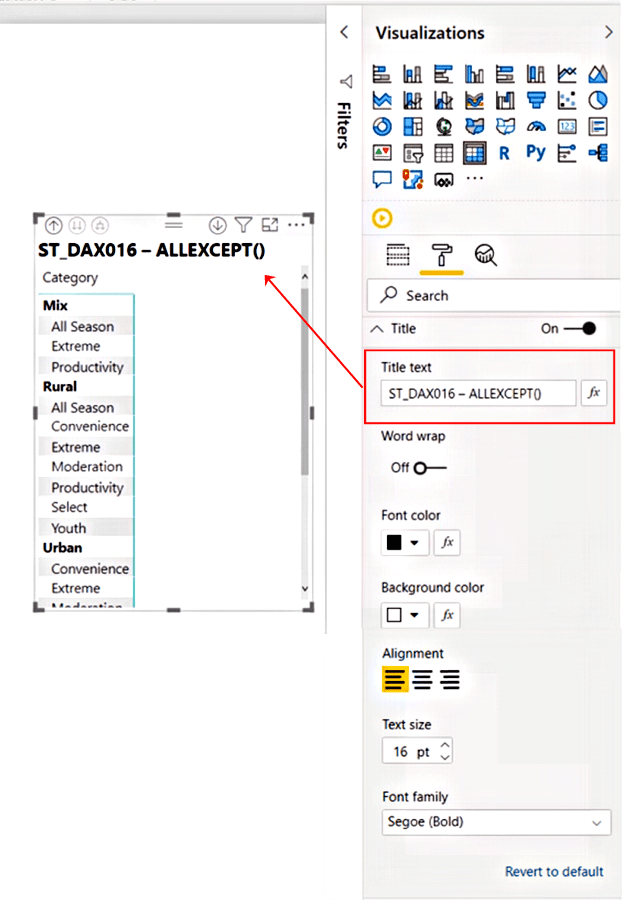
Illustration 9: Title Settings for the New Matrix
Next, let’s add the predefined Total Sales value for each row in the new matrix.
- Ensuring that the new ST_SDAX016-1 – ALLEXCEPT() matrix visualization is selected on the canvas, add the Total Sales measure (from the Sales table) to the Values section of the Fields tab for the matrix, as shown.
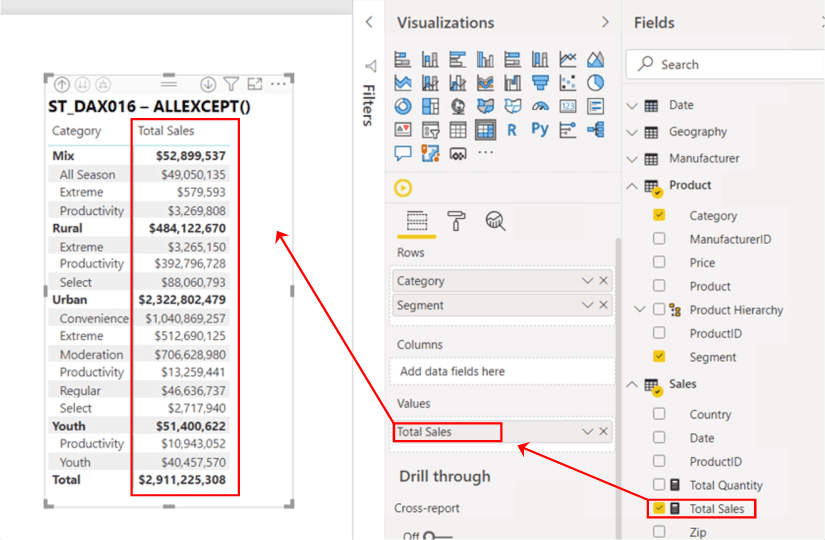
Illustration 10: Adding Total Sales to the New Matrix
Having created a starter matrix to house the measures we need, let’s move into creating those next.
Create Sales Measures to Support Explanation of ALLEXCEPT() Function
We’ll set up a couple of measures first that serve tandem purposes. One convenient objective is to support instant verification of accuracy and completeness of the measures within which we use ALLEXCEPT(). Another, more deliberate objective is to demonstrate the operation within environmental context. I intimated earlier that the standalone output of the function wouldn't typically make much sense from the perspective of seeing its utility: There would almost certainly be other standalone measures that could accomplish the same desired result within a simple scenario. Its value is better demonstrated from the perspective of other measures / filters in the visual. In short, ALLEXCEPT() is a great option to have when we have a set of circumstances that apply to most of the measures on display, but have an exception of some sort where we want to exclude the filtering effect of a given table column.
First, we’ll create a measure to aggregate all sales (over all time in the model) for each Product Category.
- Click the ellipses (“…”) to the right of the Sales table within the Fields pane.
- Click New Measure atop the context menu that appears, as depicted.
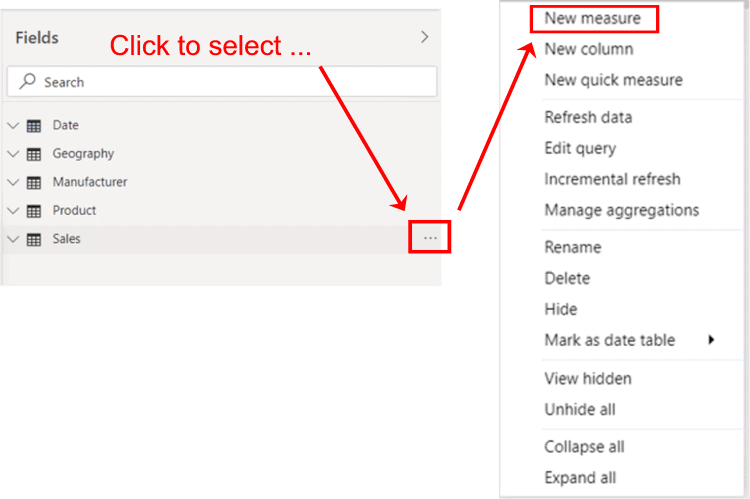
Illustration 11: Click New Measure to Begin Design …
- Type the following into the Formula bar for the new measure that appears:
All Sales (ALL)=
CALCULATE(
[Total Sales], ALL(Sales))
- Click the check mark icon on the left side of the Formula bar to commit the new measure.
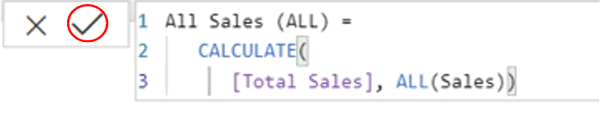
Illustration 12: Commit the New Measure …
Here we’re creating a measure to return “all sales for the entire organization, all products (and therefore all product attributes, like categories and segments) and all time / dates, etc. In this case, we employ the DAX ALL() function to remove the external filter context applied by the visual (product attributes) and to aggregate Total Sales (ALL(Sales) considers the entire Sales table).
NOTES:
For an introduction to the DAX ALL() function, see Stairway to DAX and Power BI - Level 13: Simple Context Manipulation: Introducing the DAX ALL() Function.
For an introduction to the DAX CALCULATE() function, see Stairway to DAX and Power BI - Level 14: DAX CALCULATE() Function: The Basics.
- Ensuring that the new measure is still selected within the Sales table, and within the Measure tools tab of the toolbar, format it as “Currency,” zero decimal places.
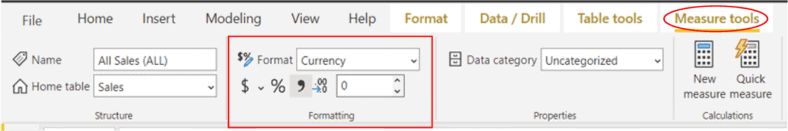
Illustration 13: Format the New Measure – Rounded Currency
Now, let’s pull the new measure into the matrix.
- Ensuring that the matrix visualization is selected, once again, add the new All Sales (All) measure to the matrix via the related Values section (underneath the Total Sales measure), of the Fields tab of the Visualizations pane.
Finally, let’s create another supportive measure (to this Level, and our examination of ALLEXCEPT(), at least): the percentage of all sales contributed by each Product Category / segment. This measure will allow us a point of contrast when we perform the same calculation later, with exceptions, via the ALLEXCEPT() function. So here we are simply returning the Total Sales for each category / segment combination (numerator), divided by the All Sales (All) denominator.
- Create a new measure called % Total Sales (All) within the Sales table:
Formula:
% Total Sales (All) =
DIVIDE([Total Sales], [All Sales (All)])
Format:
Percent (%), 3 decimal places
- Click the check mark icon on the left side of the Formula bar to commit the new measure.
- Select the ST_SDAX016-1 – ALLEXCEPT() matrix visualization, once again, and add the % Total Sales (All) measure to the Values section of the Fields tab for the matrix, underneath the existing Total Sales and All Sales (All) measures, as shown.
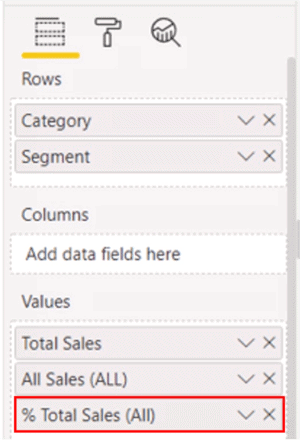
Illustration 14: % Total Sales (All) in Place in the Matrix
The matrix appears, with the latest additions, as shown.
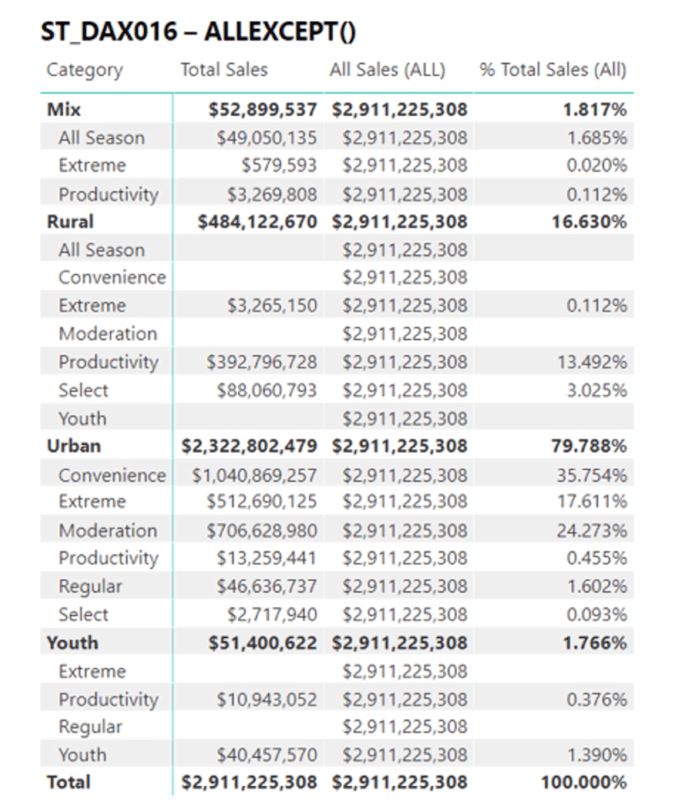
Illustration 15: All Sales (All) and % Total Sales (All) Measures in the Matrix
Now we’re ready to approach the stated requirement: to demonstrate an approach to calculating, within a hierarchical data set, a percentage of a parent total. We’ve just added the percentage of “Level 1” (Product Category) total calculation, so as to provide a basis for contrast to our next step, where we employ ALLEXCEPT() to show our client colleagues how to meet their stated requirements.
Employ the ALLEXCEPT() Function to Support Analysis of “Percentage of Parent”
We will create two measures to achieve our ends. First, a measure to return sales totals at what we have defined in our matrix as “level 2,” the Product Segment.
- Create a new measure called Sales (ALLEXCEPT) within the Sales table:
Formula:
Sales (ALLEXCEPT)=
CALCULATE(
[Total Sales], ALLEXCEPT('Product','Product'[Category]))
Format:
Currency ($), 0 decimal places
As we have noted, two levels of filter contexts are enforced in the dataset, Product Category and Product Segment. We are now seeking to enforce filters at the Product Category, and not at Product Segment, level (which would give us the value we see in the initial Total Sales column) – in effect generating a total for the Product Category, the “parent” (in our arrangement) to the Product Segment.
- Click the check mark icon on the left side of the Formula bar to commit the new measure.
- Select the ST_SDAX016-1 – ALLEXCEPT() matrix visualization, once again, and add the Sales (ALLEXCEPT) measure to the Values section of the Fields tab for the matrix, underneath the existing % Total Sales (All) measure.
The presence of the Total Sales value serves as a means of checking the accuracy of the new calculation, as shown in the current results.
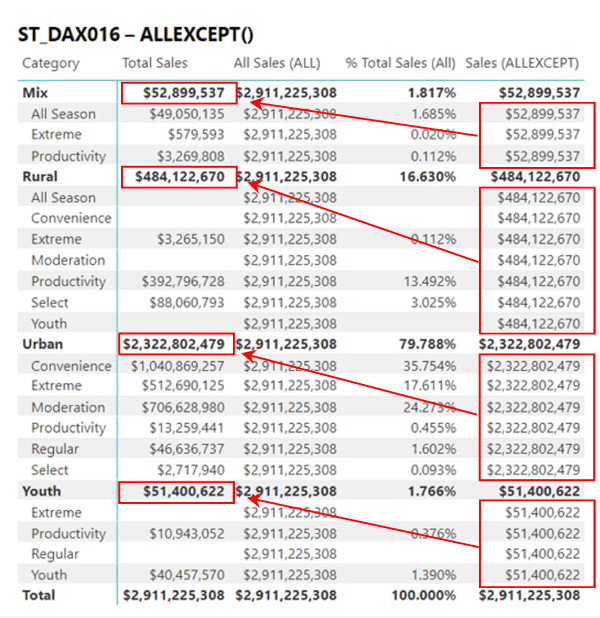
Illustration 16: Verifying Accuracy of the Values in the New Measure
Now that we have employed ALLEXCEPT() within the DAX calculation to 1) remove external filter contexts as enforced by the matrix, 2) filter the Product column within the Sales table upon Category only, and 3) return the aggregation of sales for each Category (the “parent,” within the data as defined by the matrix), we’ll add one more measure to generate a “percentage of parent” value for enhanced contribution analysis.
- Create a new measure called % Sales (ALLEXCEPT) within the Sales table:
Formula:
% Sales (ALLEXCEPT)=
DIVIDE([Total Sales], [Sales (ALLEXCEPT)])
Format:
Percent (%), 3 decimal places
- Click the check mark icon on the left side of the Formula bar to commit the new measure.
- Select the ST_SDAX016-1 – ALLEXCEPT() matrix visualization, once again, and add the % Sales (ALLEXCEPT) measure to the Values section of the Fields tab for the matrix, underneath the existing Sales (ALLEXCEPT) measure.
All measures now appear within the Values section of the Fields tab, as shown.
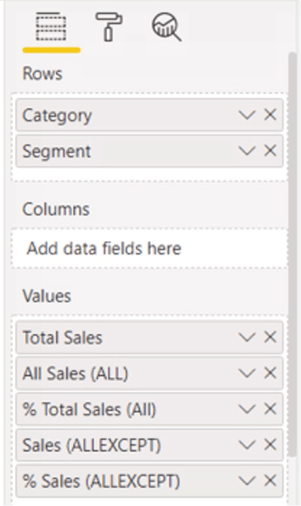
Illustration 17: Complete Set of Measure Values in the Matrix
The completed matrix visualization appears as depicted.
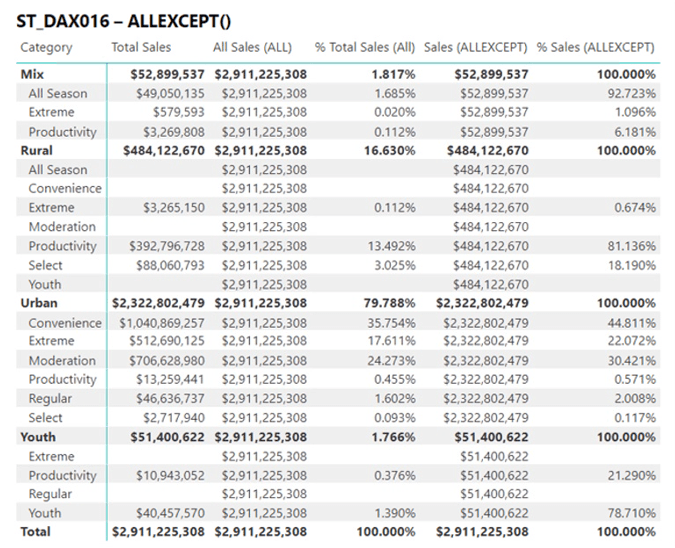
Illustration 18: Completed Matrix with All Added Measures
We now have a basic visualization that can help information consumers begin to analyze the contribution of individual Product Segment sales, both to the total sales of all products, and to the total sales of their respective Product Category parents. Such analysis is a great use for the ALLEXCEPT() function, and this represents a simple example of how ALLEXCEPT() can enable us to conveniently disable filters within situations where we encounter a need, say, on some, but not all, columns in a table. I trust that the straightforward practice example that we have traversed together within this Level of the Stairway to DAX and Power BI proves useful in delivering insight within the business environment.
Summary
In this Level of Stairway to DAX and Power BI, we exposed the DAX ALLEXCEPT() function. We discussed the general purpose and operation of ALLEXCEPT(), and then focused upon putting it to work in the removal of filters from all columns in a table, except filters that we specified explicitly. As part of our discussion, we examined the syntax involved with using ALLEXCEPT(), and then constructed a basic, illustrative example of the use of the function in a practice exercise. Finally, for each example we undertook, we explored the results datasets we obtained.
This article is part of the parent Stairway to DAX and Power BI.