Introduction
Instead of going straight into the topic of the Query Store, I would like to start this Stairway Series by mentioning a few performance tuning scenarios that are very common to production DBAs. I think most of us have been in one of these situations at some time:
- An application experiencing slowness after a database upgrade where the application used to work faster with the previous version of SQL Server.
- Checking the SQL Server logs after a server reboot. Because things was not working as expected someone decided to the best way to fix the system was rebooting the server.
- A canned application having serious performance problems due recent schema changes from an application upgrade. However, the DBA is not allowed to modify the database code. The DBA also cannot add indexes or statistics because that goes against the vendor support contract.
- An IT Manager or Business Manager asking the DBA to find the "go faster" button because there is an important business process not working as expected. Of course, the database is the problem (guilty until proven innocent).
And my personal favorite:
- A database or databases executing a large amount of dynamic SQL code, having no stored procedures or functions; to make things worse all the client request to SQL Server are in form of plain text SQL (hard-coded in the application).
These are just a few real-world scenarios where SQL Server’s performance is affected by recent changes like a version upgrade, schema changes, or simple bad code design practices.
There are multiple tools available to assist you in solving performance tuning scenarios, like the few I mentioned at the beginning of this article. We have the built-in tools like PerfMon, DMVs, XEs, PoSH and the licensed products from vendors like RedGate, Idera, Quest, and Solarwinds.
As you may have noticed, we have plenty of options from which to choose. This SQL Server Stairway is focused on showing you how Query Store can be a valuable tool you can leverage to solve SQL Server performance issues quickly, and most importantly, in a very simple manner.
What is Query Store?
First thing first, let's understand a little bit better about Query Store. Query Store is a feature introduced in SQL Server 2016. It was new for the "on-premise" versions, but it was already present in the Azure version (Azure SQL DB) since November 2015. It was the pillar for performance analysis and query troubleshooting through features like:
- SQL Database Advisor
- Query Performance Insight
Multiple Microsoft teams has been advertising this feature as SQL Server’s “flight recorder”. For those not very familiar with aviation terms, a flight recorder is a device that preserves the recent history of the flight through the recording of dozens of parameters collected several times per second. The flight recorder definition is indeed a really good analogy to what Query Store does, it collects and stores query performance information for those all queries executed or being executed against a specific database.
The information collected includes the query text, estimated execution plan as well run-time statistics. The run-time statistics are nothing more than pure performance metrics as CPU time, duration, execution count, logical Reads, logical writes, memory consumption, physical Reads, CLR time, degree of parallelism (DOP), row count, log memory, TempDB memory, and wait times.
What makes Query Store so good?
The answer is easy. Query Store simplifies the DBA's job by making performance tuning accessible for anyone, whether junior, mid, or senior level staff. The graphical user interface is very straight forward, providing DBAs an essential resource to deal with day to day performance problems.
According to Microsoft docs, Query Store should help on any of the following scenarios:
- Pinpoint and fix queries with plan choice regressions
- Identify and tune top resource consuming queries
- A/B testing
- Keep performance stability during the upgrade to newer SQL Server
- Identify and improve ad hoc workloads
As mentioned before, there are multiple out of the box options to collect performance data. Probably the most popular tool used by many production DBAs are DMVs (Dynamic management views). These store performance information that can be collected for any query executed against a SQL Server instance.
The challenge with DMVs is that they require a certain familiarity with the data in them to understand the joins, cross joins or relationships between the DMVs in order to precisely extract the information in which we are interested. The major drawback with DMVs, is that all data returned comes from SQL Server cache. This means all the information will not remain persistent after a SQL Server restart. This is a reason why so many DBA’s ended up creating a custom solution with SQL Agent jobs to collect all this performance data into a “DBA” dedicated database. Don’t get me wrong, I’m a big fan of SQL Server DMVs, but as mentioned before, there is certain learning curve even more for an accidental or junior DBA this is not the case with Query Store.
Query Store does not have the persistence problem. All the performance data collected gets hardened to disk, thus is persistent no matter if SQL Server is restarted. Query Store also collects the information at database level, which means that can be enabled \ disabled on demand based on the scenarios described previously.
The performance data can be easily accessed in SQL Server Management Studio (SSMS), using the Object Explorer. The latest version of SSMS includes the following reports:
- Regressed queries
- Overall Resource consumption
- Top Resource Consuming Queries
- Queries with Forced Plans
- Queries with High Variation
- Tracked Queries
Query Store in action
Now that we have the basic understanding of Query Store, let's have a quick sneak peek of what it can do. In order to build a testing scenario, I will use a copy of the Adventure Works 2016 sample database. I also will use a PowerShell script to generate some workload against this database. I will execute random queries and stored procedures in more than eight sessions running in parallel for thirty minutes.
Here is how the activity of my SQL Server instance looks from PerfMon. Specifically, look at the batch requests per sec counter (highlighted in black):
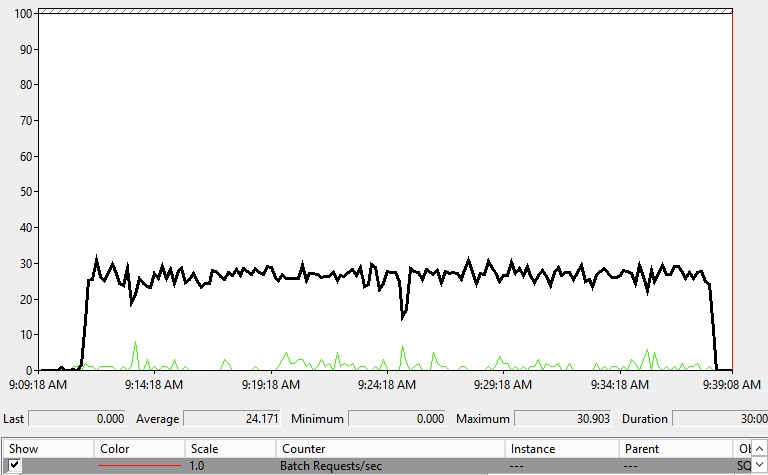
As you can see from the image above, the batch request per seconds counter started to grow, reaching an average of thirty sessions. This dropped to zero after 30 minutes, what means that my PowerShell script work as expected creating this workload for the amount of time desired. Now that I know for sure my database had some activity for certain period of time, I'm ready to check what Query Store has captured.
As mentioned before, SSMS provides collection of built-in reports available after Query Store gets enabled for the target database, I will navigate through the database in Object explorer, then I will choose Query Store and pick the "Top Resource Consuming Queries" report. I'm interested to find those top two queries that has to longest average duration; so I will select the metric "Duration" from the top left list box on this report, then I will select the statistic "Avg" from the next list box.
Then I simply clicked the first blue bar from the report on the left to show me the top 1 query with the ID 478. You can see the Query ID is displayed in the right top panel of the screen below:
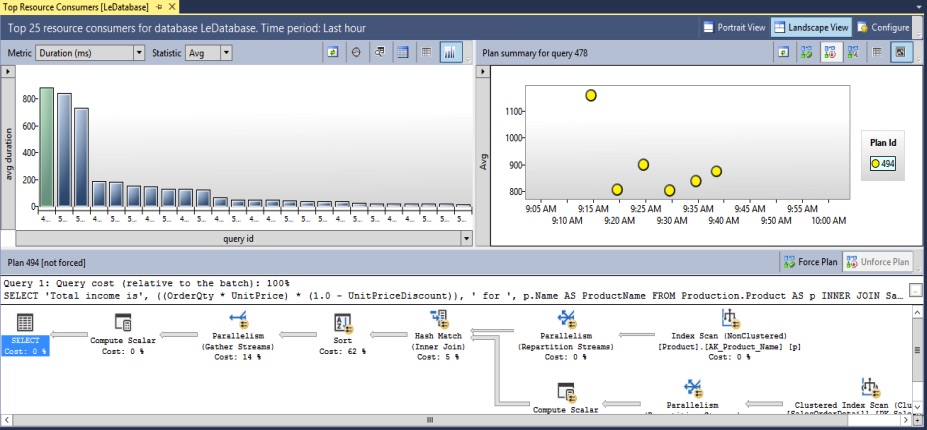
This query had some variation of time from execution to execution but nothing to worry about, it was just for the first time it was executed. By the way, we can even find the Plan ID for a Query ID, if you look at the mid section of the right panel you will see it says Plan ID 494.
Assume I wan to dig more, if I simple click on every single bar from the top left panel I can get the information of each query. The next query has the ID 519, again I can see the plan took more time to run the very first time then some variations over the time but nothing wrong; this query has the Plan ID 535.
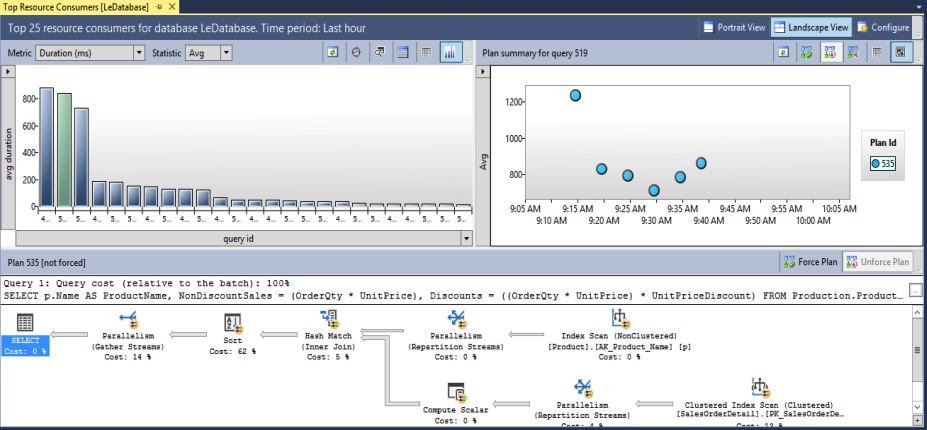
That's it, with the help of this built-in report I was able to point point those two top queries (Query ID 478 & 519) and take a quick look at each one of their execution plans to look for any plan variations over time also to identify the longest queries by average duration. Of course in real life we will be interested in more details but this was just a sneak peek to show you who easy and powerful Query Store can be just out of the box.
Conclusion
Query Store is a feature introduced in SQL Server 2016 sometimes referred as SQL Server "flight recorder", because it collects and stores query performance information for those all queries executed or being executed against a specific database.
It doesn't matter whether you are a very experienced or novice DBA, Query Store will help you to pin point query regressions, find resource contention, identify long running processes and most important to have access to detailed statistics that will help you to understand your workload easy.