

Azure Data Studio (ADS) is a lightweight IDE built on Visual Studio Code. I've written a few articles on how the tool works, and this one continues the series, taking a look at another extension: the SQL Server Profiler extension.
The other articles in this series on ADS works are shown here:
- Getting Started with Azure Data Studio
- Getting Comfortable Writing Code in Azure Data Studio
- Using Notebooks in Azure Data Studio
- Using Azure Data Studio with TFVC
- Using Azure Data Studio with Git
- Editor Tips and Tricks for Azure Data Studio
- Using the Import Extension in Azure Data Studio
- The Profiler Extension in Azure Data Studio
- Server Dashboards in Azure Data Studio
You can download the tool and read those articles to learn about how to use this in writing code. I've gotten more comfortable with the tool, and while I still like SSMS, there are some features in ADS that I prefer.
The SQL Server Profiler Extension
Extended Events has become the de facto and best way to trace activity on a SQL Server instance. However, many people still like the Profiler tool and use that. To try and get some of them to switch, Microsoft released the XE Profiler in SSMS. You can find this at the bottom of the Object Explorer, as shown here.
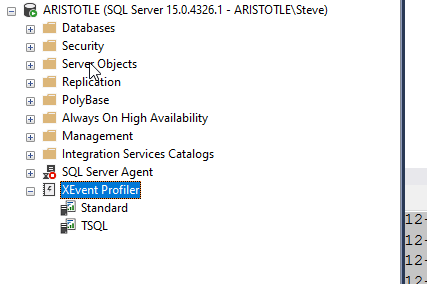
There are two sessions running, one which mimics the standard template in Profiler and another mimicking the T-SQL trace.
The ADS Profiler Extension
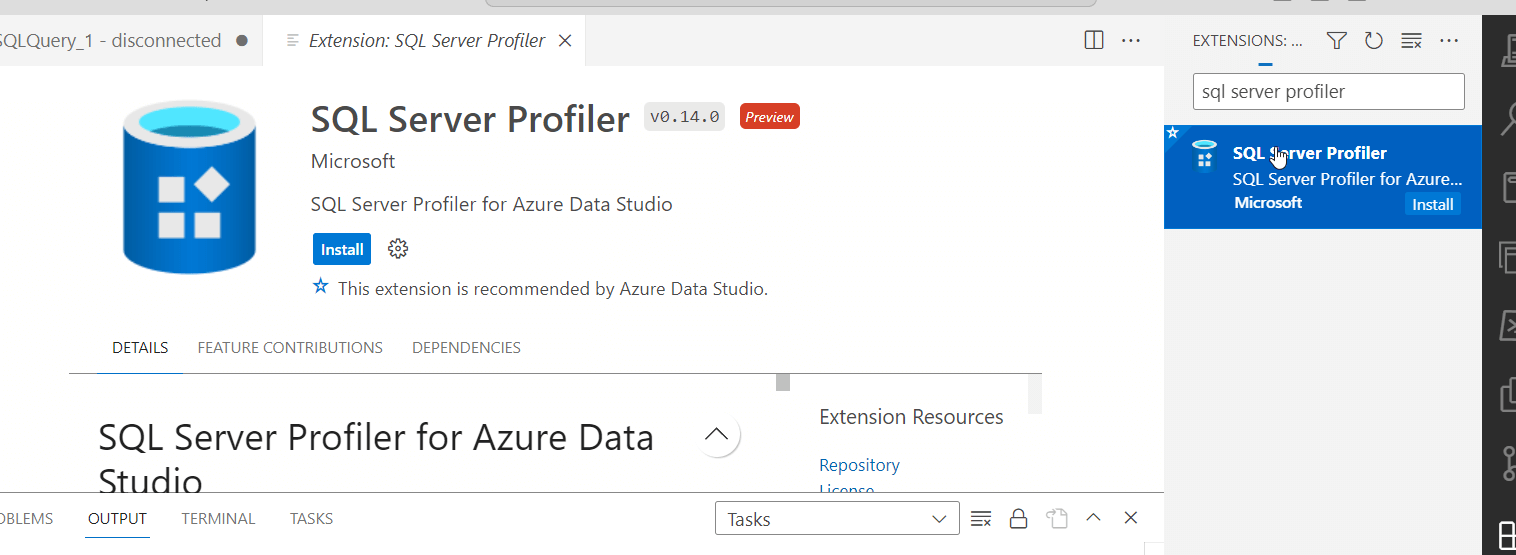
Microsoft has ported this to ADS in the form of an extension you can add to your tool and access the same data. If you search in the extension blade for "SQL Server Profiler" you'll see it listed. Click the Install button to add this to your ADS install.
Note, this is listed in the docs as Preview as it is here.
Once it's installed, you access it from the Command Palette. Let's see how this works.
Generating a Workload
You usually want some workload on your system when you are tracing. I've added a small client application that generates a random workload from a few stored procedures. I've got this running below, and you can see I do some counts to see the rows changing. In the application, the log at the bottom shows which stored procedure ran, when, and some results from the execution.
This application shows which procs are being run, but in many applications we don't have this type of log. Instead, we need some sort of database side trace to let us know what's running. We can activate the ADS extension to run the Profiler, which reads the Extended Events (XEvent) session.
Tracing the Workload
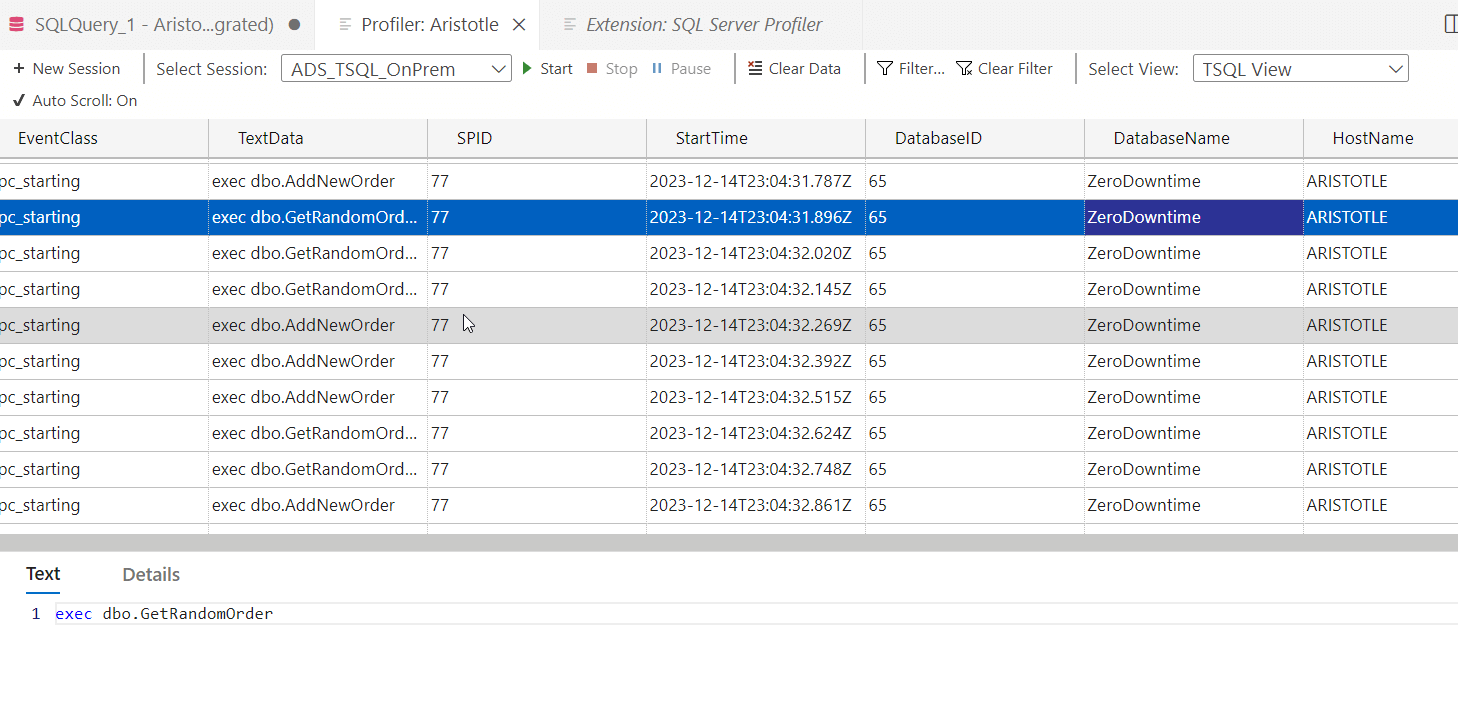
Below you can see my workload running and then the trace that captures this activity. I open the Command Palette and I start seeing the changes once I select the trace.

As we can see above, the activity from the application appears in a grid. This seems to be smoother and work better than the display in SSMS, which is rare. I tend to find SSMS works better, but the ADS extension seems to handle a smoother display, and a quicker one. That I like, and it's a reason why I might choose ADS for this particular task.
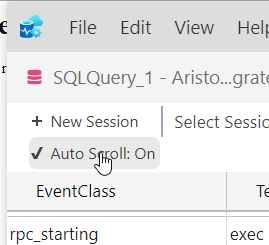
There are buttons at the top to start/stop/pause the trace. There is also a button to stop the auto scroll, which can be annoying at times. This is the default, but clicking this button will stop and show you the display and let you control what you look at.
If I stop or pause the display, I have a fairly clean display of a few things. I see this, and note that in the lower pane I just see the Textdata.
Contrast this with the display in SSMS, which has more information, but feels more cluttered. This is the same data (slightly different time), but I see so much more in the detail pane, much of which distracts me. The GUIDs in particular draw my eye and I am constantly trying to look around those.
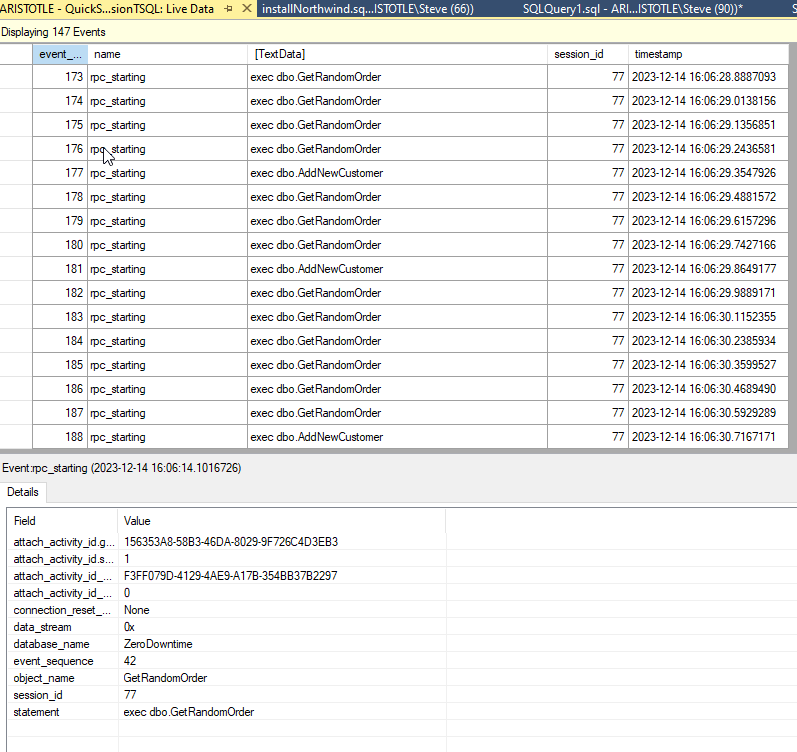
If I click the "Details" pane in the bottom of ADS, I see more data, but again, less than SSMS, but everything I want. Most of the other details from SSMS aren't relevant or useful to me.

When I use profiler, usually I'm looking for when something ran, what ran, which database, and which client. That often helps me track what's going on. The SPID is nice in case I want to kill something 😉
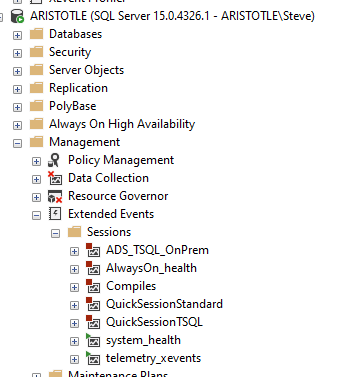
This view is just showing XE sessions, which I can see if I use the drop down near the top. I see the other XE sessions on this instance.
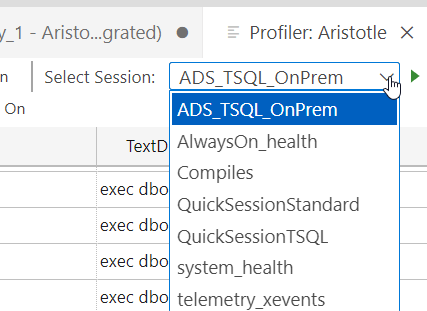
This matches what I see in SSMS, which is more than the two session choices the Profiler shows.
Different Views
There are a few different views of data, which is interesting. However, when I select a different one from the drop down, I lose my data. That. Is. Annoying.
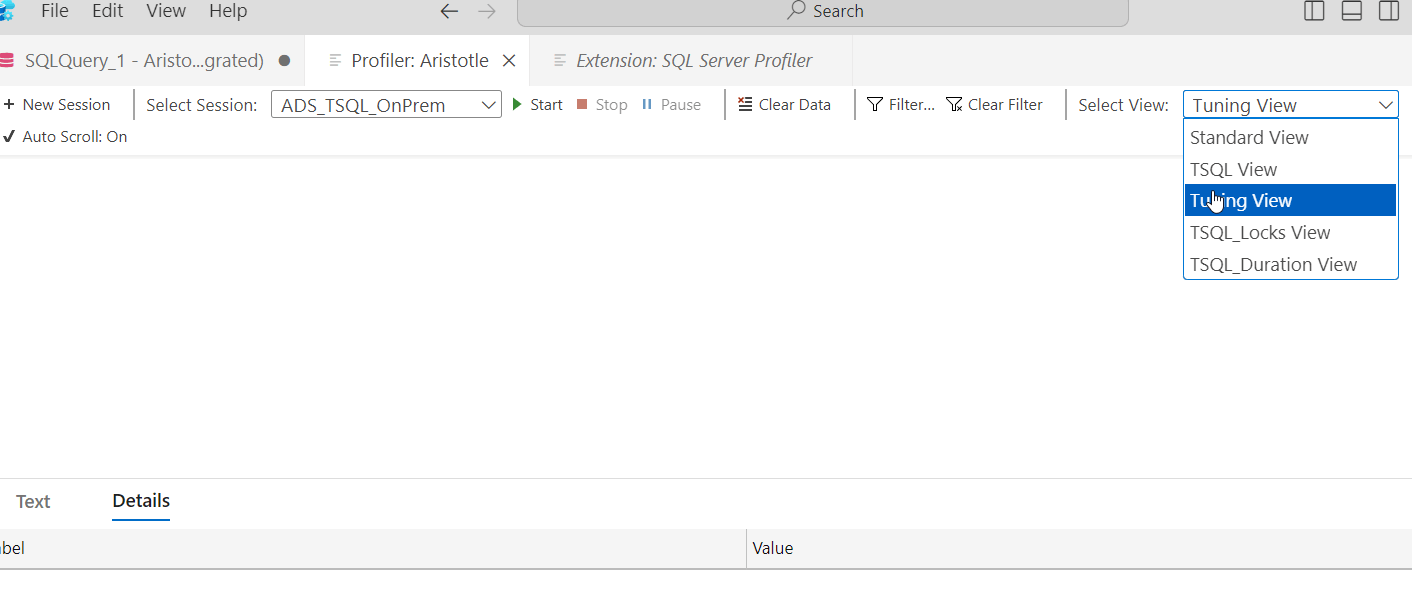
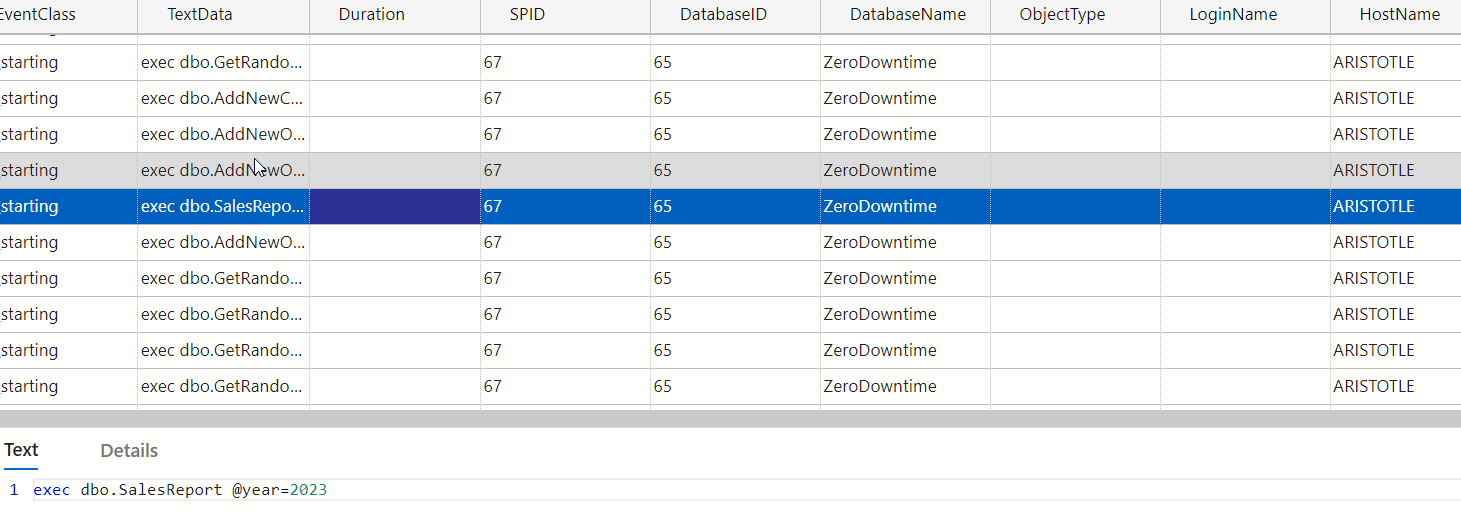
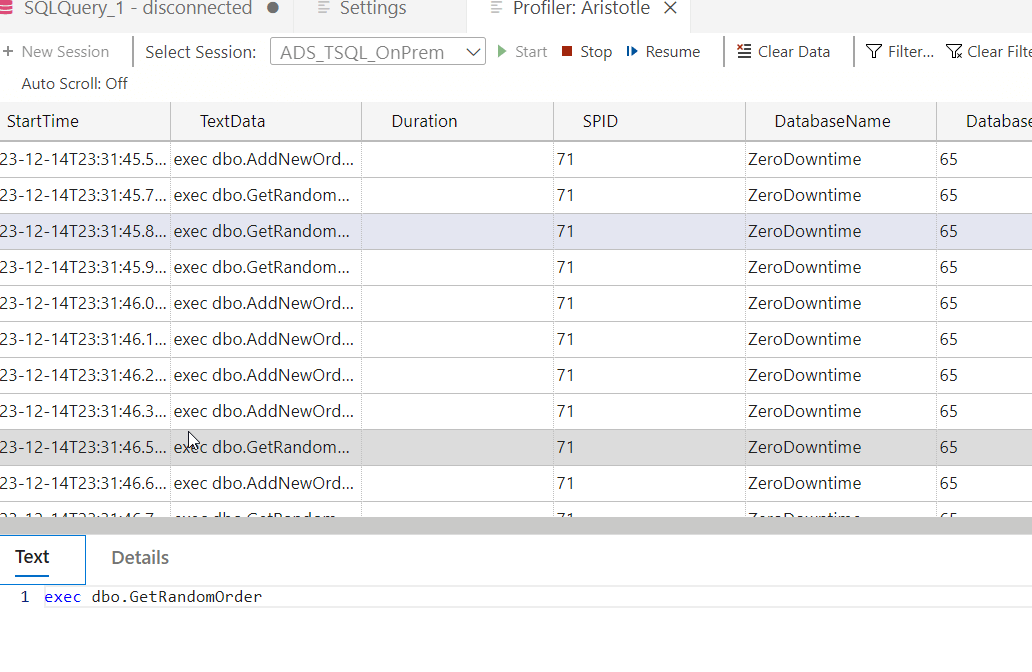
I can restart or resume the Profiler and I'll see data again. The tuning view is different, showing me the duration and start time directly, which isn't in the T-SQL view. Using different views is handy when you are trying to accomplish a specific task.
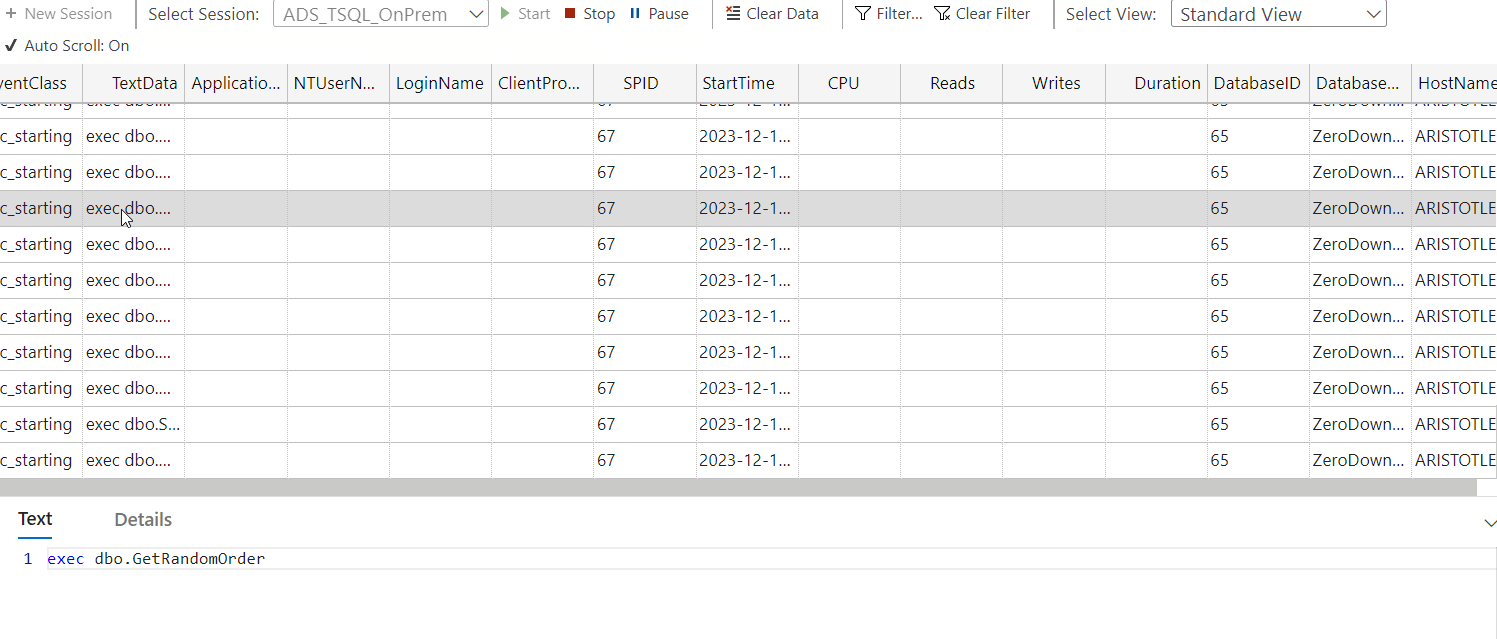
The Standard view looks a lot like SSMS and since the TextData is shrunken, I have to expand it to see details, which is really annoying when I start this to troubleshoot something.
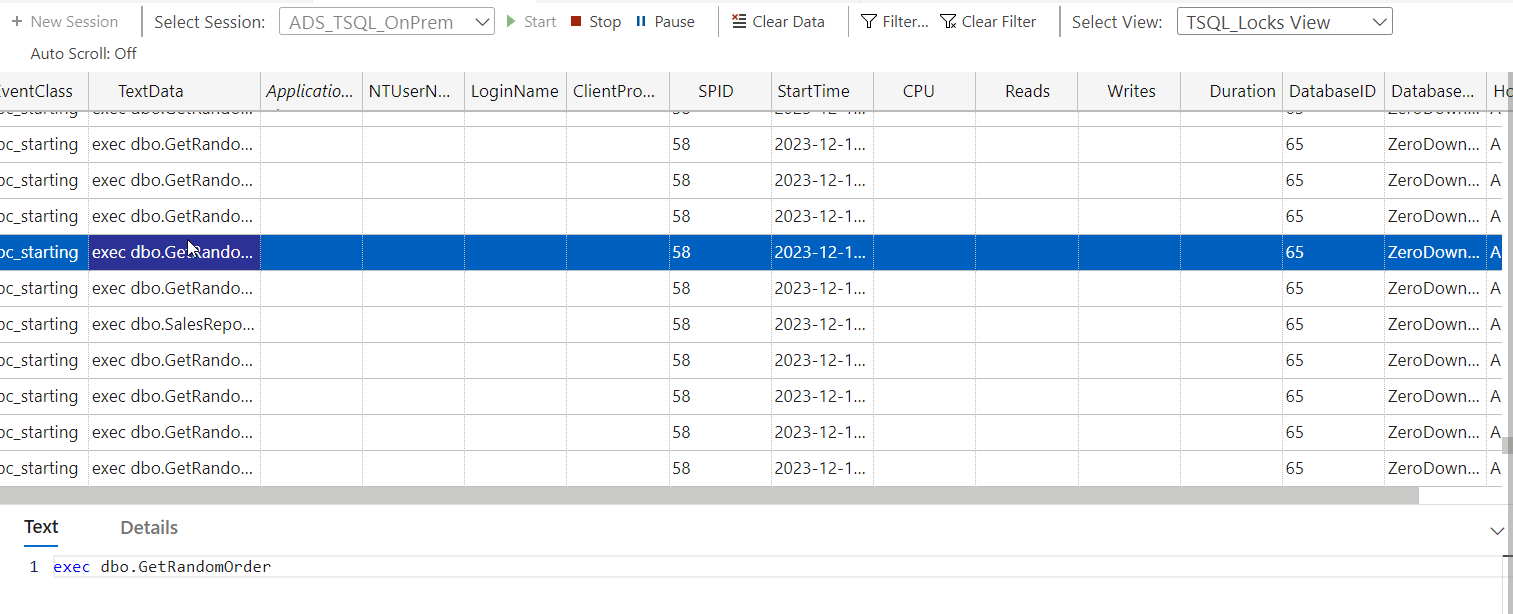
The T-SQL Locks view looked like this. This is a lot like the Standard view, and seems more cluttered as well.
The T-SQL Duration view is more like the T-SQL one with duration added. It doesn't have the object, which is in the tuning view.
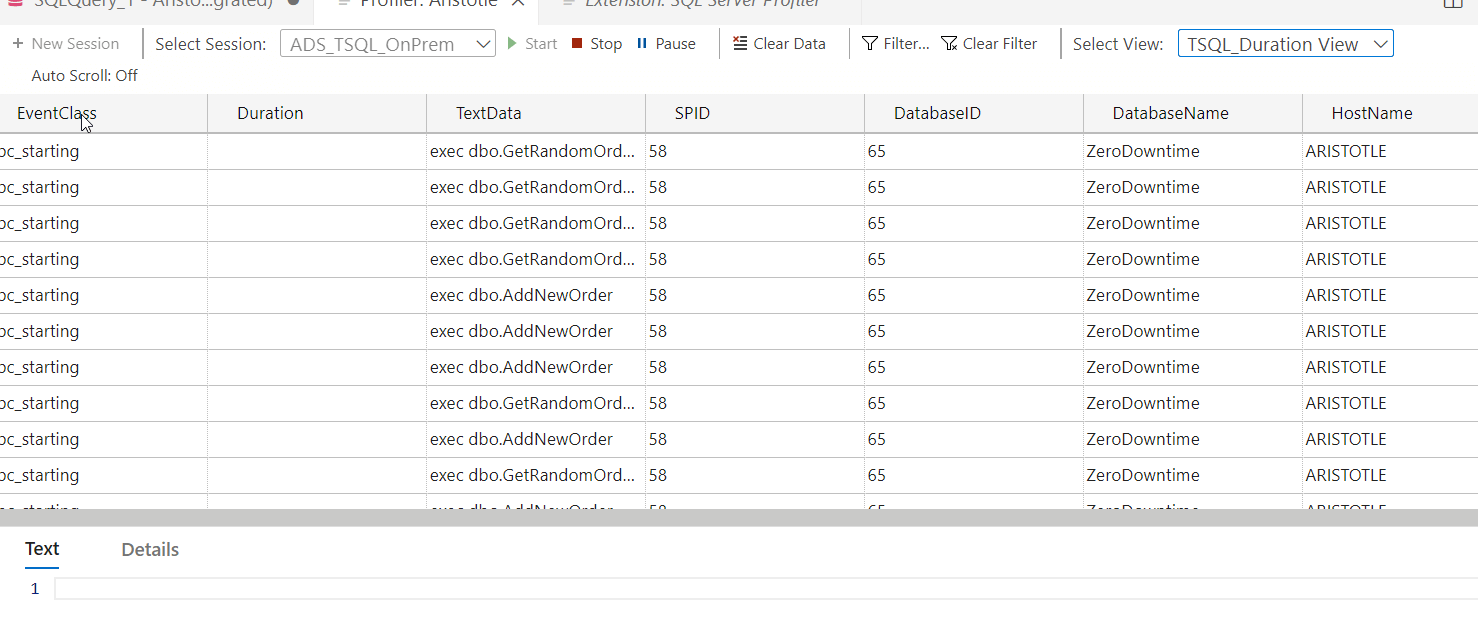
This is all the same data, but I like that there are different views. I didn't see a way to change this is the preferences, and this extension isn't listed.
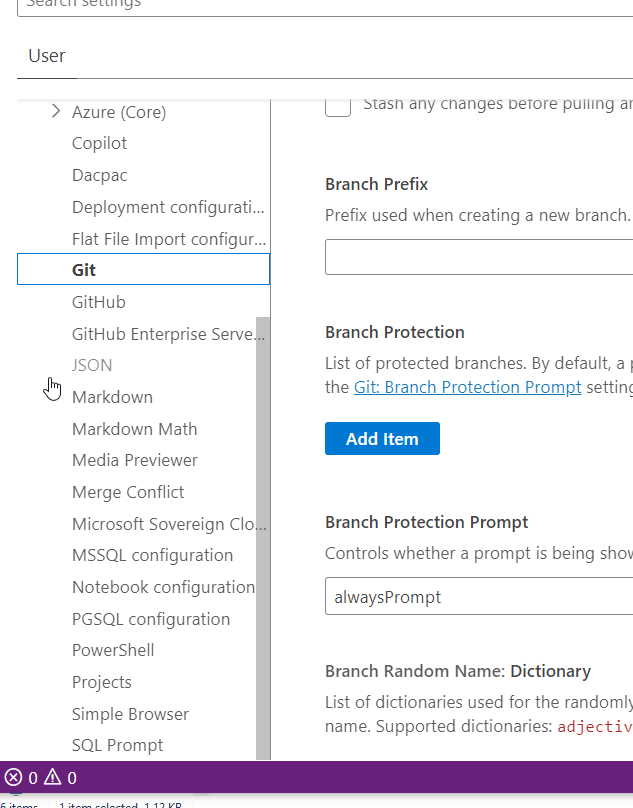
However, I do see these views in the JSON configuration. If you search for profiler, you'll get this file to open and you can edit it.
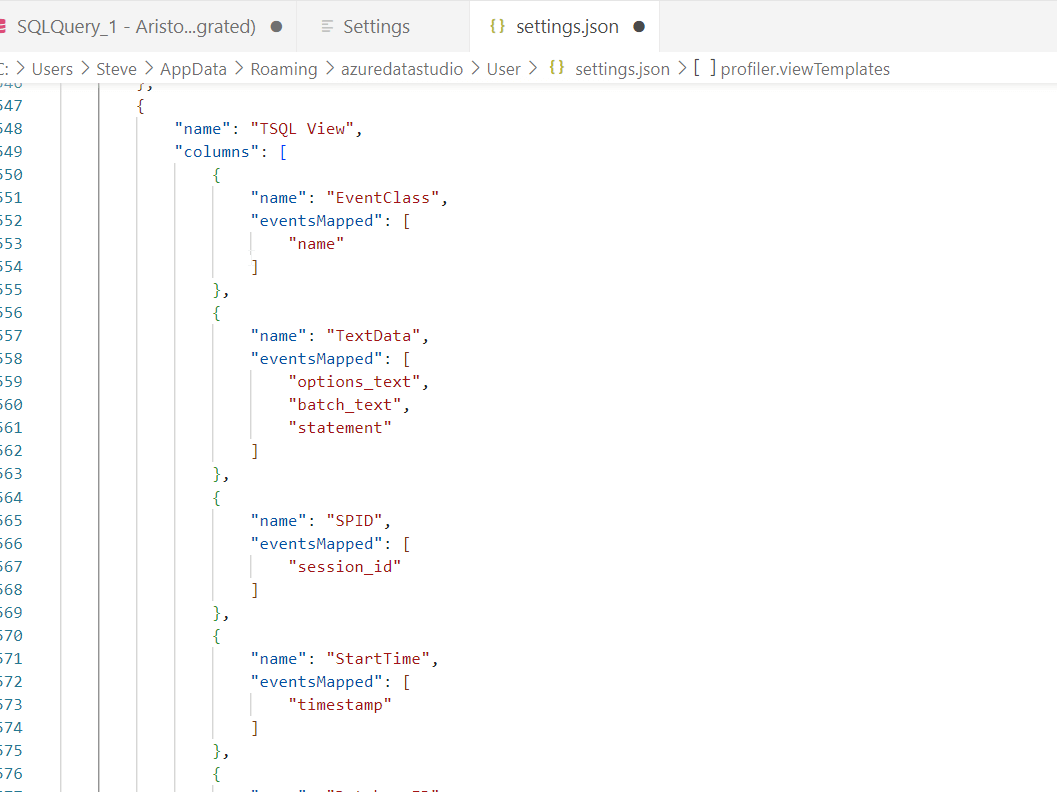
I edited this and changed the order of the columns. I added duration to the T-SQL view, and moved things around. I got a different view after saving my settings.json and restarting ADS. This took a couple tries, so I'm not sure what's up here. Still it worked, and this is a different view than I see above.
Filters
I can filter data, much like in SSMS. I won't delve into details, but there is a Filters button at the top that opens a dialog. I clicked "add" and then edited this to include a filter.

You can see when I clicked apply, this limited my data to one particular proc.

Downsides
One of the downsides of this Profiler is that it uses Extended Events, which can be weird and hard to deal with for many administrators. The data shown is different than Profiler, which can be frustrating. For example, in ADS, I see lots of batch_starting and rpc_starting, but no ending. So many of my app queries don't have a duration, which is something I'd want to see. I want the completed events as well. I can build my own trace, but then I'm not easily using this template.
I could edit the event session templates, but then I'd have to do that on every ADS install. That's not ideal.

I'm not managing a production server where I need the XEvents, and often if I worry about duration, I'd grab this from a single execution plan in SSMS or in Query Store. But if you're tracing events and trying to see something live on a dev system or with a workload, then you are depending on what's happening here.
It's not bad, but not great. However, the extension works well and it can be customized if you want. That's better than SSMS, AFAIK.
Summary
The Profiler extension in ADS gives you access to some data that you might not get without SSMS or custom work. This does work well, renders smoothly, has plenty of options, but keeps things simple. I like that. This is easier and quicker to use than the equivalent one in SSMS.
Give this a try and see if it's one of those tools that helps you do your job better by understanding what's happening in your databases.

