

Azure Data Studio (ADS) is a lightweight IDE built on Visual Studio Code. I've written a few articles on how the tool works, and this one continues the series. In this article, I want to look at the server and database dashboards and how you can customize them. Another article will cover the Database dashboards.
UPDATE: I forgot I needed to add the Server Reports extension, so that has been changed.
The other articles in this series on ADS works are listed in The Mastering Azure Data Studio Series.
- Getting Started with Azure Data Studio
- Getting Comfortable Writing Code in Azure Data Studio
- Using Notebooks in Azure Data Studio
- Using Azure Data Studio with TFVC
- Using Azure Data Studio with Git
- Editor Tips and Tricks for Azure Data Studio
- Using the Import Extension in Azure Data Studio
- The Profiler Extension in Azure Data Studio
- Server Dashboards in Azure Data Studio
You can download the tool and read those articles to learn about how to use this in writing code. I've gotten more comfortable with the tool, and while I still like SSMS, there are some features in ADS that I prefer.
The Server Dashboard
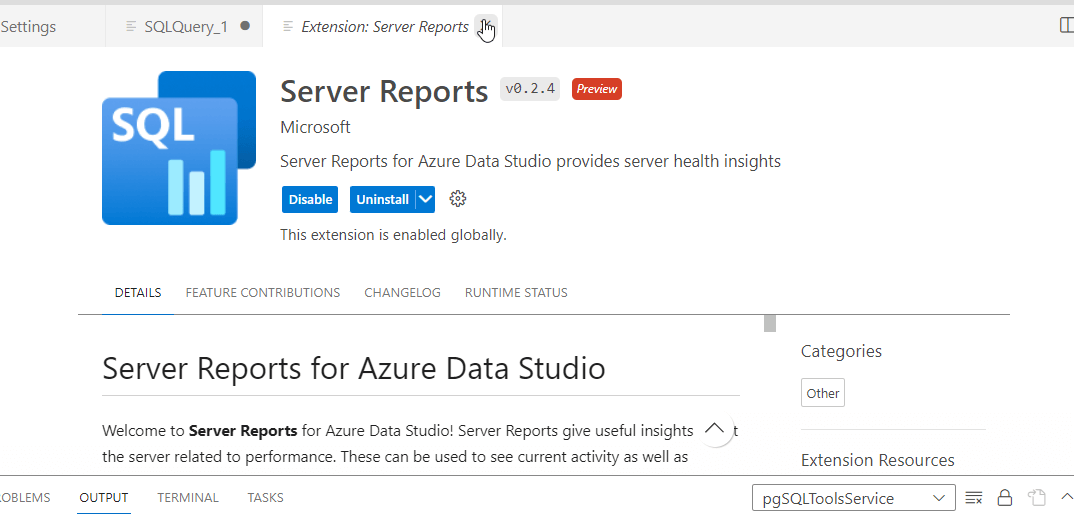
The first thing to do is install the Server Reports extension. This is in the Extensions tab.
Once installed, when you create a new connection in ADS and connect, a dashboard appears. As an example, here is a New Connection blade in ADS on the right. I haven't made this before or assigned to a group.

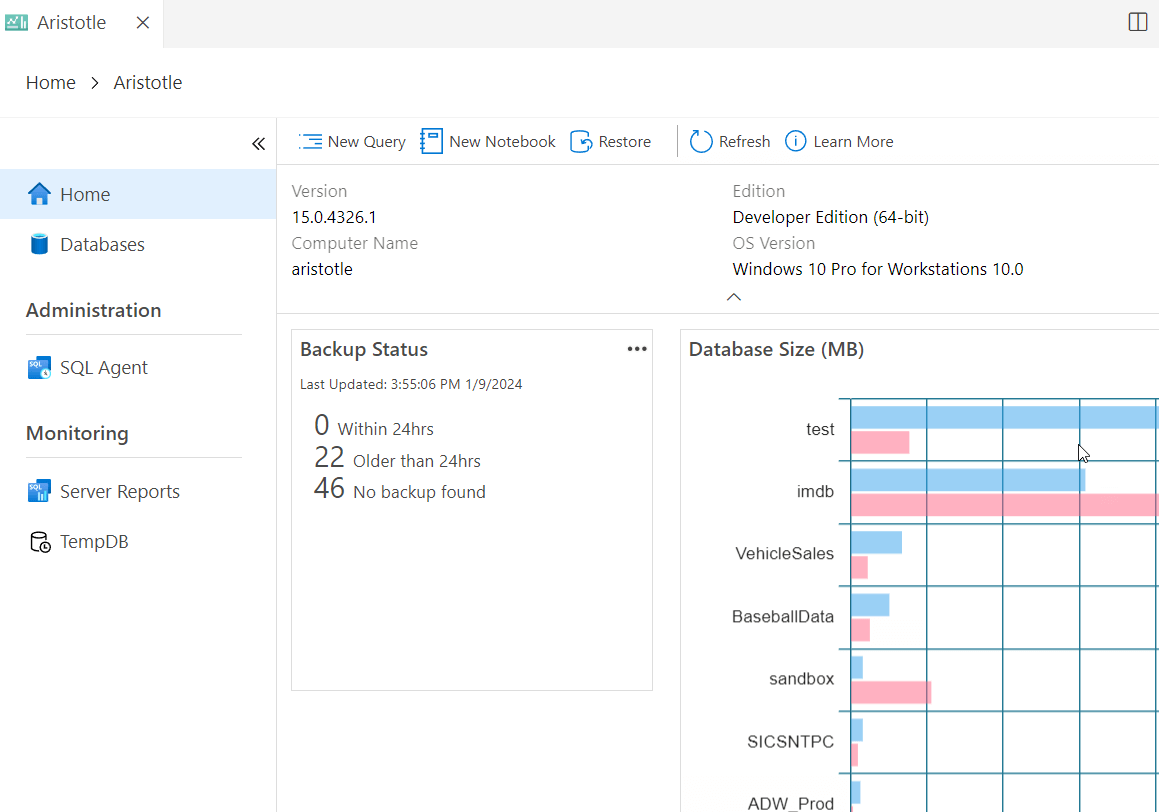
When I click Connect, this connects to the instance, and if successful, opens the server Dashboard. You can see this below, with some basic information about the server, and some navigation on the left side.
I can also get to this by right clicking a connection in the Server list and selecting "Manage".

We will now look at the different sections of this dashboard and what we can learn from it.
Default Information
The main page of the dashboard gives you an overview of the instance itself. You can see the version, edition, and host information. This is in the main widget at the top of the page on the right (Seen above). Below this are two default widgets. There is a backup widget that aggregates information for all your databases, letting you know the age of backups. As you can see, this is a dev instance and I'm not running backups for most of these databases.
The other widget is a chart of databases and their sizes. You can hover over a database file (data or log) and see the actual size, since the chart doesn't provide any scale.

These are the only widgets included with ADS, but you can customize this section, as I'll show below.
Note that you can also open a new Query window or notebook, refresh the entire dashboard, or restore a database. If you click Restore, you get a dialog allowing you to pick the source, database target, etc. This is shown below and I think it's self-explanatory, but if anyone is confused, I'll do an article on this.

SQL Agent
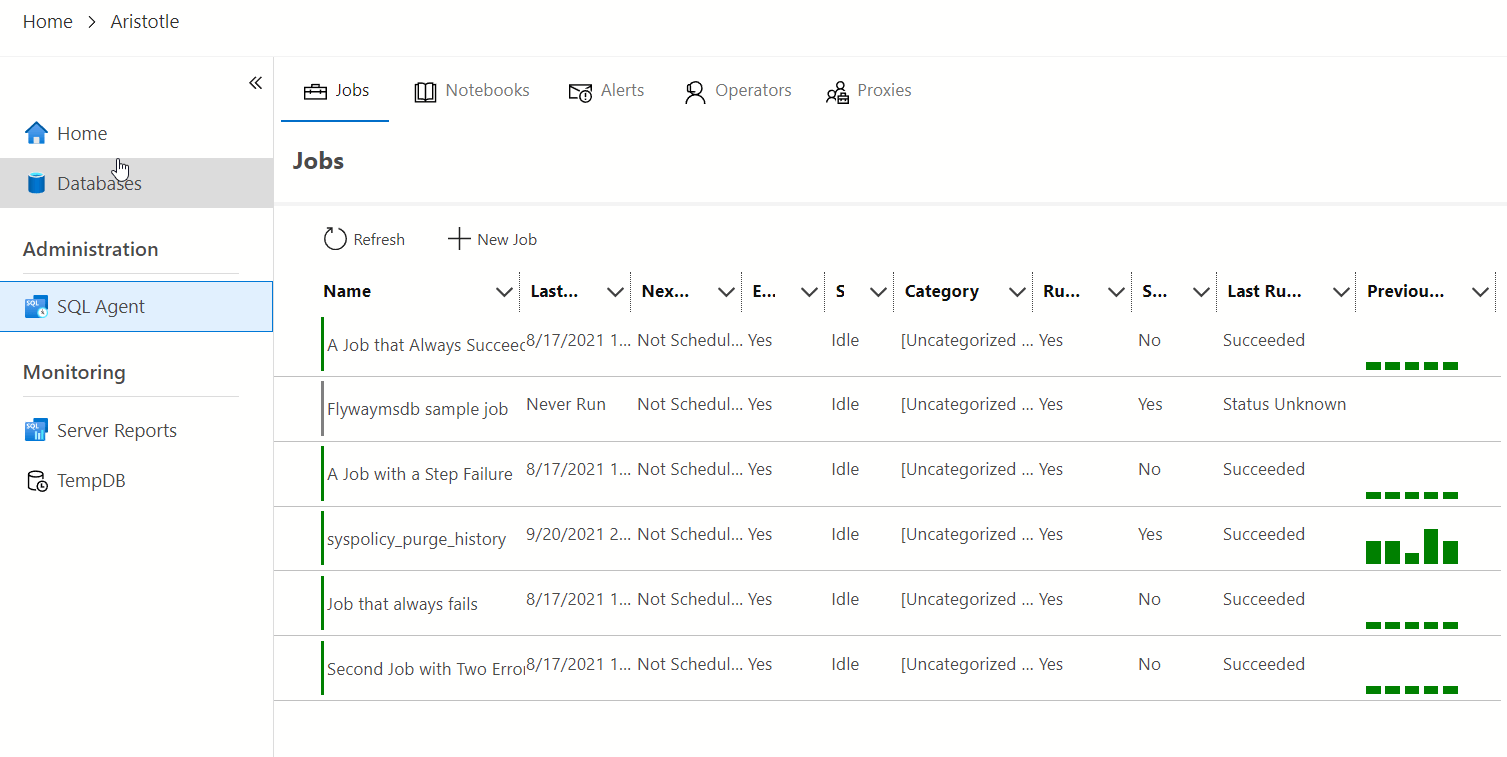
We will skip the Databases for now, but there is an Administration section on the dashboard with one entry: SQL Agent. If I click this, I get a list of jobs and some information about them. The columns are collapsed to fit the window, but this includes the following information:
- Job name
- Last run datetime
- Next scheduled run datetime
- Enabled status
- Status
- Category in SQL Agent
- Is the job runnable
- Last run status
- 5 Previous run status
You can see this in the image below.
Any of these columns can be a filter, or resort the data. For example, if I click on the Last run status, column, I see a small popup, as shown below. There are choices to sort the data or filter based on what values are in the table.

If I click on a row in the table, I get more details. For example, I'll click on the syspolicy_purge_history job, which is a default. The overview shows me this ran a few years ago and it succeeded at least 5 times. When I click and see the details, I get a view of the history of the job on the left, with the datetime and status. On the right, I see the last status message by default. Clicking on any row in the left gives me the details on the right. At the bottom I see the individual steps of the job and their status.

Jobs management in ADS is probably worth another article at some point. You also can see the Run, Stop, Refresh, and Edit buttons at the top, giving you more options.
Above these, there are the options for Notebook jobs (new), Alerts, Operators, and Proxies. Again, worth a separate article to delve into these.
Performance Dashboards
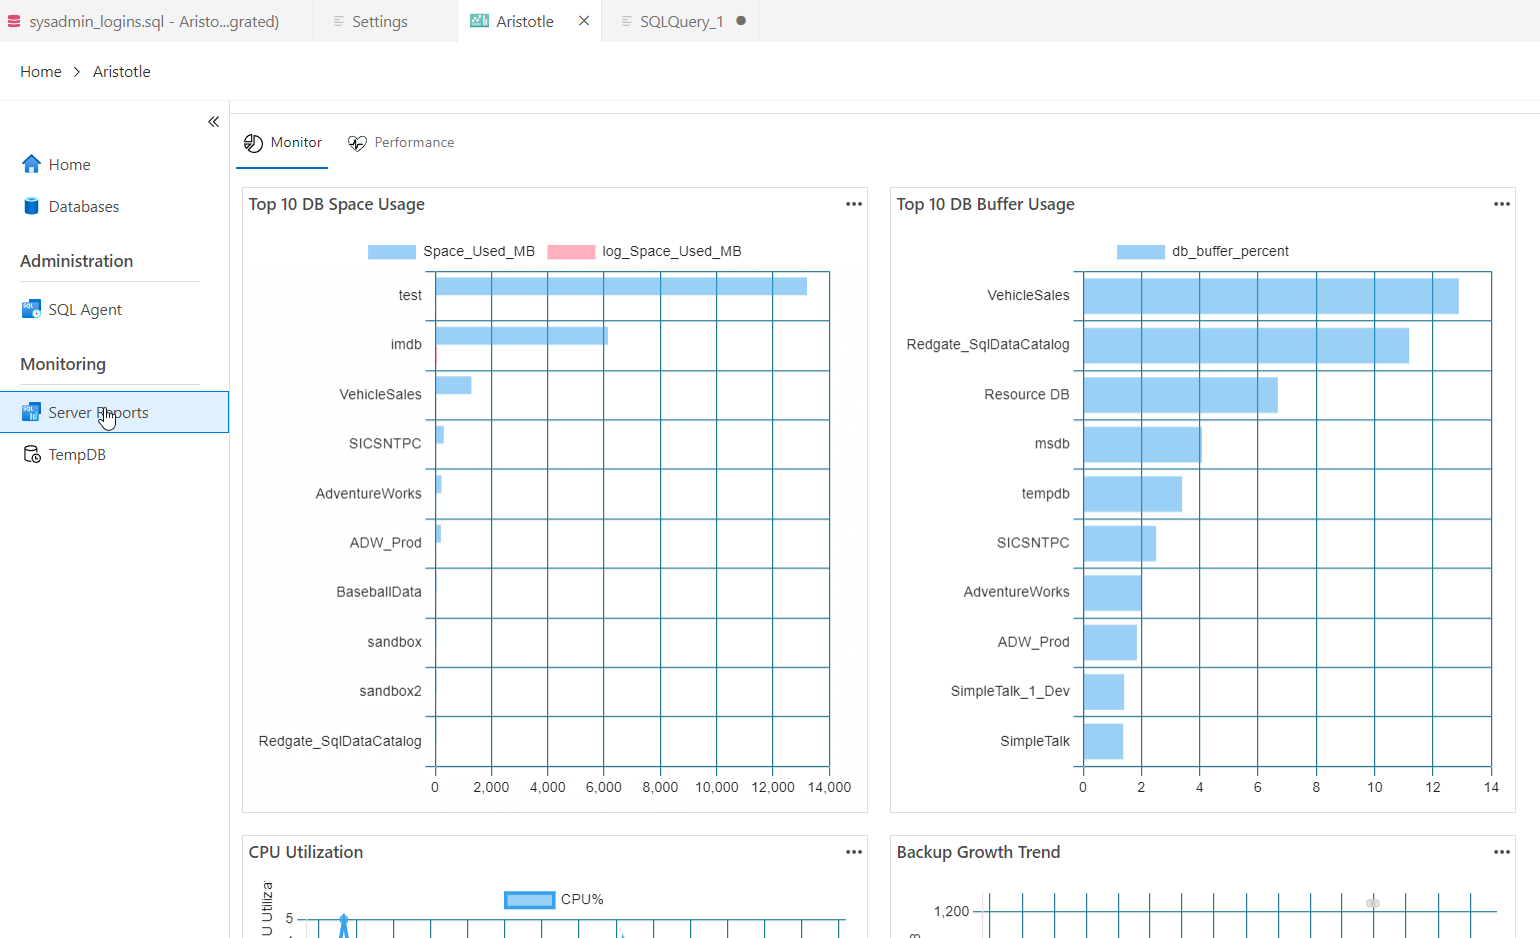
Below the Administration section is a Monitoring section. In here, there are two items by default: Server Reports and Tempdb. The Server Reports include a few widgets (shown below) that gather information from the instance and graph it for you. We have Top 10 database usage for space and buffer pool. We also have the backup space trends and CPU usage. Quick glance views of metrics for your instance.
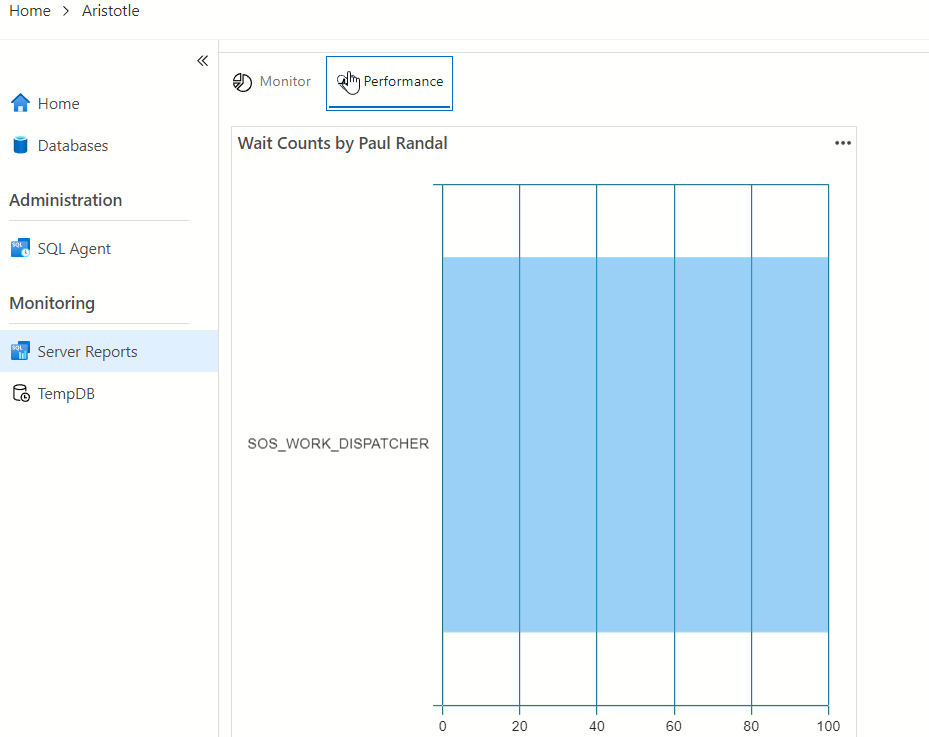
The monitoring tab here only has one tab, showing Wait counts by Paul Randal. How many people get their name in a tool that monitors anything?
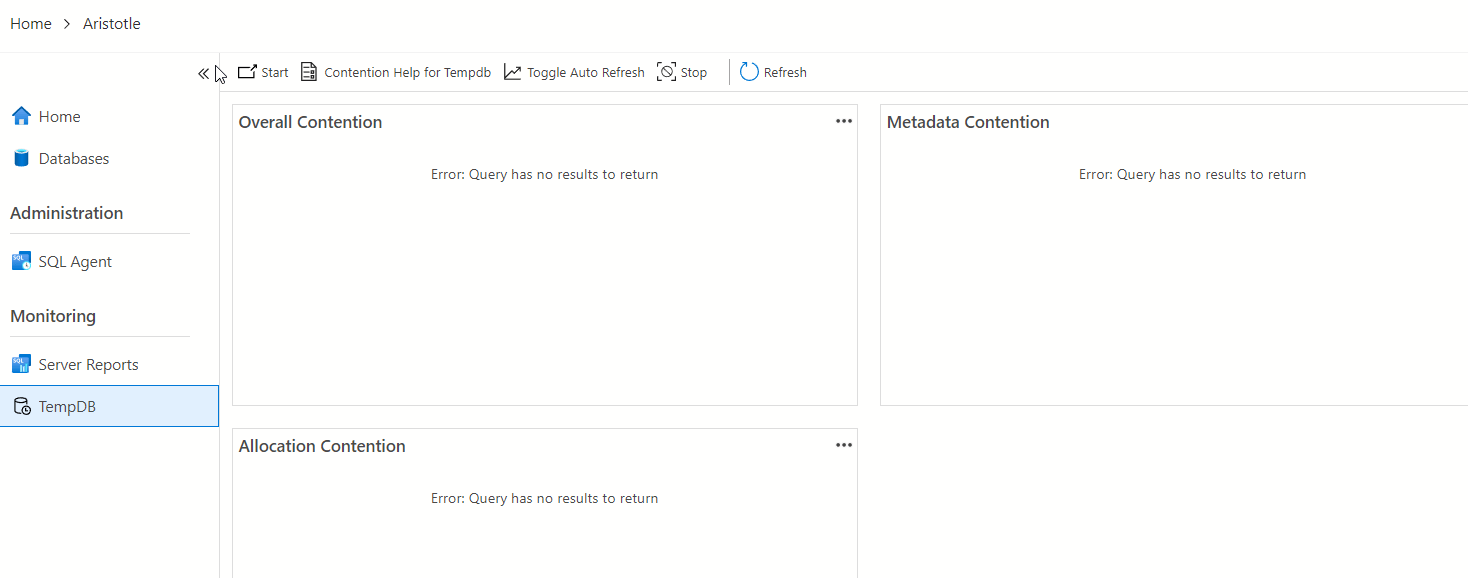
The Tempdb item shows nothing by default. Actually, it shows errors.
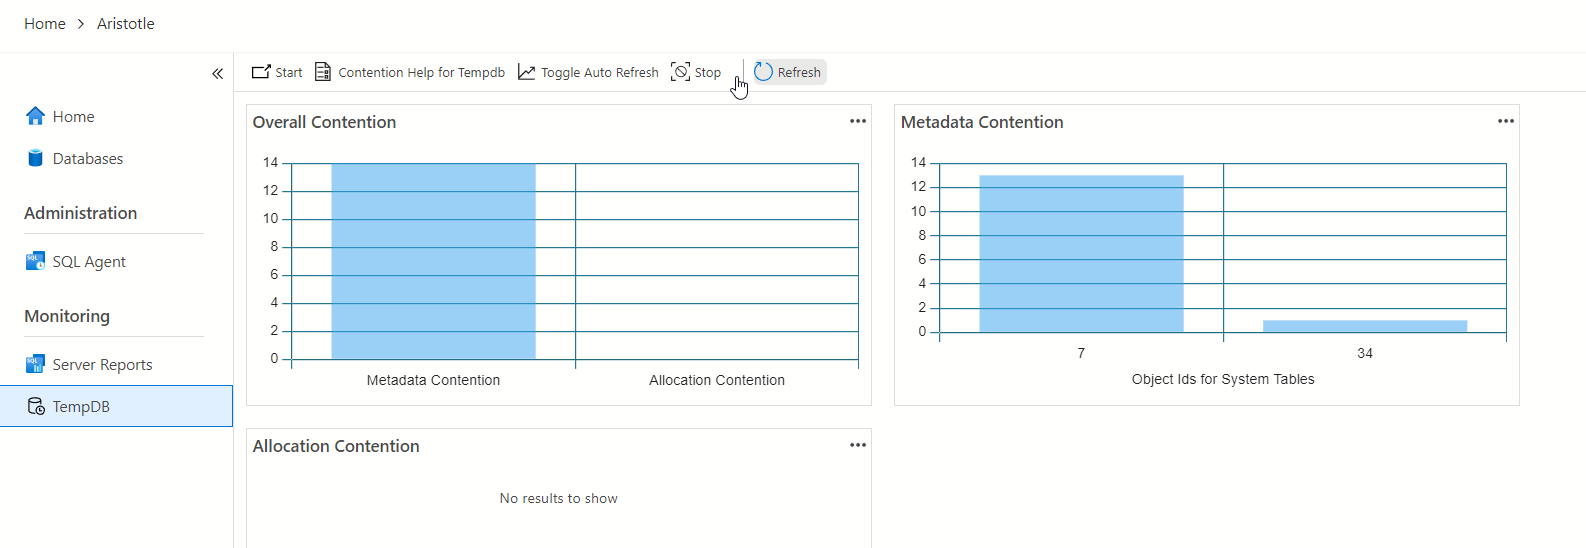
However, if I click "Start", an Extended Events session starts. I can then click Refresh and I'll see data. Note, this is starting a session on your instance, so if you don't click stop, it continues to run.
Customizing the Server Dashboard
One of the nice things about the dashboards in ADS is that we can add code to the dashboard definition to change the display of what we want. This section looks at how we can do that. We will duplicate one of the current widgets, but change it slightly, and then add our own widget to get a list of sysadmin logins.
Note: the default widgets that appear (backup count and database size, are not coded in the setting, so customizing the dashboard will remove these from your dashboard.
There are a few steps to creating a widget:
- write a query and save it
- get the code for a visualization of your query results
- copy the code into the settings section of the json configuration file.
Let's create a couple customizations. First, let's open the dashboard and pick the existing widget. I click the three dots in the upper right corner and select "Run Query".

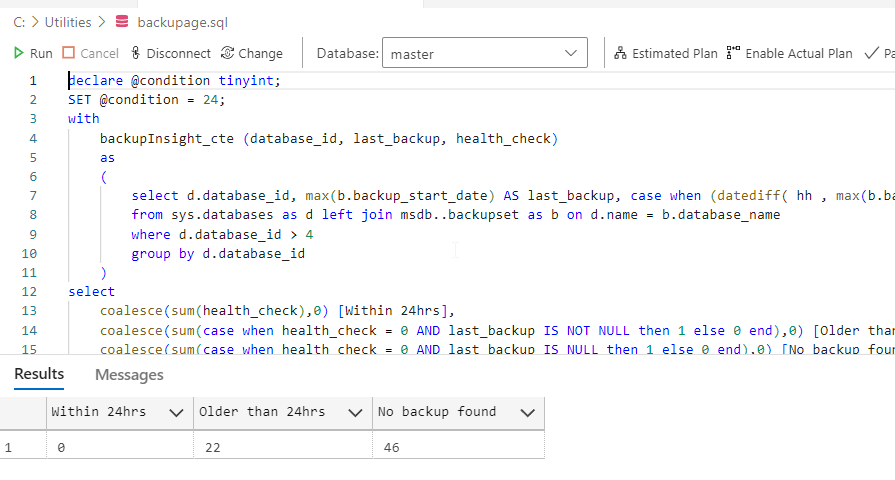
This opens the query in a new window. I can see the code that gives me the data from the widget. I can run this or alter it as needed.
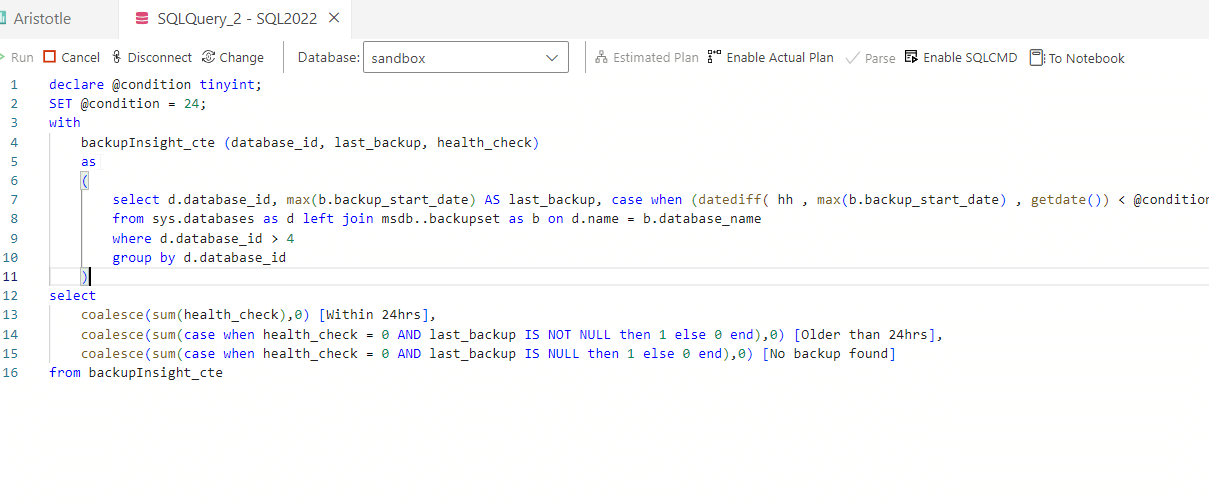
First, however, I need to save this. For me, I have a place where I keep random things I use often, so I will save this in c:\utilities. Once I do that, I'm ready to proceed. First, I'll run the query. Note this didn't work well, because I think there is a security setting. Once I closed and re-opened the file, I was asked to open it in restricted mode. This may be different for you, but once you get the query open, run it. You can see the results below.
In the results pane, on the right side, there are a number of icons. The bottom one is for charting. Pick this one:

That then opens the results, by default as a bar chart, but as you can see, there are a number of options. More than I've shown below. As you select these, your chart changes.
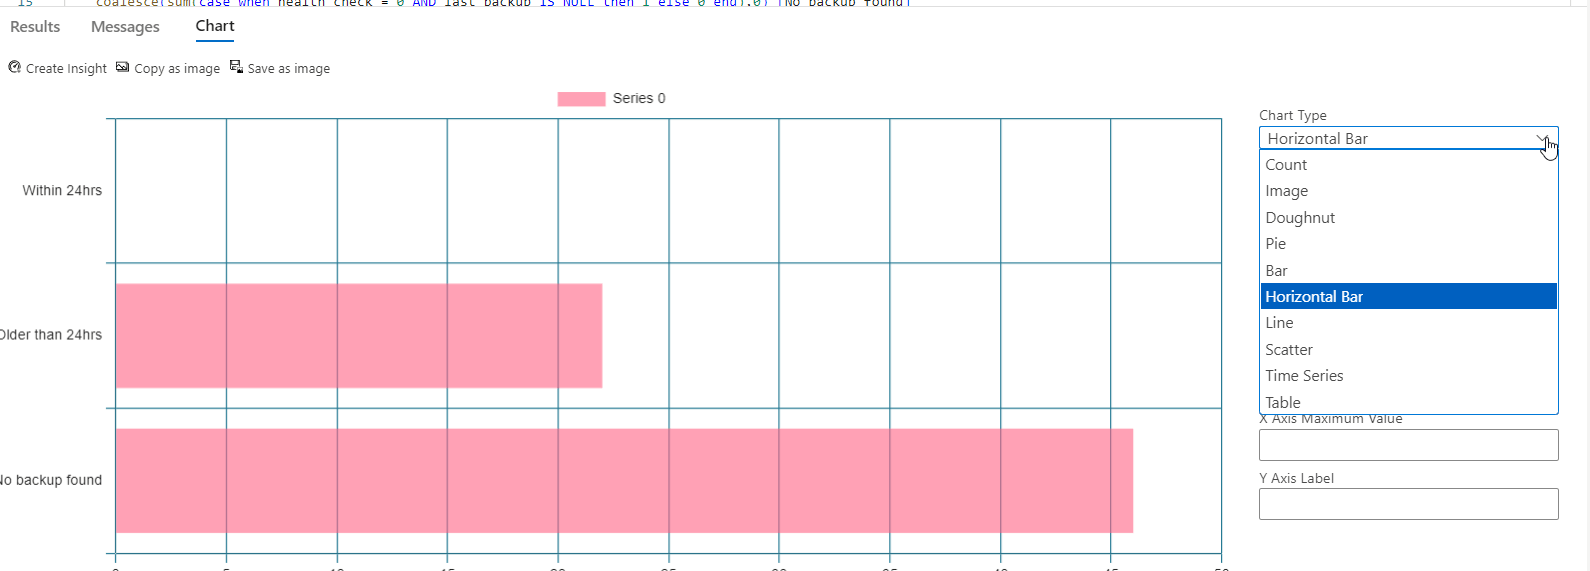
You can also the various settings to make this work for your needs. Once you have the chart you want, in the upper left corner, there is a "Create insight" button you can press. Click that.

This opens as new window, which has the code for the chart. You don't need to save this, but you do need to copy it. CTRL+A and CTRL+C.
Now we need to put this in the settings. First, open ADS settings. You can use the command palette or File | Preferences | Settings. Search for server widget. You can see on the right side, one of the results is this entry.

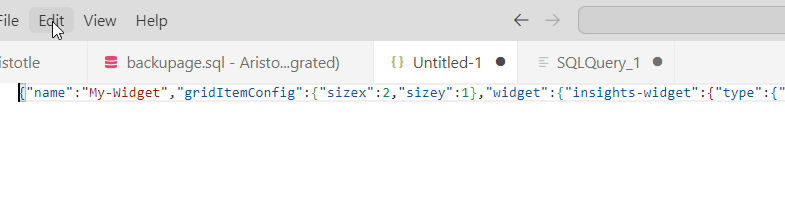
We will click the "Edit in settings.json" and a new window will open that has the cursor at the correct places in the settings file. My file was empty in this last value, below dashboard.server.widgets, and I pressed CTRL+V to paste in the insight code.

Once this is done, save and close this file, close the dashboard, and then re-open it by clicking your connection and selecting Manage. I now see my new customized dashboard widget.

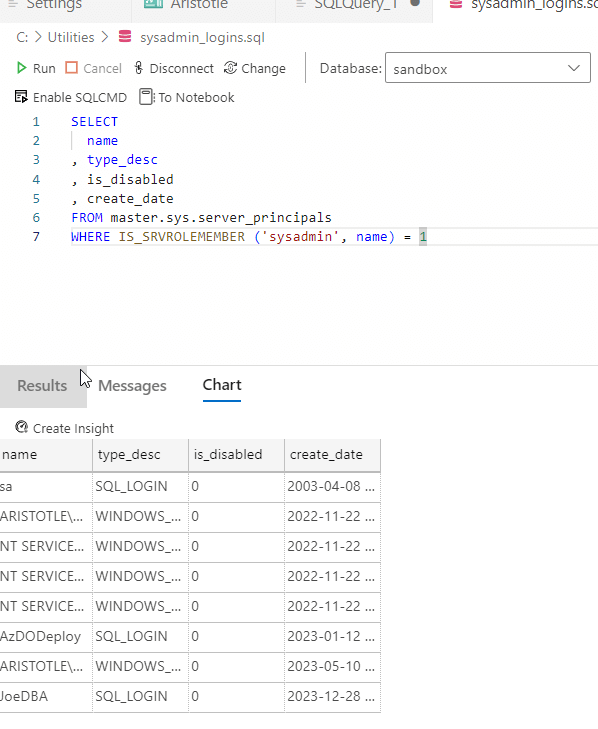
Let's add one more widget. This time, I'll write my own query to get information about sysadmins. That's something I want to keep track of, and actually, it's actually something I'd watch with a metric in a monitoring tool, as I want to know when this changes. In any case, I'll use this query:
SELECT
  name
, type_desc
, is_disabled
, create_date
FROM master.sys.server_principals
WHERE IS_SRVROLEMEMBER ('sysadmin', name) = 1
I'll save that, and then run it. In this case, I'll pick a different type of chart. I'll use a table. Here's my visual in the query window.
I'll click Create Insight, get the code in a new window, and copy it to my settings file. Note, I need to add a comma between the two sets of insight code to make this valid JSON. Once that's done, I'll re-open my dashboard and I see this:
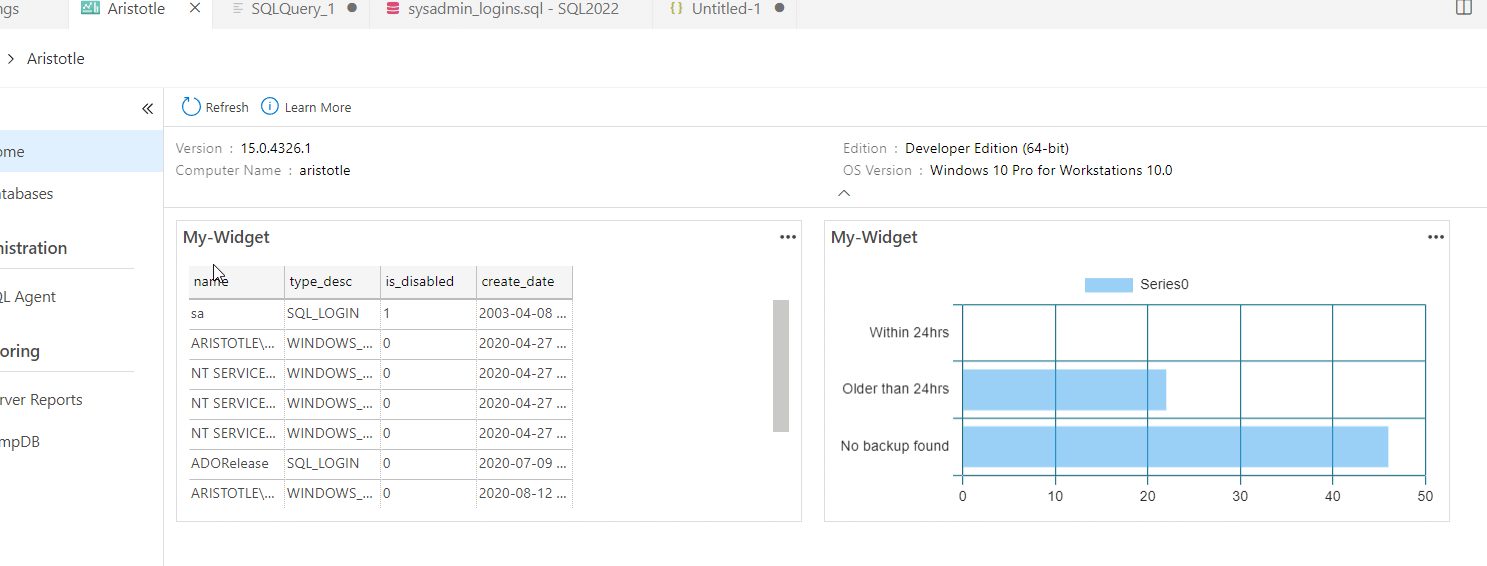
I can continue to add more widgets as I want.
Summary
This article looked at the Server Dashboard in ADS, which is pre-configured with a number of items. We saw the overview section, the jobs and the performance graphs. We also learned how to customize the dashboard with our own widgets.
