

Introduction
MDX in Power BI will help us to extract part of the information from multidimensional cubes in our report in Power BI. This article is for newbies in SSAS and MDX, but that work with Power BI. MDX means Multidimensional Expressions. It is the language used in SSAS to query data. In this article, we will teach how to work in MDX and create some queries to generate reports in Power BI.
Requirements to use MDX in Power BI
This article will require to have the AdventureworksDW database and the SSAS Multidimensional project.
For more information about how to install the database and the multidimensional project, refer to our previous article related. I strongly recommend following the previous article first and then starting with this one.
Getting started
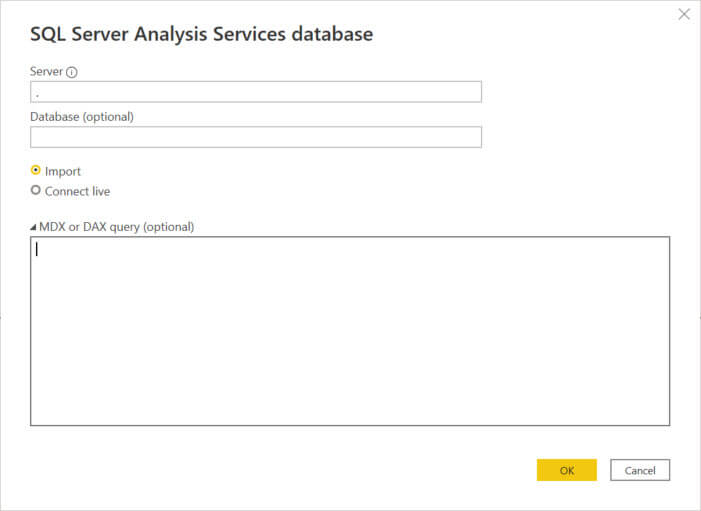
First, in Power BI, get data from Analysis Services.

Secondly, write the SSAS Server name. The Server is the SQL Server Analysis Services Server (SSAS) name. Usually, it is the name of the Windows Server. In this example, I wrote a period “.” which means that we will connect to the local SSAS Server. You can write the database name, but it is not necessary. In this example, the database name is. AWDW2019Multidimensional-EE.
In the MDX or DAX, we will write a query in SSMS.
I will pause the use of Power BI for a moment and provide you with a little SSMS and MDX tutorial in the next section to understand how to work with MDX.
Getting started with MDX in SSMS
I strongly recommend using SQL Server Management Studio (SSMS) to write the queries, test them, and then copy-paste them to Power BI. It is easier to write the code there and test it.
First, to connect to SSAS, in SSMS go to Connect>Analysis Services.
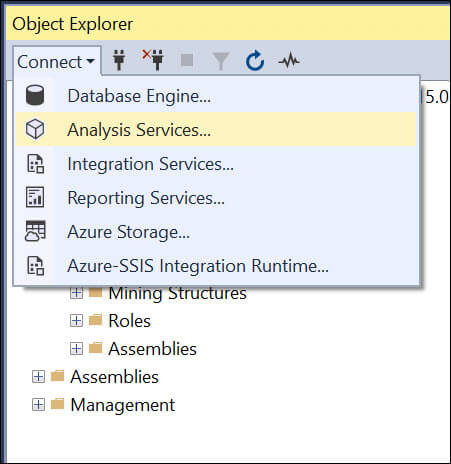
Secondly, write the SSAS Server name and connect to it. If you do not have permissions ask the SSAS administrator to grant you the permissions.

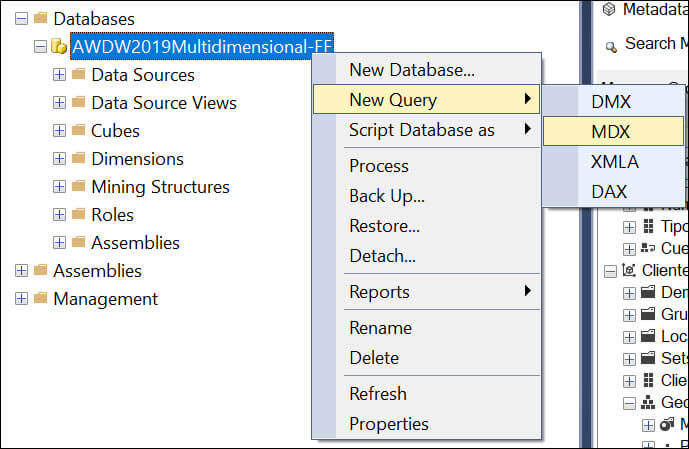
Thirdly, right-click in the Object Explorer the SSAS Database and select New Query>MDX
The Execute button in SSMS is used to execute the queries. You also have buttons to comment and uncomment the code and finally, you have buttons to increase and decrease indent.

Also, you will be able to see the cube name and measures. The measures are aggregations such as a SUM, Average, and Count to measure things like the total sales, tax amount, Gross Profit, etc.

In addition, you have the dimensions to get the measures by date, customer, and geography. The dimensions are used to organize the data in relation to areas of interest like geography, dates, products, etc.

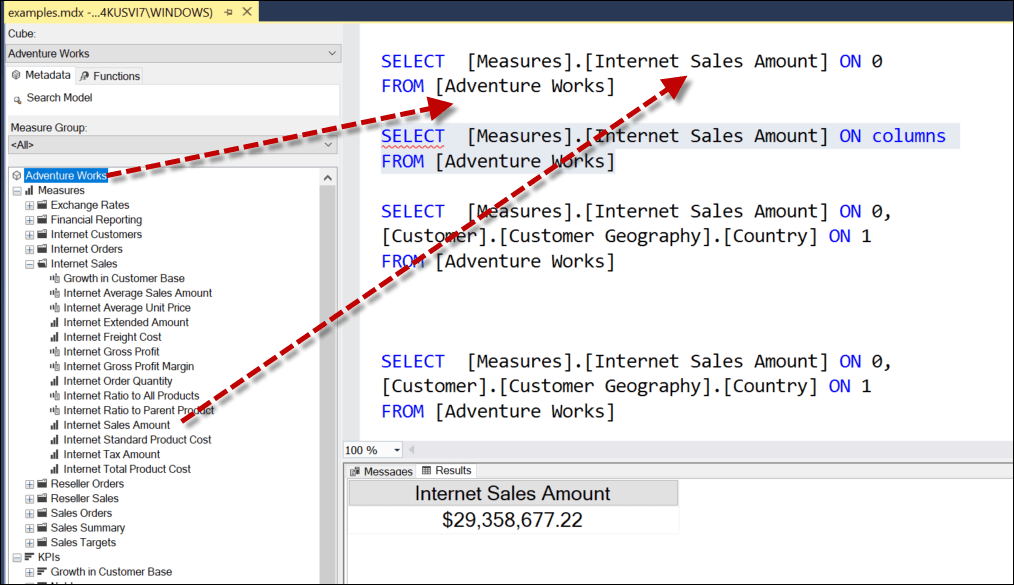
Something that I like about SSMS, is that you can drag and drop cubes, dimensions, and measures to generate the report.
In SQL Server central, we created a tutorial about MDX that you may find useful. The article is old, but 90 % of the information is applicable to the current MDX.
Some MDX queries
First, we have a query that shows the total Internet Sales Amount measure from the Adventure Works cube.
SELECT [Measures].[Internet Sales Amount] ON 0

FROM [Adventure Works]

We could say that the measures are similar to columns and the cube is like a table (they are not, but if you like SQL, these tips can help to understand the code).
Secondly, instead of using 0, you can write columns that will return the same results.
SELECT [Measures].[Internet Sales Amount] ON columns

FROM [Adventure Works]
Thirdly, we will show the total internet sales per country. We will use the Customer dimension for this purpose.
SELECT [Measures].[Internet Sales Amount] ON 0,

[Customer].[Customer Geography].[Country] ON 1

FROM [Adventure Works]

Alternatively, you can use the words column and rows instead of 0 and 1 with the same results.
SELECT [Measures].[Internet Sales Amount] ON columns,

[Customer].[Customer Geography].[Country] ON rows

FROM [Adventure Works]
Also, you could easily PIVOT or UNPIVOT rows by changing the rows per columns.
SELECT [Measures].[Internet Sales Amount] ON rows,

[Customer].[Customer Geography].[Country] ON columns

FROM [Adventure Works]

SELECT [Measures].[Internet Sales Amount] ON columns,

[Customer].[Customer Geography].[Country].[Australia] ON rows

FROM [Adventure Works]
In addition, we will show the internet sales in Australia only.
SELECT [Measures].[Internet Sales Amount] ON columns,

[Customer].[Customer Geography].[Country].[Australia] ON rows

FROM [Adventure Works]

We have also two wonderful articles about MDX that I am sure will help you to enter the MDX word:
- MDX Guide for SQL Folks: Part I - Navigating The Cube
- MDX (MultiDimensional Expressions) in 148 minutes
Now, go to Power BI again.
BACK to MDX in Power BI again
Previously, we learned to use MDX, we will copy and paste the following MDX query in Power BI now and press OK.
SELECT [Measures].[Internet Sales Amount] ON 0,

[Customer].[Customer Geography].[Country] ON 1

FROM [Adventure Works]

First, press the Transform Data button.

Secondly, change the name of the query settings.

Thirdly, double-click the country name, and rename it to Country and Internet Sales Amount.

Also, close & apply to save the changes.

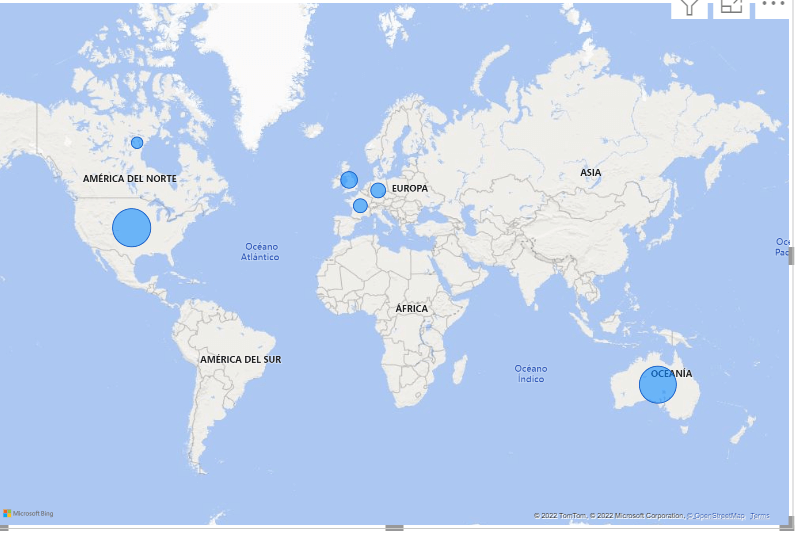
In addition, in Power BI, check the Country and Internet Sales columns.

You will be able to see the data generated by the MDX query.
You will see more sales in America and Australia and fewer sales in Europe and Canada.
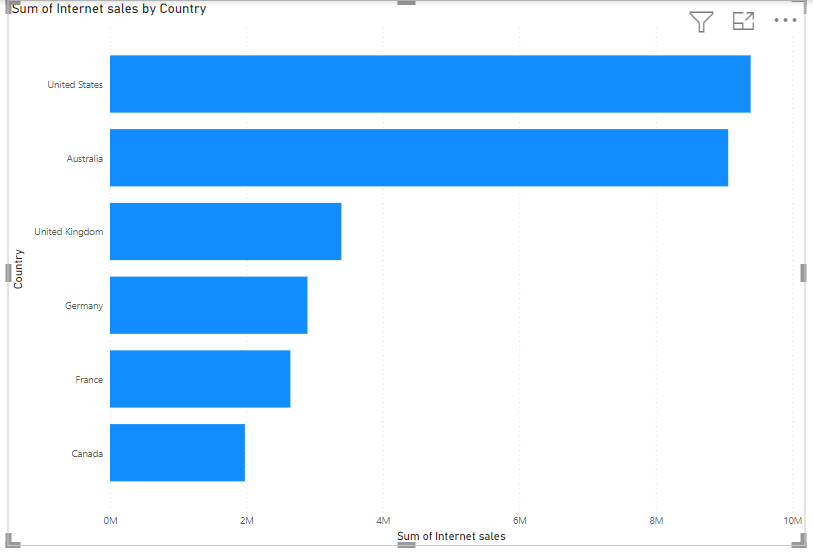
Alternatively, you can use the stacked bar and see the results there.

Finally, you can check the results with the stacked bar.
Conclusion
MDX in Power BI is necessary when you need to access multidimensional data. In this tutorial, we used MDX in Power BI to query an SSAS Multidimensional cube and extract the information.
Also, we advised using SSMS to create and test your MDX query. It is easier to test, read and debug your queries there.
Finally, we copied and pasted the MDX query to Power BI and generated some reports.
