

In this article, we will learn how to connect an Analysis Services database in Power BI. This article is oriented toward people who are learning SSAS and want to create some reports using Power BI.
Multidimensional projects
Analysis Services is an OLAP technology used for decision support that can be complemented with Power BI. In this example, we will show how to connect Power BI with an Analysis Services Multidimensional project.
Requirements to connect an Analysis Services database in Power BI
First of all, you need to have the AdventureworksDW database installed. In this example, we are using the AdventureworksDW2019 database.
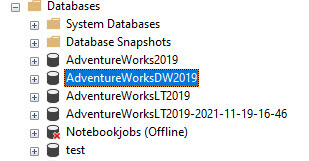
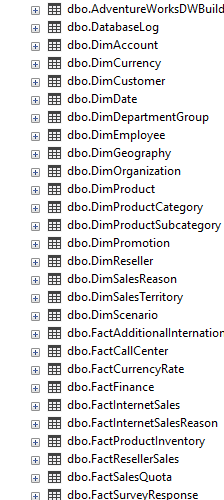
The database contains dimensions and fact tables used to generate multidimensional cubes.
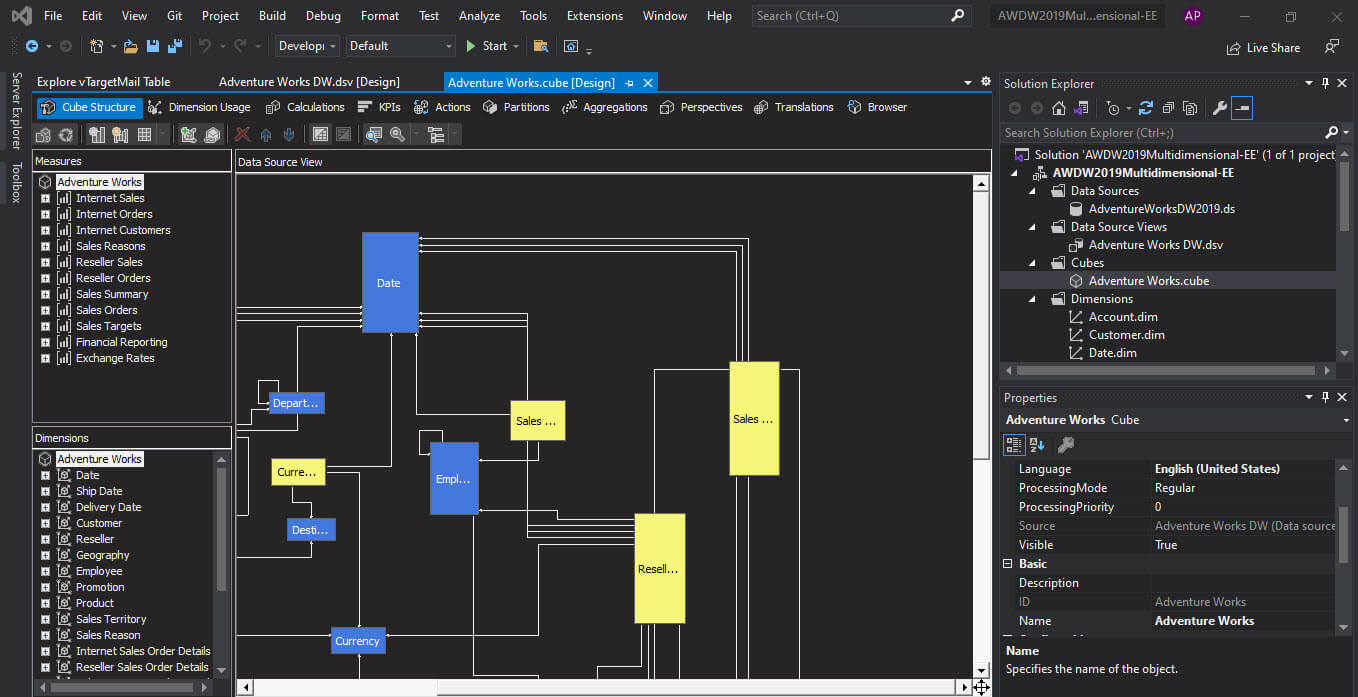
Secondly, we have the Adventureworks Multidimensional project. This is a project that contains data an example to show the features and information that you can get from the multidimensional database.
You can download the Multidimensional project here: Download SSAS Multidimensional project.
You will need to unzip the project and open it.
Right-click the AdventureWorksDW Datasource and select properties.
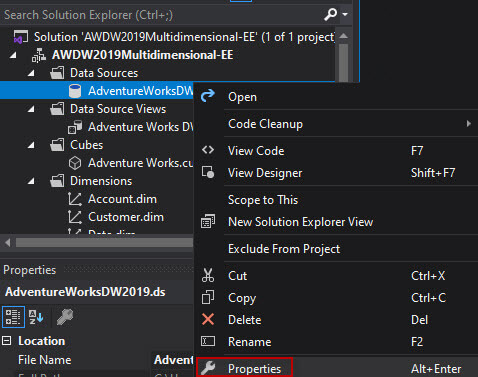
Go to Impersonation information and use a specific Windows name and password.
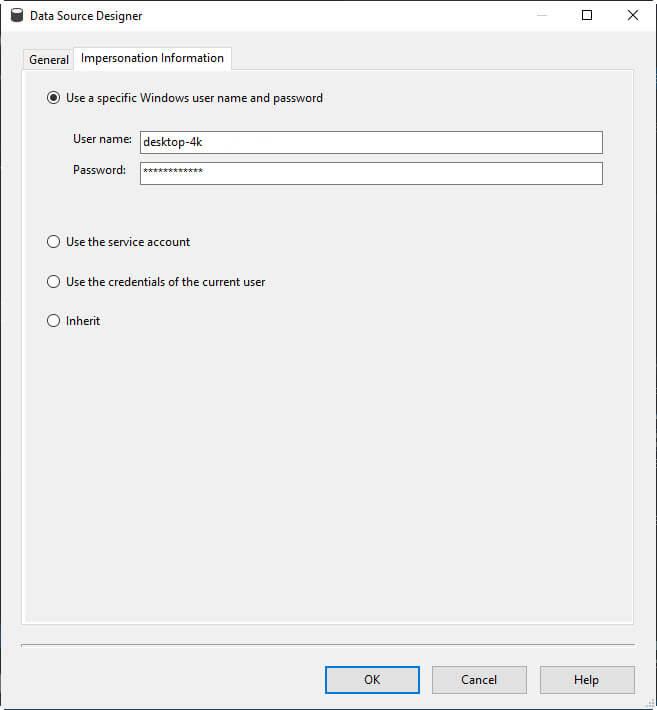
Finally, make sure that you can connect to the AdventurewordsDW2019 database.
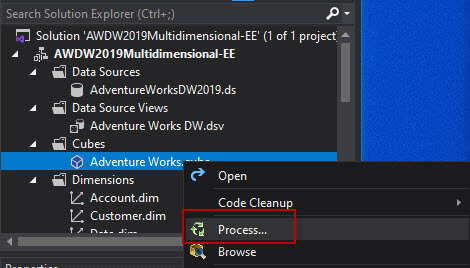
Process the cube
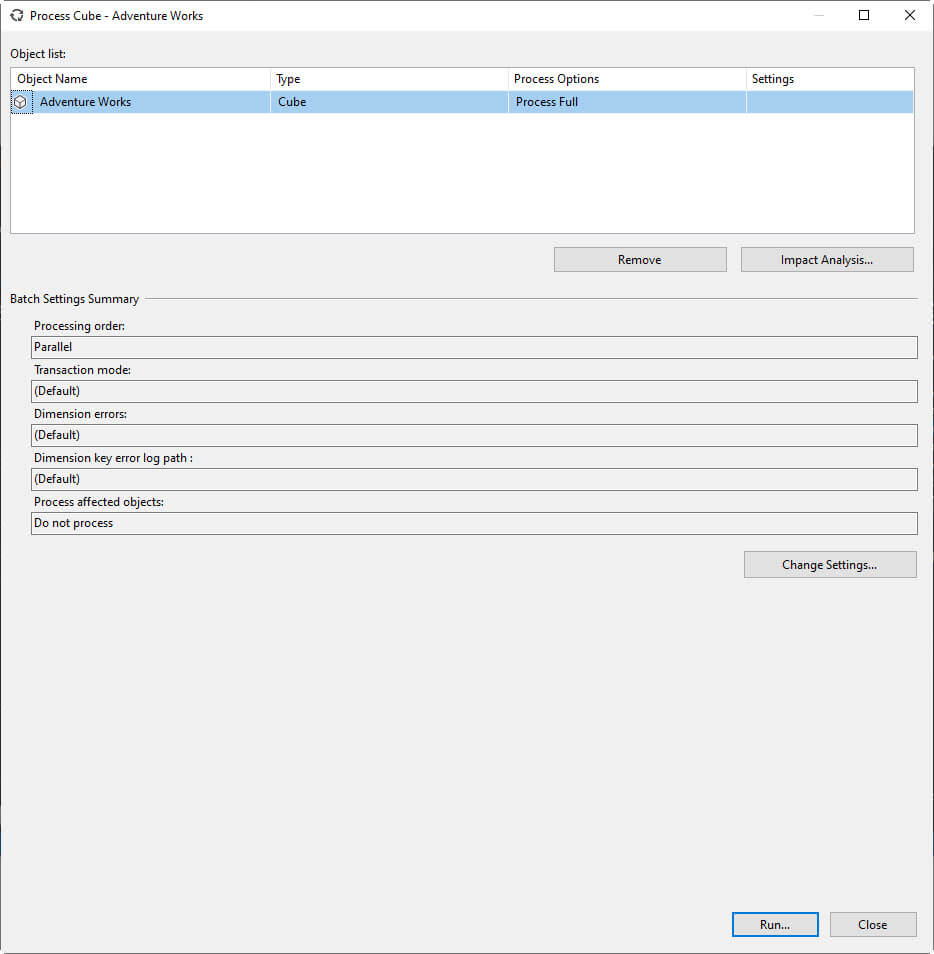
Processing the cube allows having the information up to date in SSAS. First, we will Process the cube information including all the dimensions and cubes from the model.
Secondly, Run the process with the Run button.
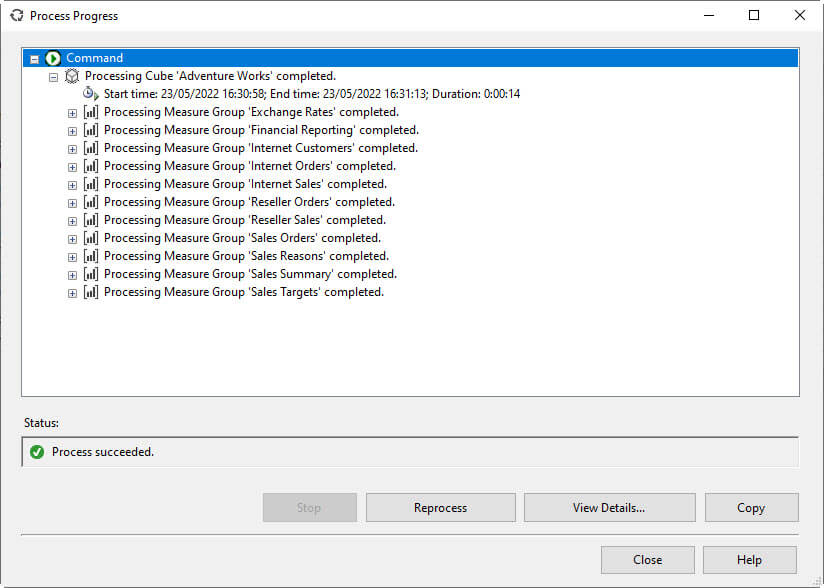
Finally, if everything is fine, the Measuregroups and dimensions will be processed and a green Process succeeded message should be displayed.
Connect with Power BI
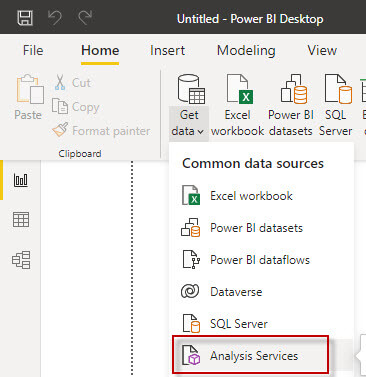
First, I am assuming that you have Power BI Desktop installed. Once installed, go to Home in the menu and select Get Data>Analysis Services.
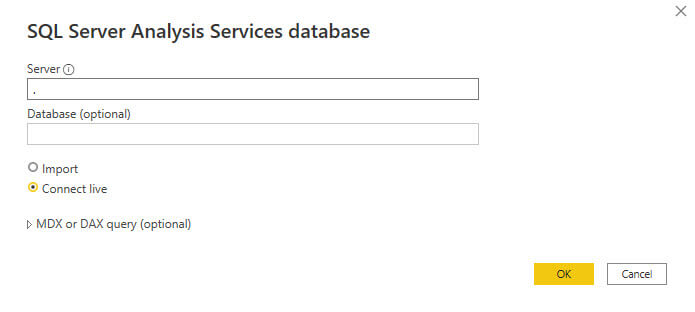
You will be asked the SSAS Server name with the multidimensional model. Write the Server name. Optionally, you will be asked the name of the database. It is possible to import the data or you can connect to get the data. Also, you can generate MDX queries or DAX queries if you want to get the data.
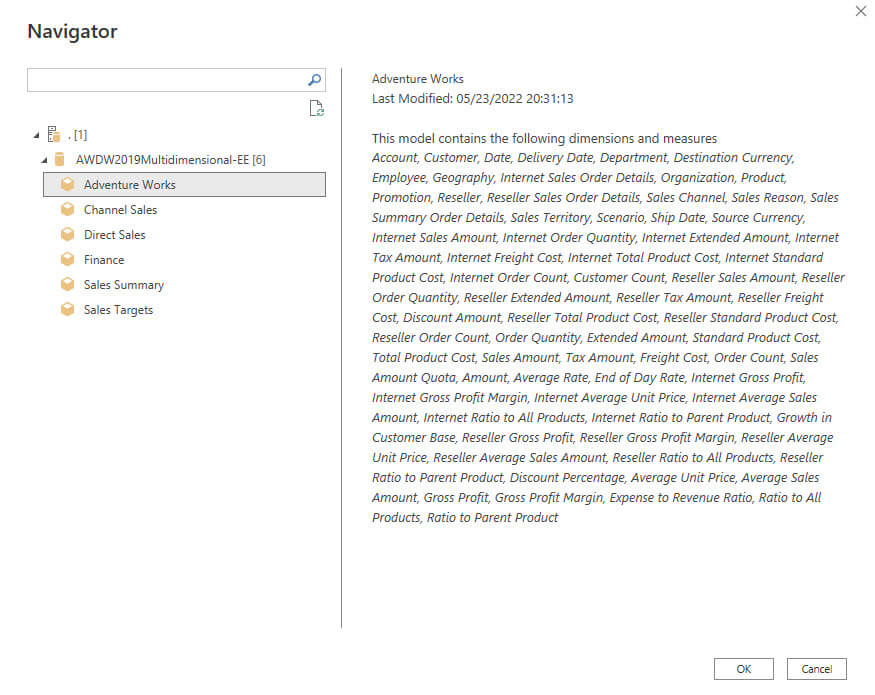
Power BI lists all the measure groups. Select the Measure group that you want to analyze and press OK.
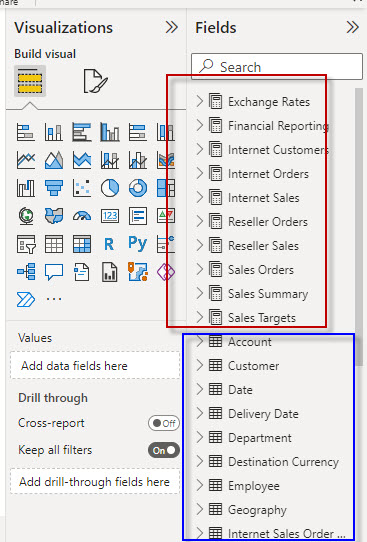
Also, once selected, you will see the Measure groups (in red) and the dimensions (in blue).
Create reports
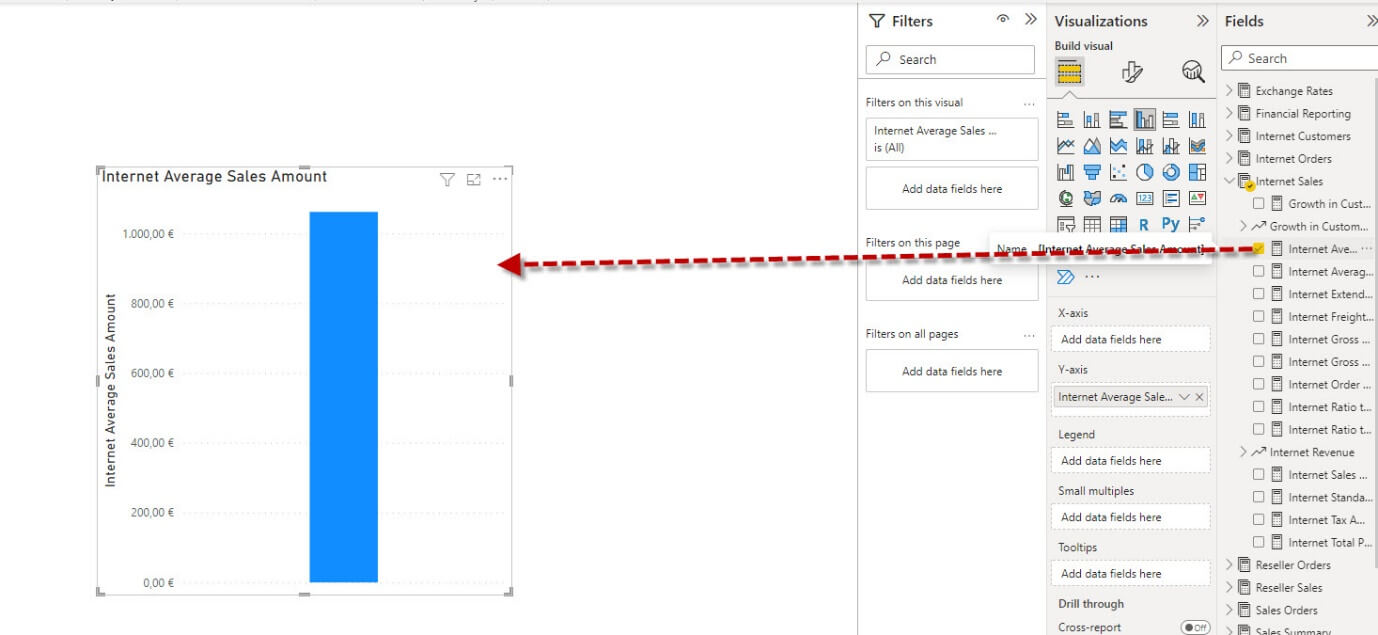
We will create some reports based on the Analysis Services project. First, drag and drop the Internet Average Sales Amount.
Secondly, include the Product Category in order to see the sales by category. 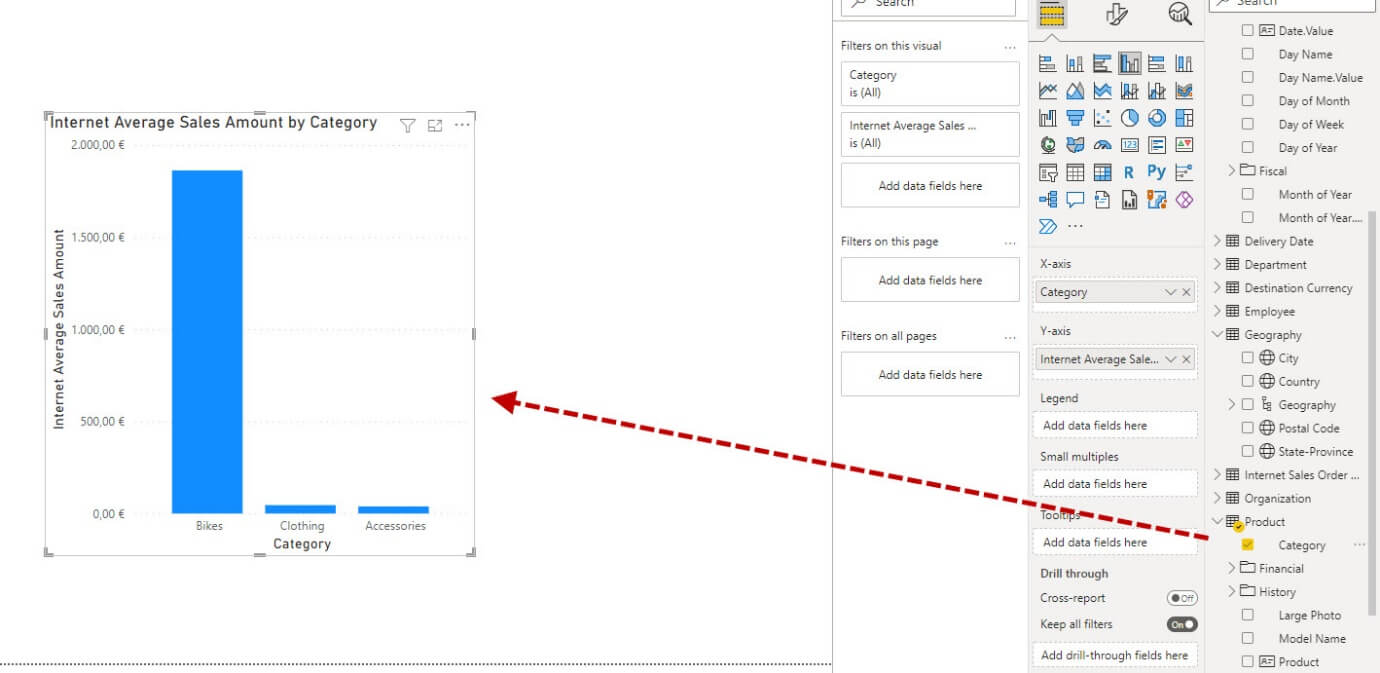
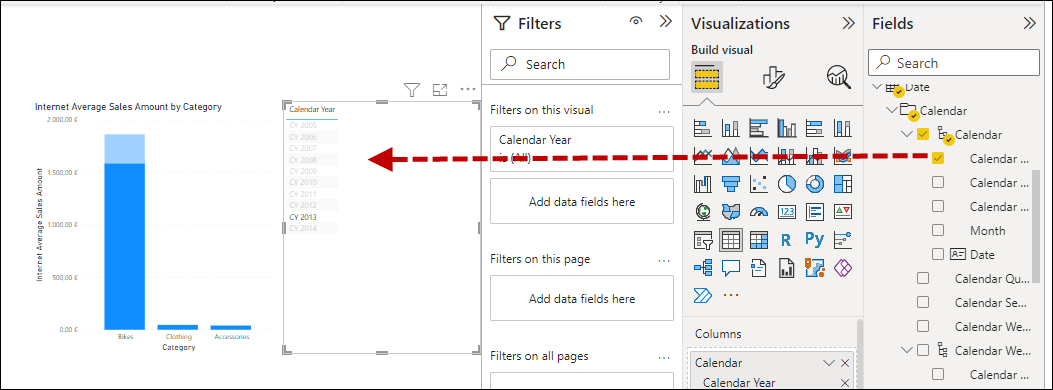
Thirdly, we will add a filter using the Calendar Year.
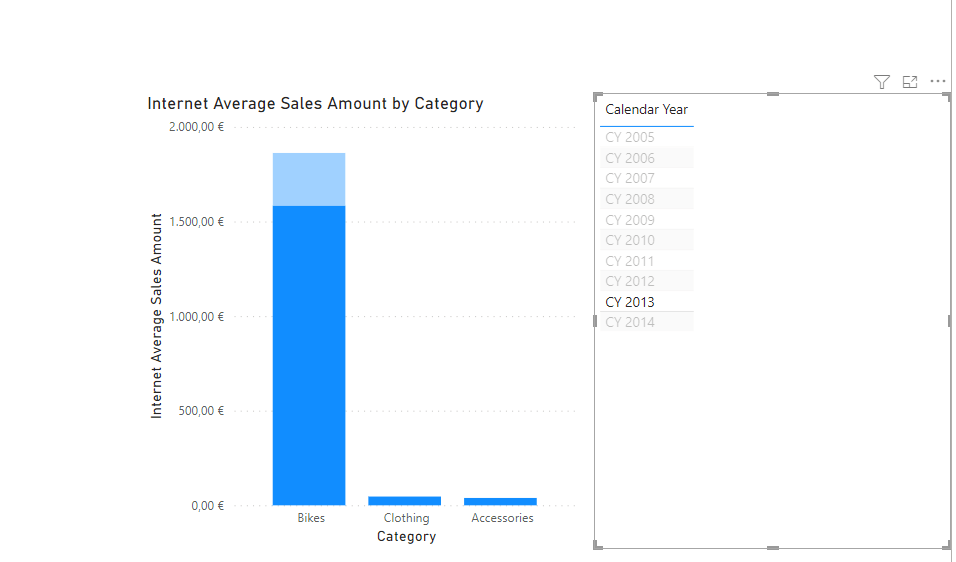
Finally, you can add filters to the report to check the data.
Map Visuals
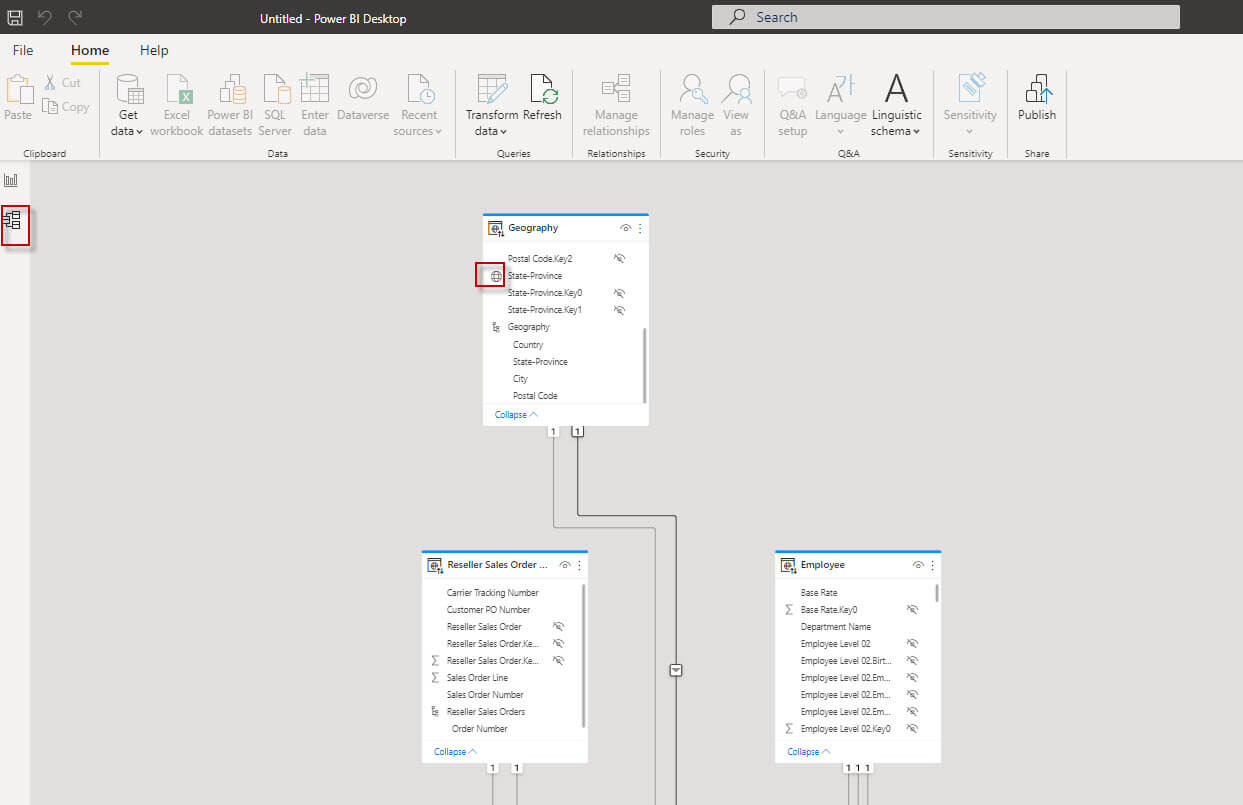
In the model, you can check the relationships between tables. Note that there is a sphere icon which means that you can use the information in maps.
The geography table has relationships with the reseller order and reseller sales tables. In this example, we will work with the reseller orders.
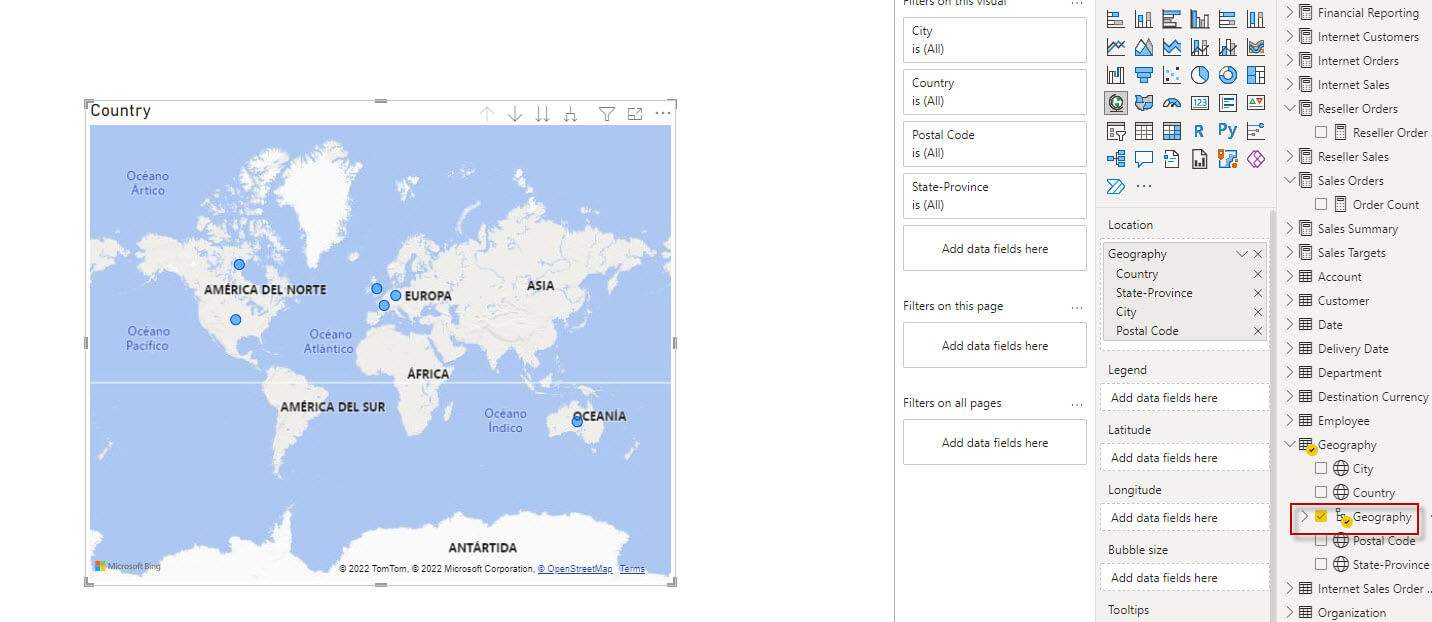
First, check the geography of the fields. Note that the Map visual is created by default. We can see some branches in Canada, the USA, Europe, and Australia.
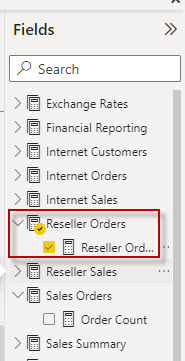
Secondly, include Reseller Orders in the map.
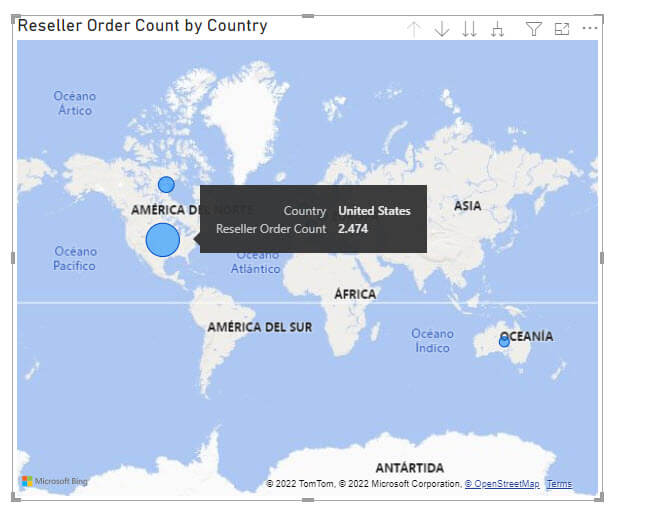
Thirdly you can graphically watch the reseller orders. Note that in the USA, we have a bigger blue circle while in Australia is smaller.
Conclusion
In this article, we learned how to configure the Adventureworks SSAS Multidimensional project, and then we learned how to connect to it using Power BI Desktop. We created some simple reports and then we worked with some maps using the data.