

Introduction
The current article will show how to create a Power BI report using PostgreSQL data.
This article is for people who need to work with PostgreSQL to create reports in Power BI, but do not have experience in PostgreSQL. If you do not have Power BI experience, you can still follow this step-by-step tutorial. The article will cover the following topics:
- Requirements to create a Power BI report using PostgreSQL
- PostgreSQL Installation
- Create a table with data in PostgreSQL
- Create a Power BI report using PostgreSQL
Let’s start the installation.
Requirements to create a Power BI report using PostgreSQL
- First, download the PostgreSQL installer. In this tutorial, we will work with the Windows installer.
- Secondly, make sure to install the Power BI Desktop version.
PostgreSQL Installation
First, run the setup and press next.

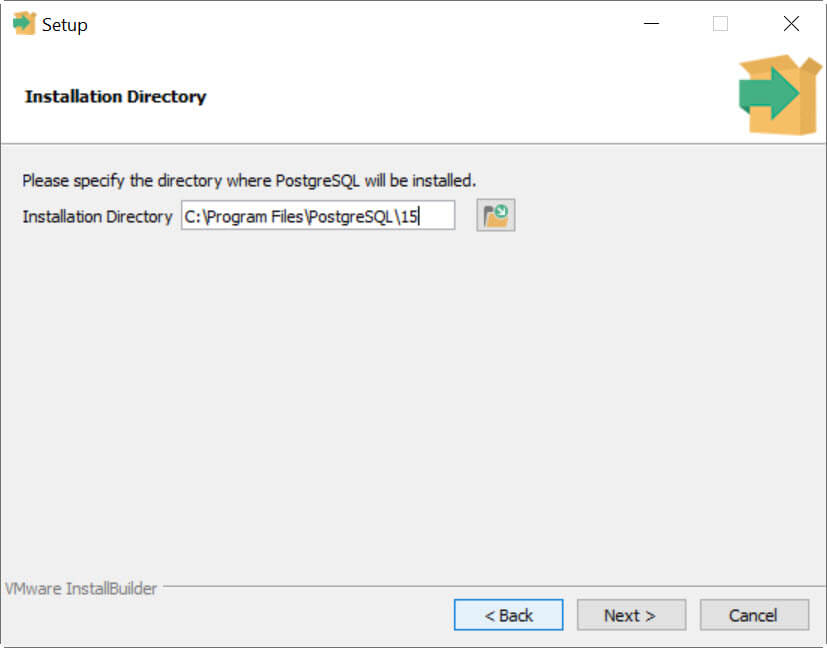
Secondly, select the installation directory and press Next.
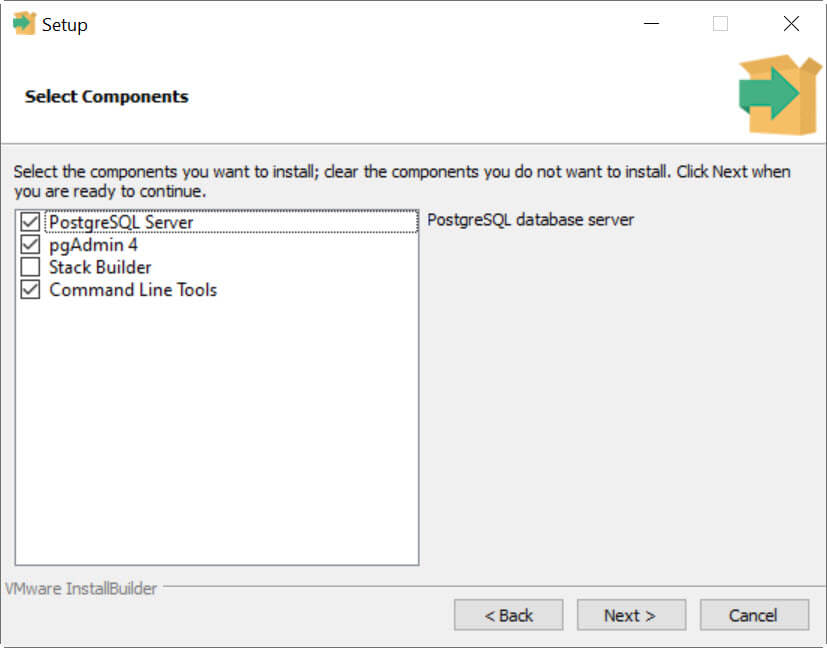
Thirdly, select the components to install. Select the PostgreSQL Server, the pgAmdin 4, and the command line tools. You could select the Stack builder, but we are not going to use it in this tutorial. The Stack Builder is an intuitive interface used to download and install modules.
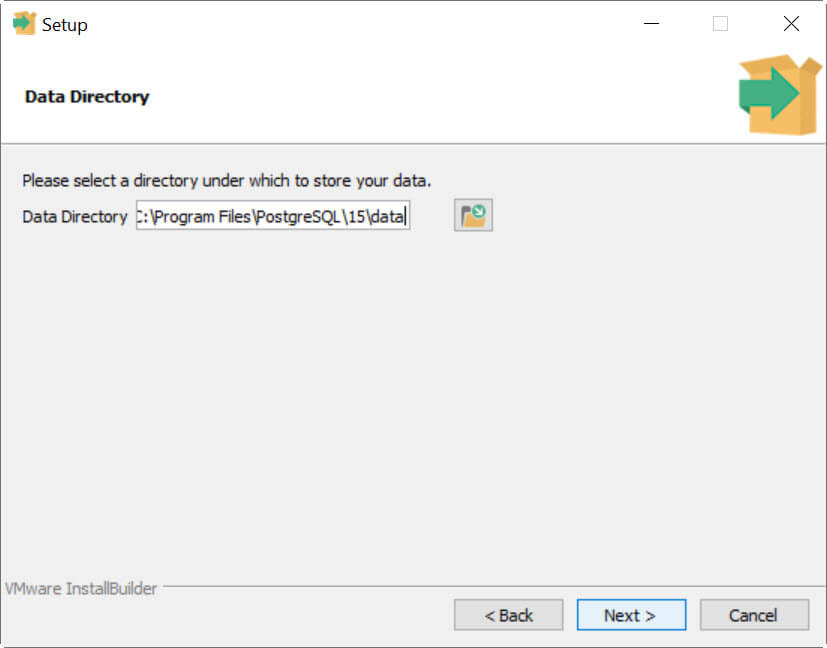
Also, we have the data directory which is the path where the databases will be stored. Select the directory of your preference.
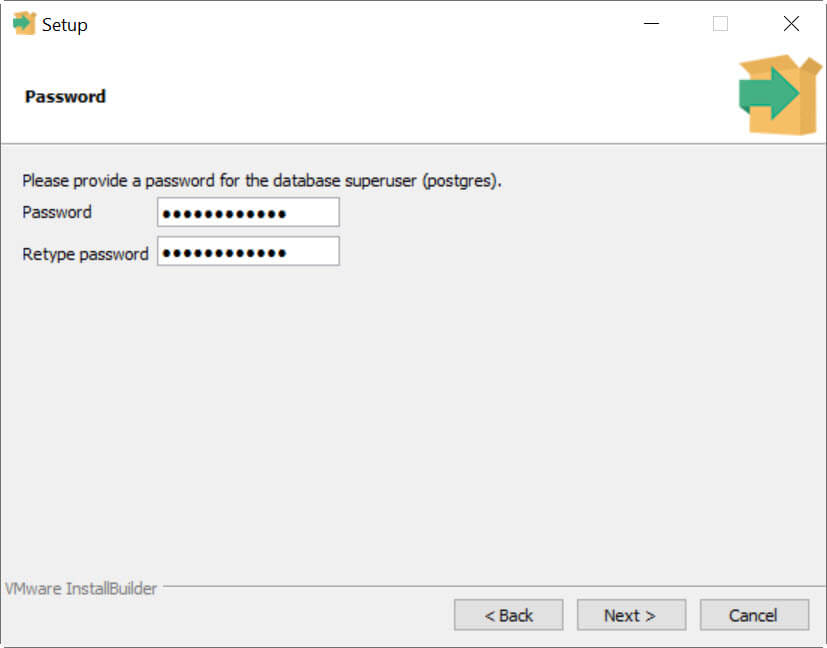
In addition, the software will ask for a password. Please do not forget your password. The superuser's name is postgres.
Next, write the port for your database server and press Next.

Also, you need to define the locale used by the new database cluster. Select the locale and press Next.

If everything is OK, you will see a Pre-Installation Summary, press Next.

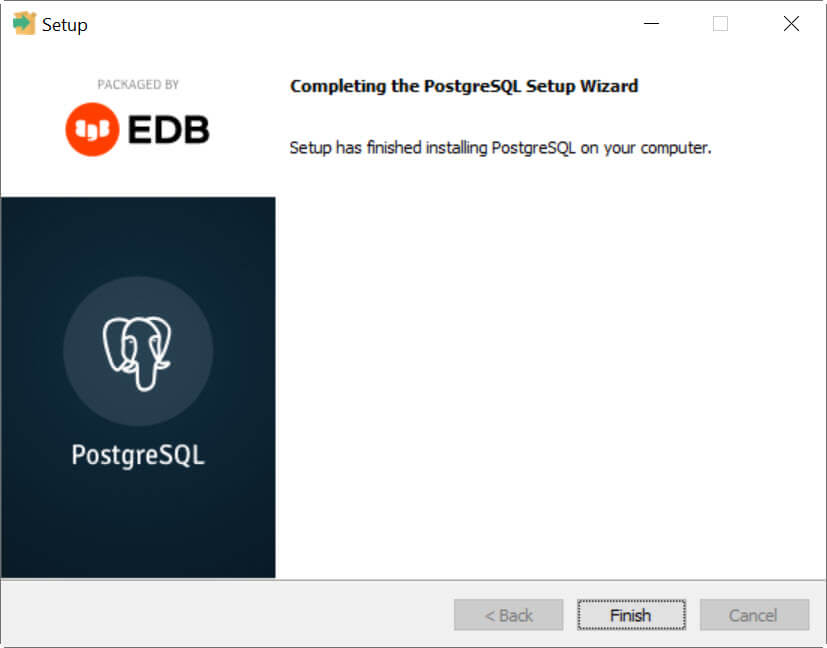
Finally, you will competition message to Finish the setup. Press the Finish button.
Create a table with data in PostgreSQL
First, in the Windows menu, go to PostgreSQL and select pgAdmin. For SQL Server users, let’s say that the pgAdmin is like the SSMS for PostgreSQL.

Secondly, write the Postgres user password. This password was configured during the PostgreSQL installation.

Thirdly, check your database. The database name by default is postgres. You could also go to Schemas and Tables and create your tables using the UI.

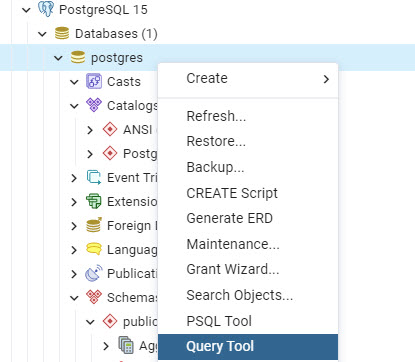
However, I am not going to use the UI, to simplify the tutorial I will use the Query Tool to create tables and insert the data using SQL. To do that right-click the database, and select Query Tool.
You can write the create sentence to create a table and you also have the button to execute the query.
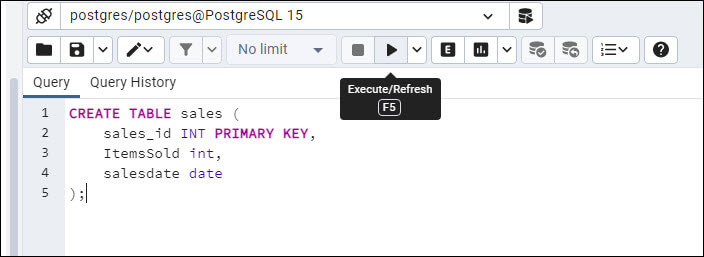
Create a sales table and insert 3 rows using the following T-SQL sentences and execute them.
CREATE TABLE sales (
sales_id INT PRIMARY KEY,
ItemsSold int,
salesdate date
);

INSERT INTO sales (sales_id,ItemsSold,salesdate)
VALUES(1,3,'2020-01-12');

INSERT INTO sales (sales_id,ItemsSold,salesdate)
VALUES(2,5,'2021-02-22');

INSERT INTO sales (sales_id,ItemsSold,salesdate)
VALUES(3,7,'2021-03-03');
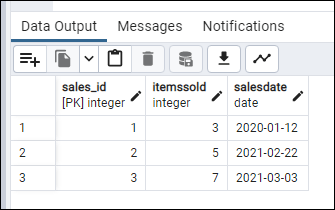
If you use the select sentence, you will see the following data.
select * from sales;
Finally, we are ready to go to Power BI.
Create a Power BI report using PostgreSQL
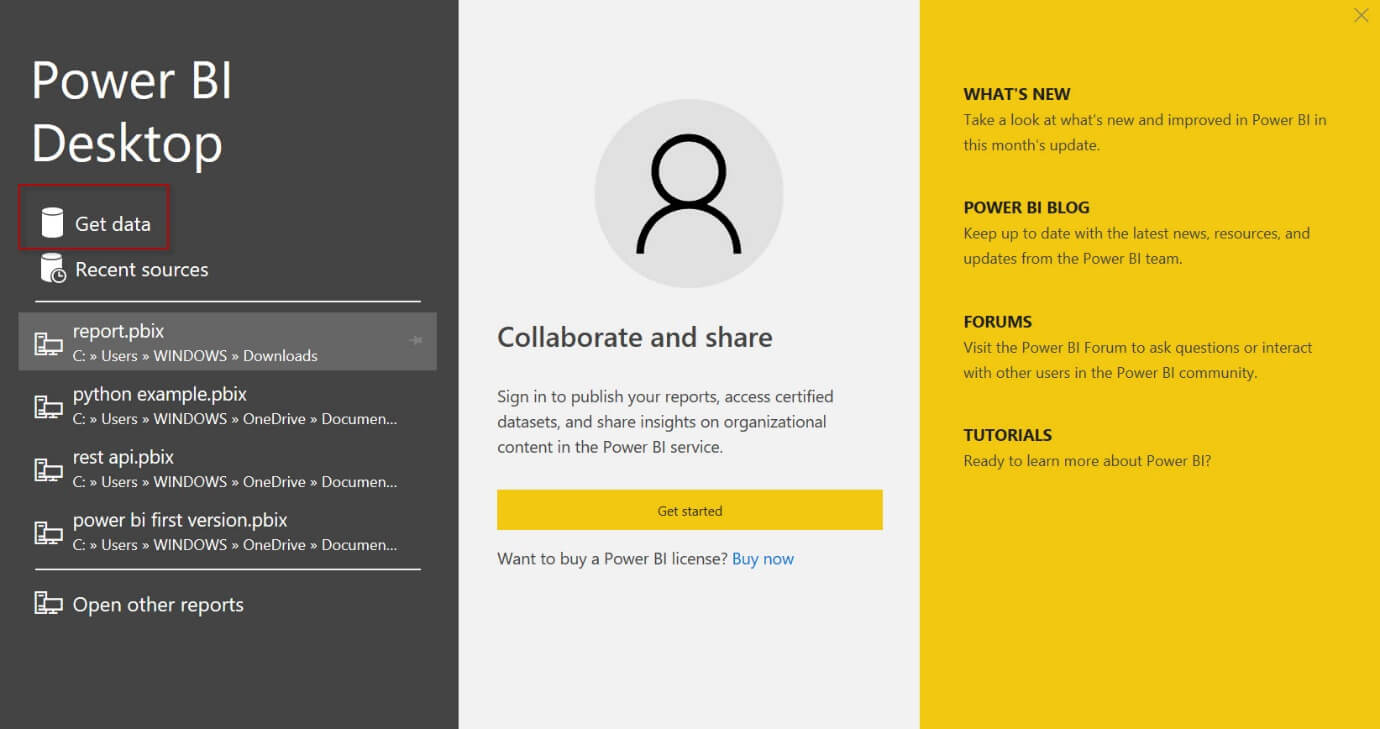
First, open Power BI Desktop and select Get data.
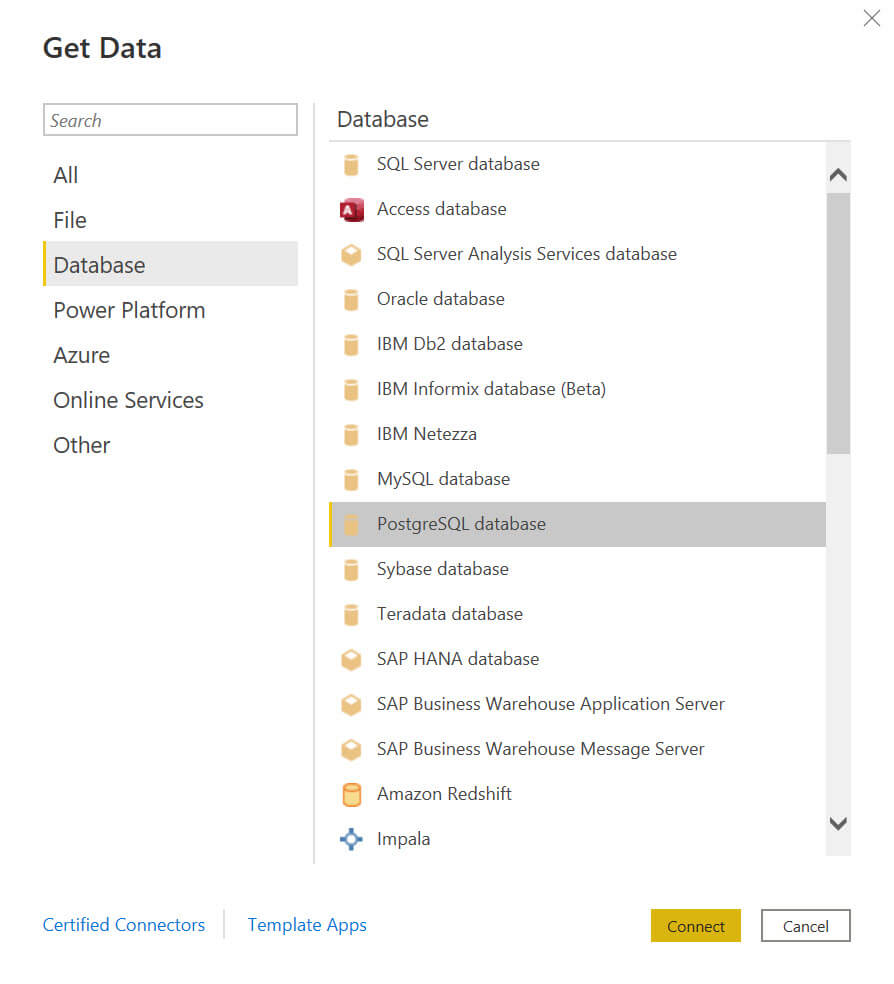
Secondly, go to Database and select PostgreSQL Database, and press Connect.
In this example, we will connect to the same server, so the Server name is the localhost. The database name is postgres. Press OK.

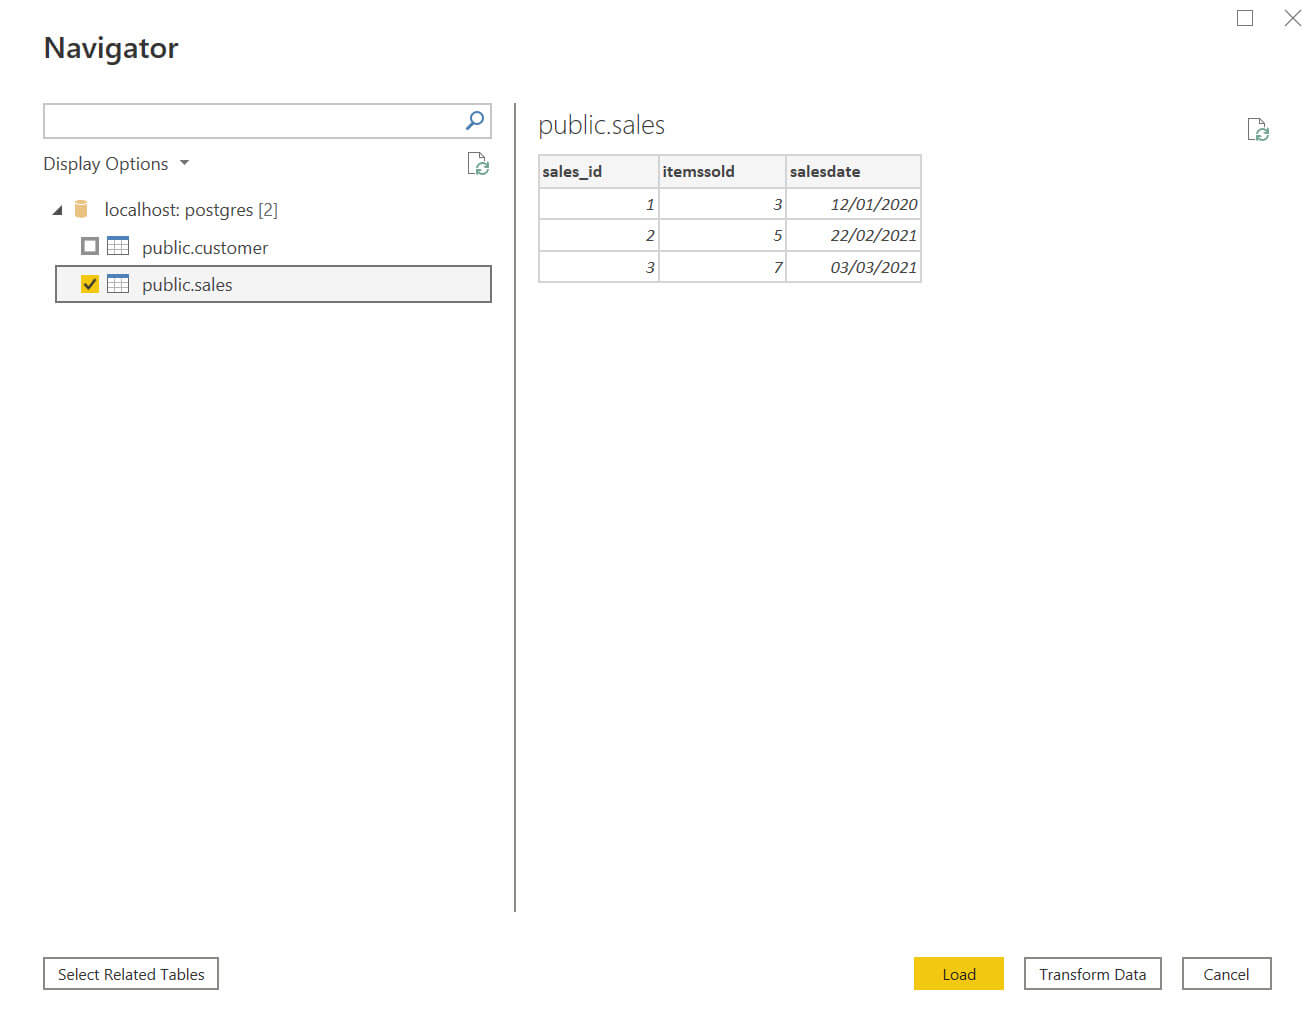
Also, select the sales table previously created using SQL and press Load.
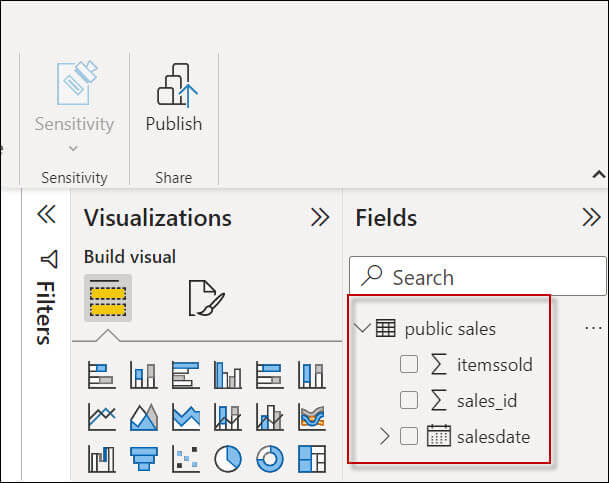
After loading the data, you will be able to see the PostgreSQL Fields in Power BI.
Next, select the Pie Chart visual.

Drag and drop the itemsSold and the salesdate to the pie chart.
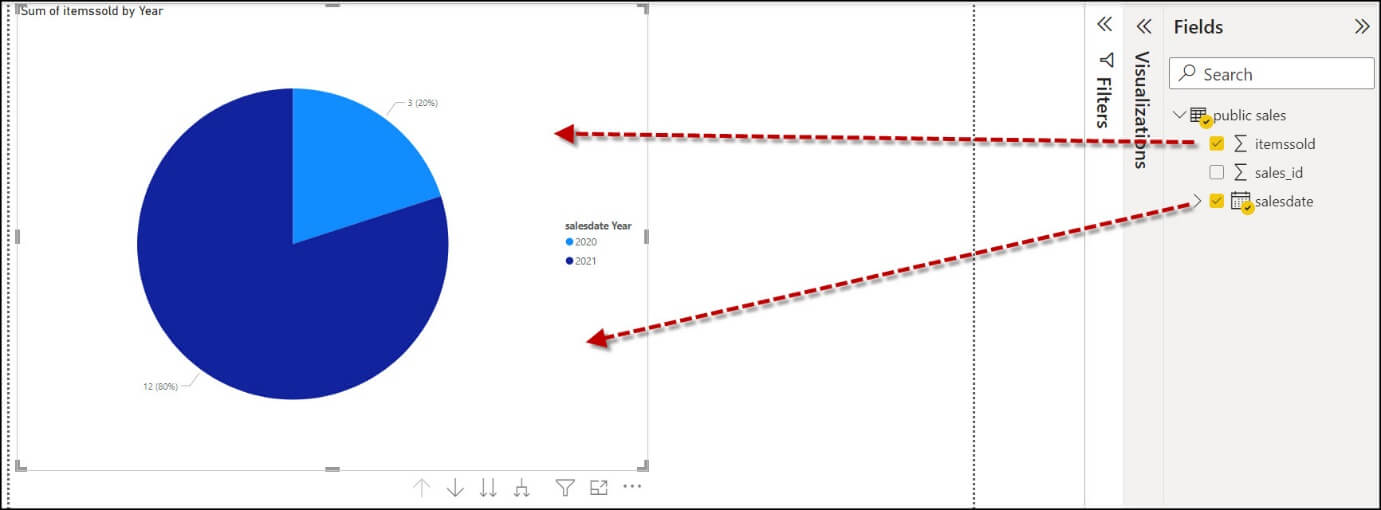
Also, we will include a Card in the report.

Drag and drop the ItemsSold to the Card.

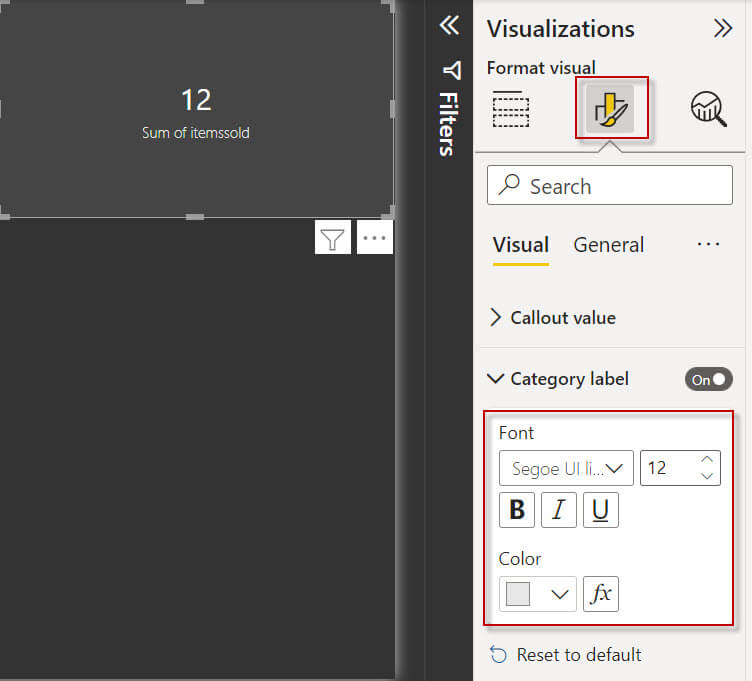
In order to modify the format, select the card and select the Format your Visual option. You can change the fonts size and colors there. Change the Category level.
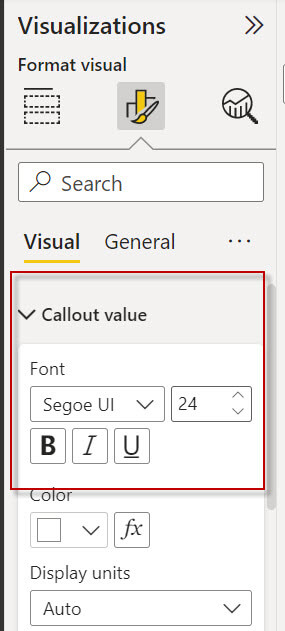
Change the Callout value colors as well.
Finally, go to View in the menu and select a theme from the gallery.
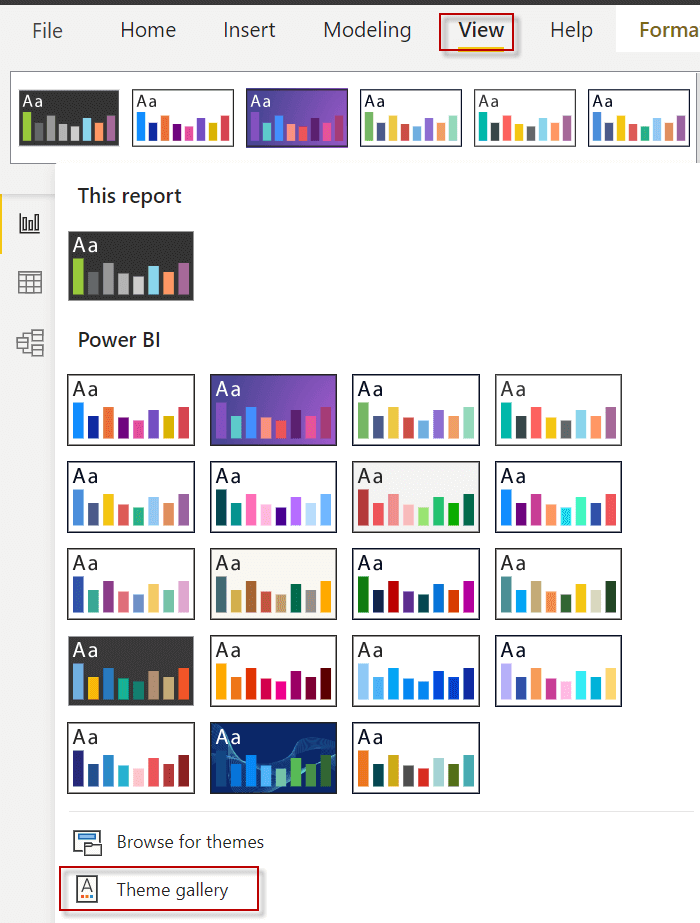
Finally, you will have your report in Power BI.

Conclusion
Power BI allows connecting to several databases and non-relational sources. In this example, we learned how to connect to a local database in PostgreSQL.