

Power BI Report Builder is a great tool to generate paginated reports. In a previous article, we mentioned that Power BI was an excellent tool to visualize data, but it is not the best tool to print reports and export the information to different formats like PDF, Word, etc. Also, Power BI is not the best tool for paginated reports.
That is why Microsoft created the Power BI Report Builder. If you are familiar with the Report Builder, the Power BI Report Builder will be familiar to you. Otherwise, this article will introduce you to creating your first report from scratch.
Requirements
- First of all, you will need SQL Server installed.
- Finally, the Adventureworks database installed.
Download and install the Power BI Report Builder
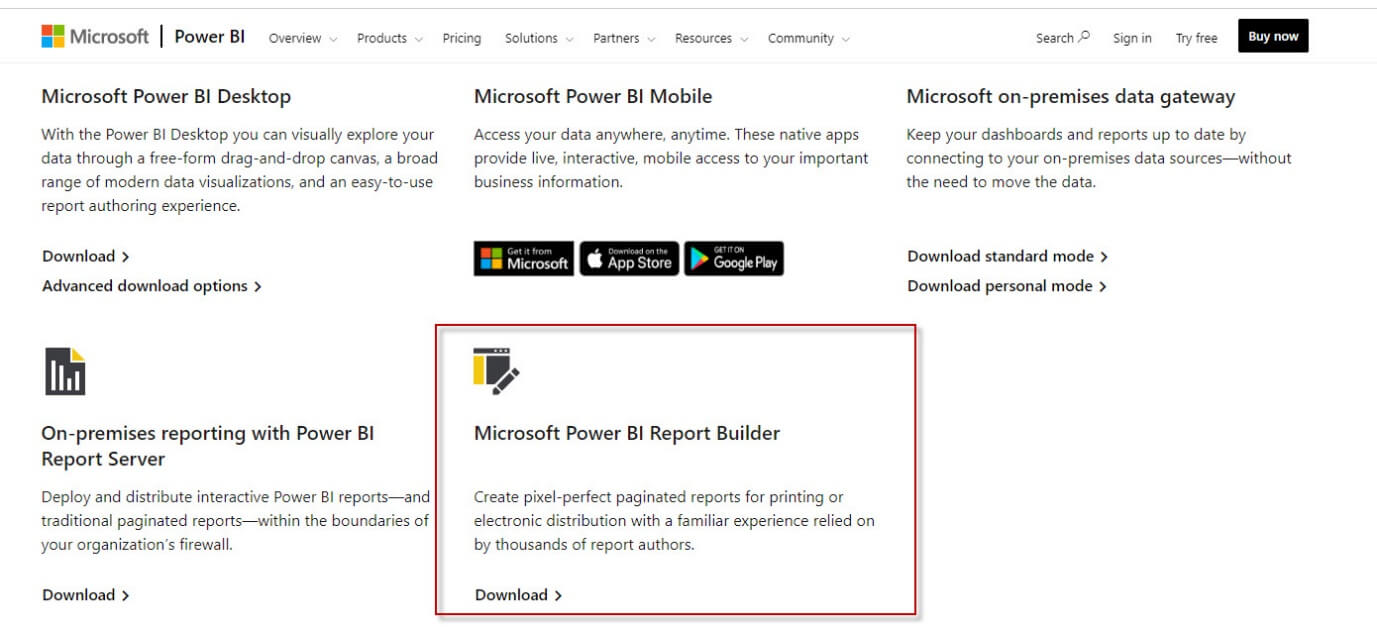
First of all, we will first download the Power BI Report Builder from this URL: https://powerbi.microsoft.com/en-us/downloads/
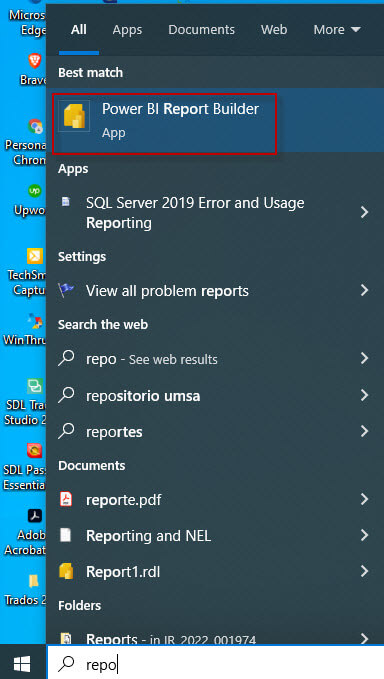
Once downloaded, install the software. Once that is done, open the Microsoft Power BI Report Builder.
Create the Data Source
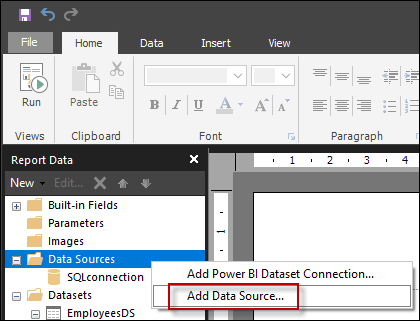
First, we will need to connect to a Source. It can be Teradata, SQL Server, Azure SQL, Oracle or other sources. In this example, we will connect to SQL Server. In order to create a new Report in the Report Data, right-click Data Sources and select Add Data Source.
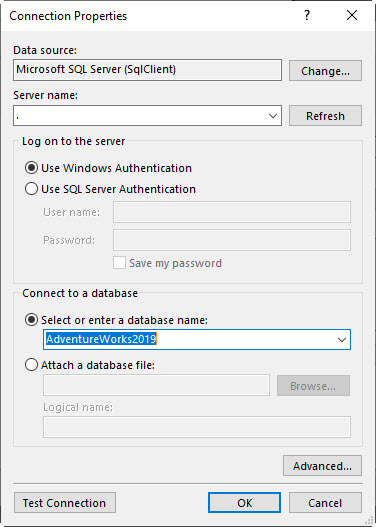
Next, write a name for the connection and press the Build button.
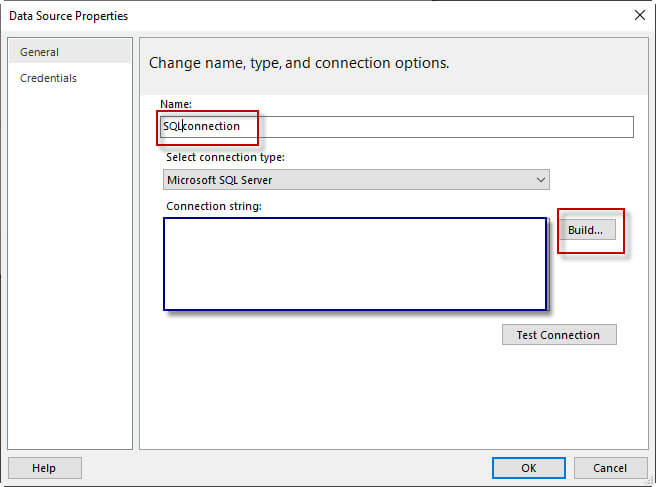
Here we enter the connection details. Select Microsoft SQL Server and enter the SQL Server name. The period means to use the local server. We are connection with the current Windows Account (Use Windows Authentication), and we will connect to the Adventureworks2019 database mentioned in the requirements.
Datasets in Power BI Report Builder
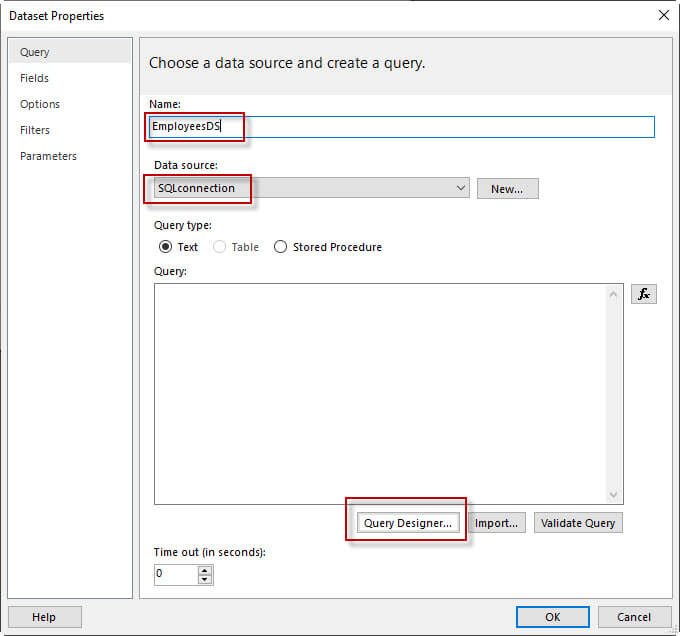
The dataset contains the data. It will use the data source created previously and it can use a query, a view, or a stored procedure to populate the data.
First, add the name of the dataset and then select the Data Source previously created. In the query, you can write the SQL query directly. You could for example create the query in SSMS and copy paste there or you can press the Query Designer button to generate your query. Try this option.
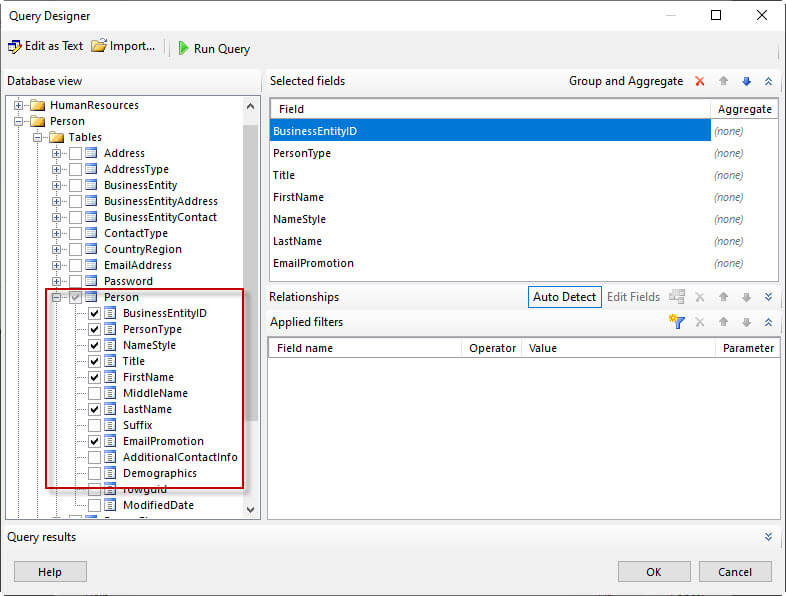
Check the person table and check some columns, like the BusinessEntityID, PersonType, NameStyle, Title, FirstName, Lastname, and EmailPromotion. You can add filters (where clause) and aggregations (SUM, COUNT, AVG, etc.) here. Then press OK.
Thirdly verify the T-SQL Query generated and press OK.
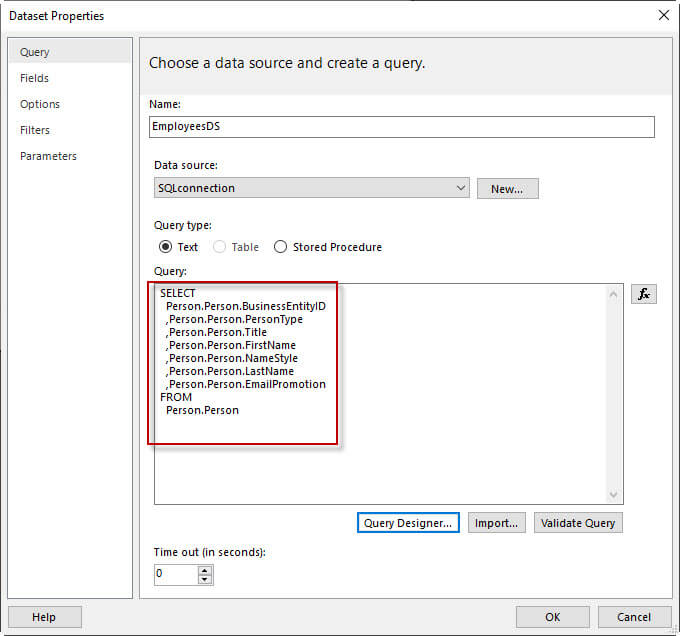
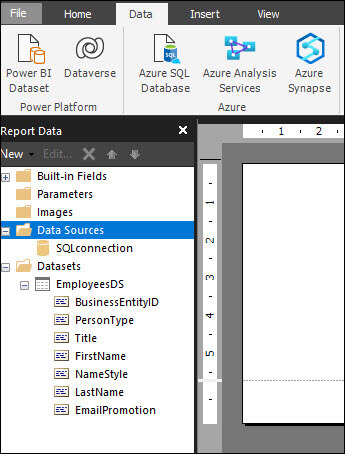
Finally, in the Report Data pane, you will see the Datasets with the dataset and columns selected previously.
Creating the Power BI Report
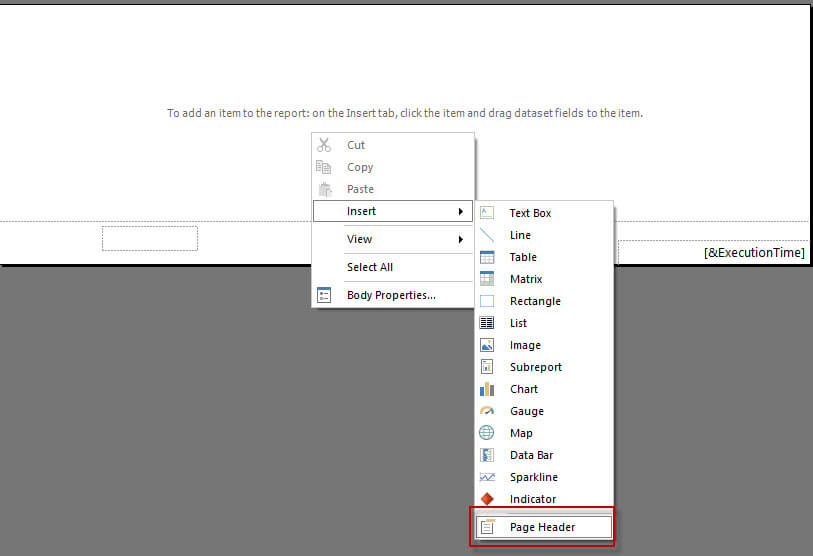
First, we will add a page header. In the report, right-click and select Page Header.
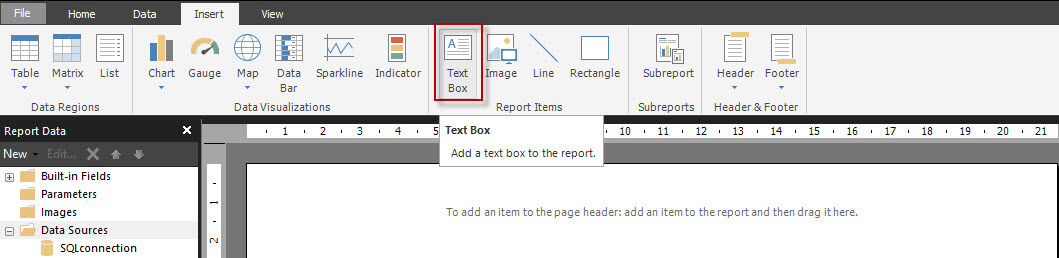
Secondly, in the menu go to Insert>Text Box to insert a text box in the header.
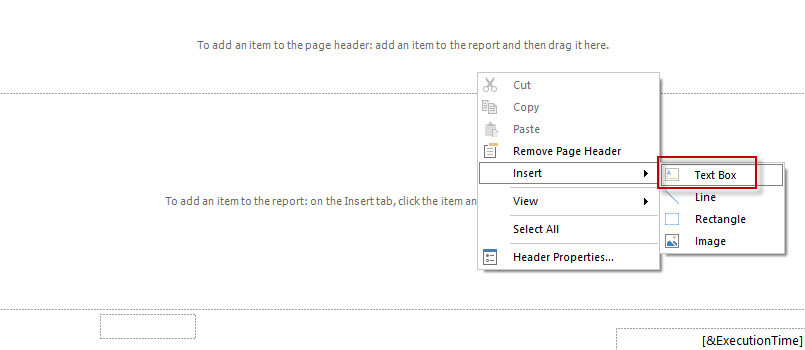
Optionally, you can right-click and select Insert>Text box
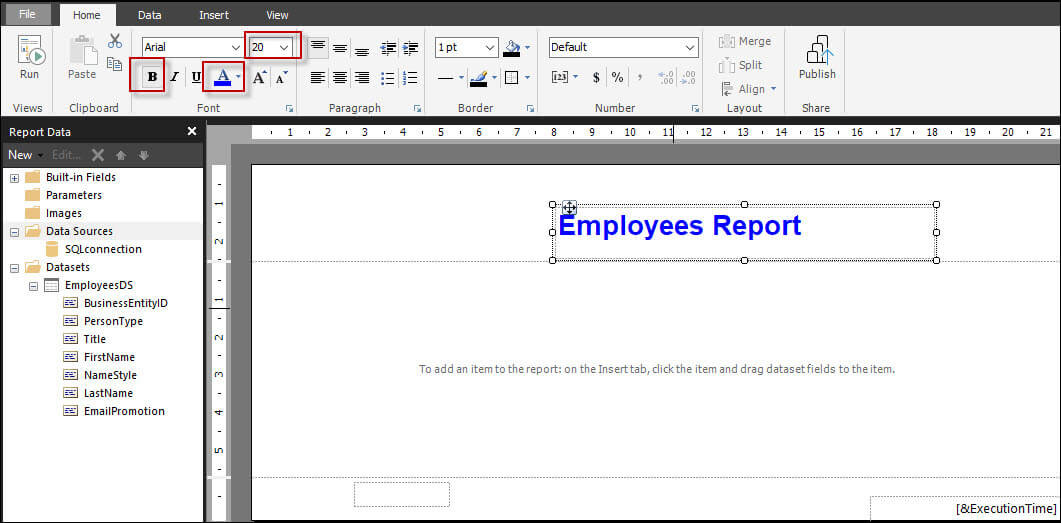
 Insert a text box using Power BI
Also, add the text box and write a title for the report. In the Menu go to the Home tab. Then select the buttons to bold the title in the text box and change the color and font size. As you can see, changing the format is like using MS Word.
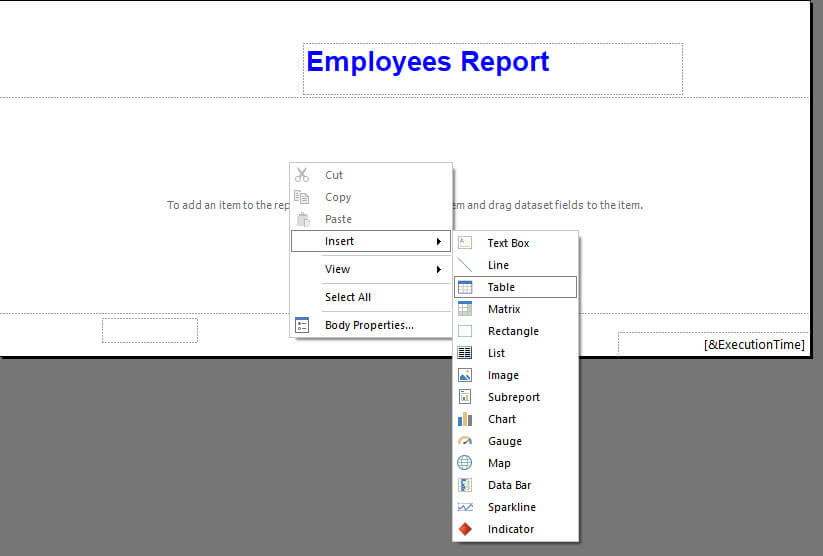
In addition, on the Report right-click and select Table.
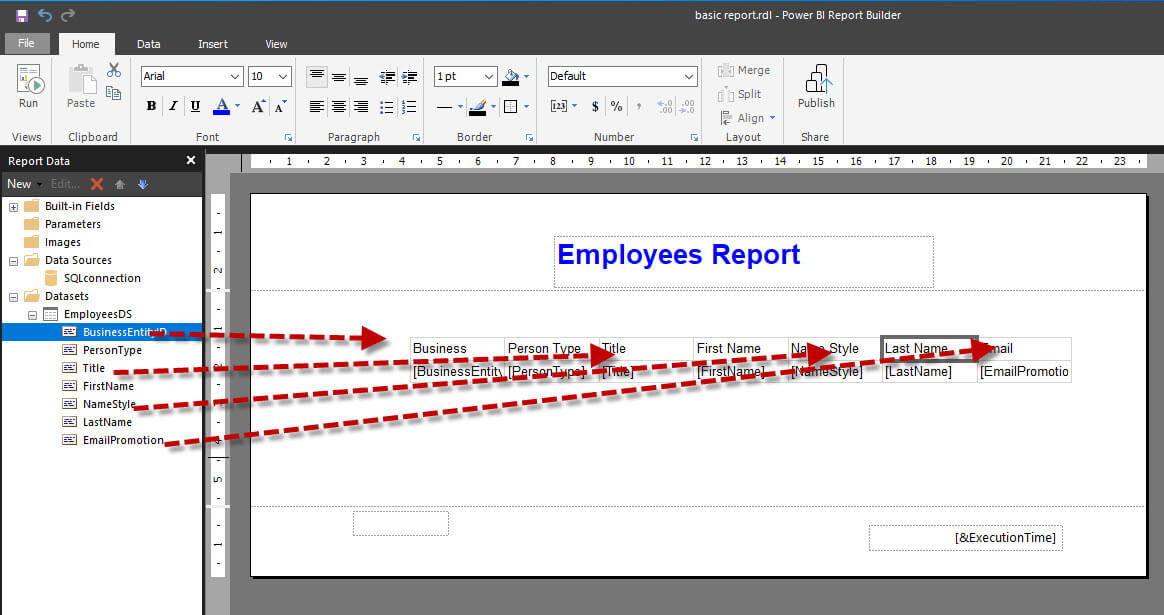
In order to generate the report, drag and drop the columns from the dataset into the table.
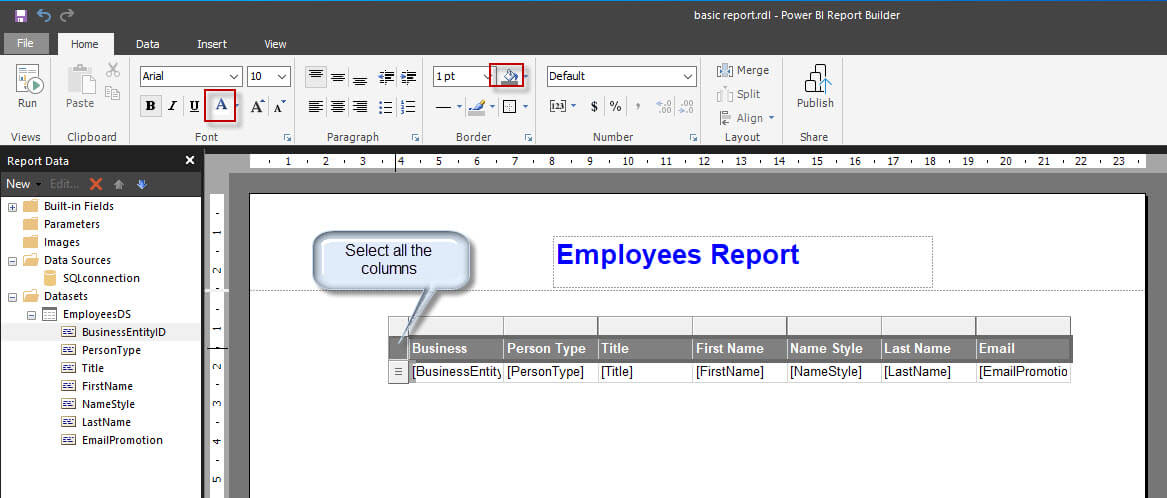
At the left of the table column headers, you can select that section to select the entire row and change the column color. In this example, we are changing the color to dark gray and changing the font color to white. Note that all the column header properties are changed.
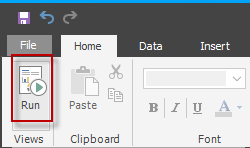
Finally in Home, you have the Run option to run the report and see it.
Also, you can print the report or you can export the report to PDF, Excel, Word, PowerPoint, MHTML, CSV, XML.

Conclusion
To conclude, we can say that Power BI Desktop is a good visualization software, but it is not the best tool to generate printable reports, and export reports to different formats.
Also, it is not the best tool to generate paginated reports. In order to fill those requirements, Microsoft created the Power BI Report Builder which is a friendly tool with some Ribbons similar to the familiar MS Office tools to generate paginated resources.