
Time Intelligence is a common methodology in Dimensional Modeling that allows for calculations of measures based on relative dates. These include “To-Date” measures like Year to Date or Quarter to Date as well as Previous Period comparisons. Once these are created within a model, other DAX functions can be used for metrics like Year over Year (YoY) growth and YoY change including percentages. A Key Performance Indicator (KPI) can be used for percentage gain or loss on YoY ratios. These calculated measures help businesspeople see metrics as a summarization rather than row by row report type results. Using a report tool like Excel or PowerBI can enhance the results making them easier on the eyes.
Date Table
Before starting with Time Intelligence, this is a reminder that there must be a table designated as the Date table in order to use Time Intelligence in Analysis Services. The previous article on the Date Dimension can get a project up to speed for the configuration of the date table. Figure 1 shows this project’s Data table. If you have followed the series to this point, the project will be the same.
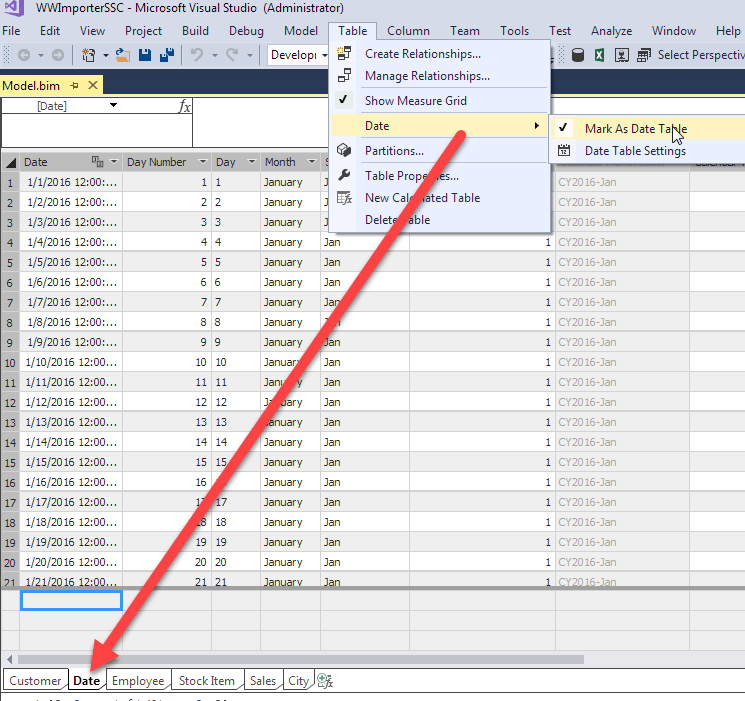
Figure 1 Date Table
Year (YTD) and Quarter to Date (QTD)
The first Time Intelligence functions demonstrated will be Year to Date and Quarter to Date. Figure 2 shows an example of using these DAX functions on the Total Sales created. The Date Dimension is already configured for Time Intelligence and a hierarchy with Year-Quarter-Month-Day (Y-Q-M-D) has been created. This example (Figure 2) is an Excel pivot table is connected to the Analysis Services analytical database.
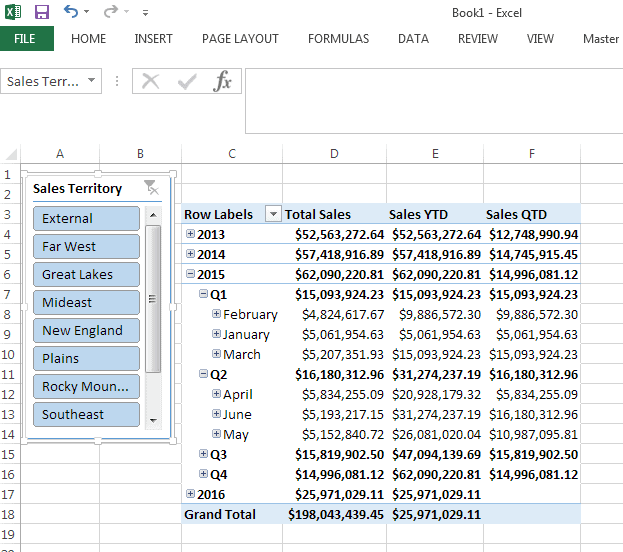
Figure 2 Sales YTD and QTD
The rows in Figure 2 are using the Y-Q-M-D hierarchy with the measures as columns, created in the previous article. There is a separate measure for Total Sales versus Sales YTD versus Sales QTD. In this example, the fact for Sales has an Order Date related to the Date Dimension table by a surrogate key. This relationship enables the DAX function to use the Time Intelligence configuration from the Data dimension.
You can see in Figure 2 the Sales YTD value continues to accumulate with the row at Q2 in 2015. But, the Sales QTD measure resets once the new Quarter, Q2, starts in a preceding row. The same can be done for the month within each quarter with the DATESMTD DAX function.
Figure 3 shows the measures created in a Tabular Model project. This is the first use of the CACLULATE DAX function. CALCULATE is necessary for using measures with a previous calculation (SUM, COUNT, etc. or computations like ListPrice * Quantity) to be used in the Time Intelligence functions. Be sure to format each as Currency.
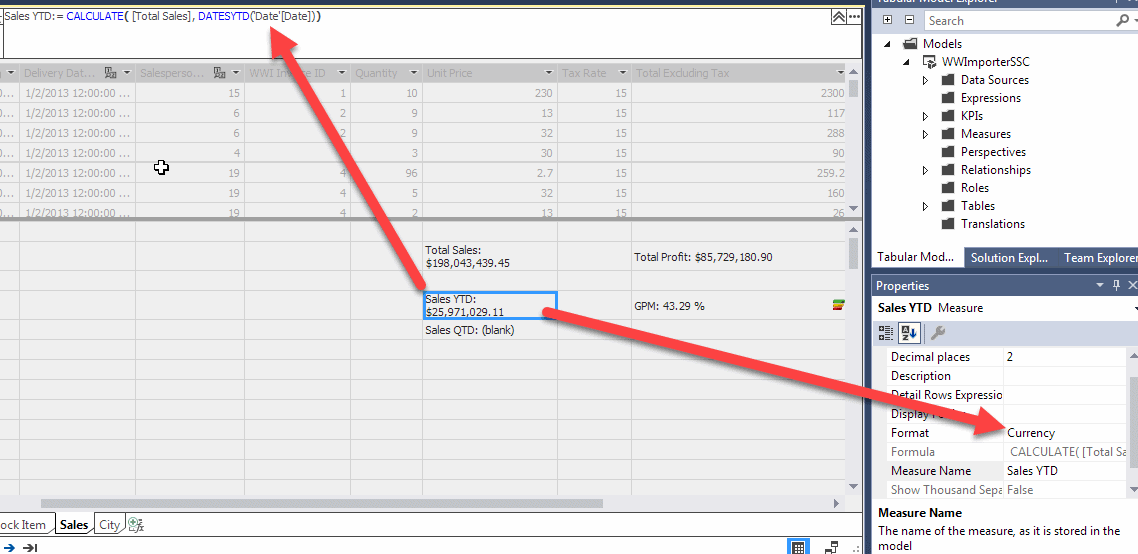
Figure 3 YTD and QTD in Tabular Model
The measure Sales YTD is determined using the measure Total Sales plus the DATESYTD DAX function as shown below.
Sales YTD := CALCULATE( [Total Sales], DATESYTD( 'Date'[Date] ) )
Quarter date is the same except DATESYTD is replaced with DATESQTD.
Sales QTD := CALCULATE( [Total Sales], DATESQTD( 'Date'[Date] ) )
Since the measure uses another calculated measure, the measure is placed in the CALCULATE DAX function before applying the Time Intelligence function DATESYTD. Inside the DATESYTD function the Date data type column from the Date dimension provides the guidance the DAX language requires. Be sure to save the project before viewing in Excel.
Previous Period
The next Time Intelligence function will be looking to calculate from a previous period. There are a multitude of ways to do this with DAX functions SAMEPERIODLASTYEAR, PREVIOUSYEAR, PREVIOUSMONTH or DATESBETWEEN. This example will use SAMEPERIODLASTYEAR. The measure analyzed will be Total Sales.
The new measures (Figure 4) show the previous period of Total Sales. Sales Same Period LY (Last Year) and Sales Growth % give the reporting some nice metrics to display. Sales Growth % uses another measure called Sales Growth which is the difference between the current Totals Sales and Sales Same Period LY.
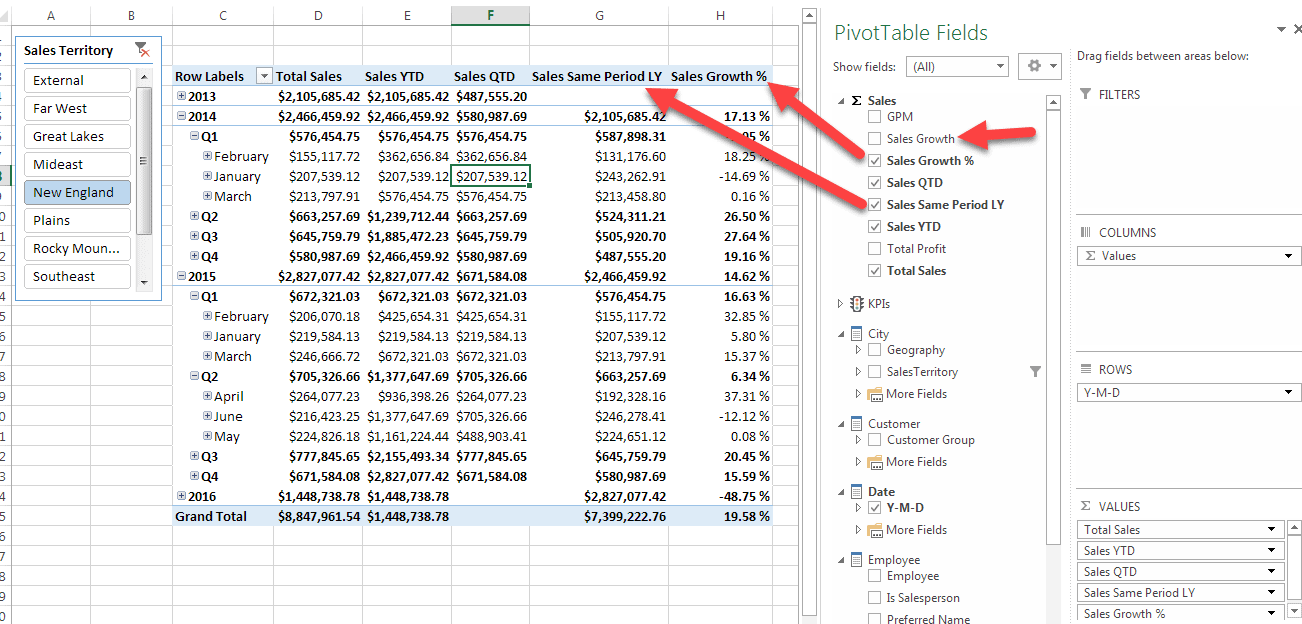
Figure 4 Sales growth and percent growth
The project looks like Figure 5. Make sure to properly format the measure. Sales Same Period LY is set to Currency but Sales Growth % is set to Percentage.
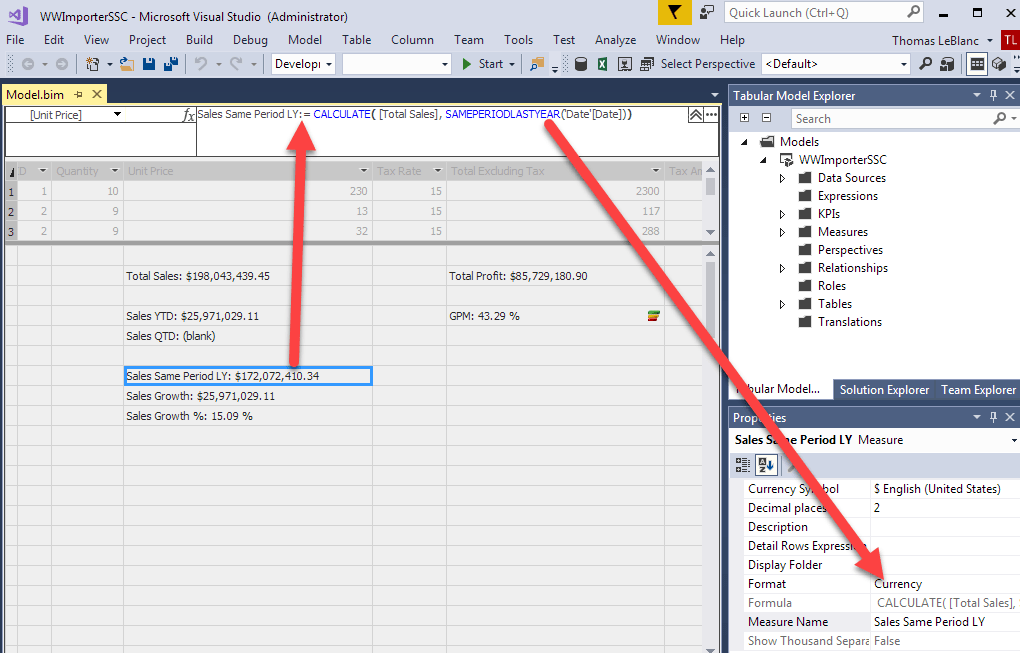
Figure 5 Sales Same Period LY
The measure Sales Same Period LY uses the CALCULATE DAX function with Total Sales as the measure and the DAX function SAMEPERIODLASTYEAR. The Date parameter is used in this measure as well as other Time Intelligence functions. This is a pattern to remember.
Sales Same Period LY:= CALCULATE( [Total Sales], SAMEPERIODLASTYEAR('Date'[Date]))
Basic subtraction and division are used for the measures Sales Growth and Sales Growth The DIVIDE DAX function is used to handle divide by zero problems which can happen with using “[Sales Growth] / [Sales Same Period LY]”. This type of calculation can return an error unless the error is trapped with ISERROR() DAX function.
Sales Growth:= [Total Sales] - [Sales Same Period LY]
Sales Growth = DIVIDE( [Sales Growth] , [Sales Same Period LY])
The fun part is creating a KPI (Figure 6) to visualize the percent change in real data. Right clicking the measure and selecting Create KPI… is the next step.
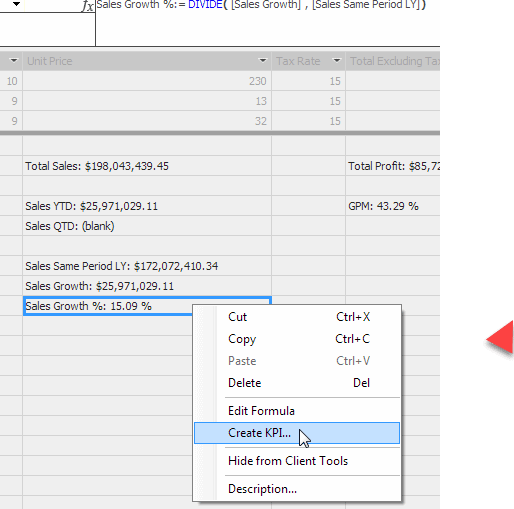
Figure 7 Create KPI… on Sales Growth
First, Target is changed to Absolute value: and 0.10 (10 is used. The range will be entered in the Create KPI dialog screen (Figure 8). The lower (red indicator) will be 0.06 and the upper (green indicator) is 0.14. This means anything above 14 s green (good), between 14nd 6s yellow (ok) and below 6s red (bad). The KPI can have 5 rather than 3 comparison values with various icons as indicators if desired.
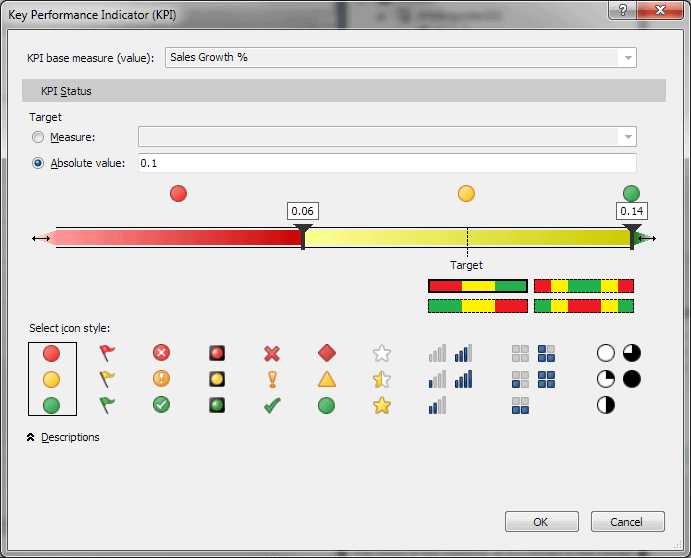
Figure 7 Edit KPI for Sales Growth YoY Percentage
These Time Intelligence and additional measures are more apparent once they are displayed in a report tool like Excel. An Excel pivot table (Figure 8) can show the indicators which direct a report viewer to the areas he/she wants to drill down for more details. Drilling into the red might find a problem and drilling into green might indicate an award.
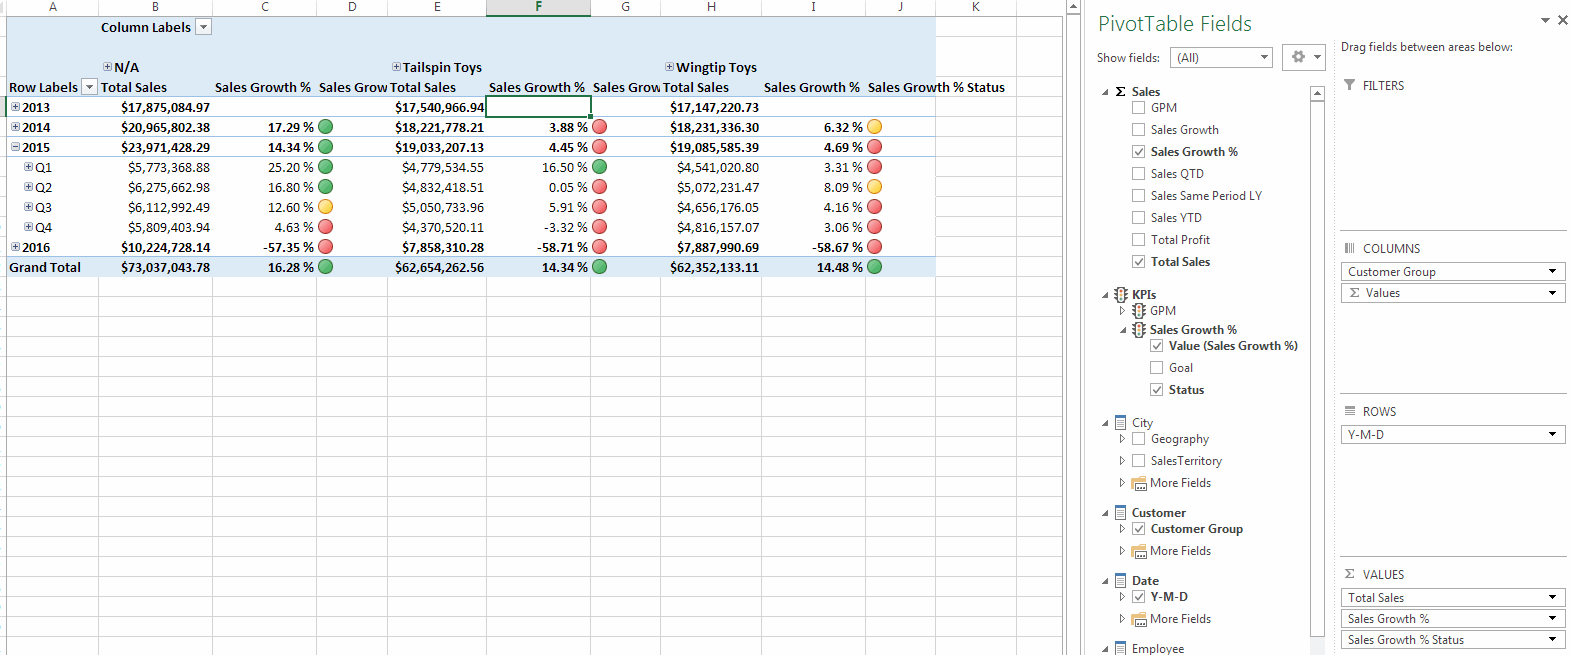
Figure 8 Customer Group Sales Growth YoY
Summary
Time Intelligence has always been a highly used feature in analytical database reporting. Microsoft did a nice job porting it to the Tabular Model from Multidimensional Cubes. The simplicity of the Time Intelligence DAX functions is dependent on the Date table being marked and a date data type available in the table. This is another reason why Dimensional Modeling is so important to using Analysis Services or any other analytical database formulating tool. Some might call it a Star Schema. Once this is set up for the Date table, the same functions can be used for other Fact tables with a Date key related to this dimension.
