
Once dimensions are added to a model, some cleanup and configuration is required. The date dimension has some unique characteristics. The Tabular Model and the Data Analysis Expression (DAX) language can use the structure of a date dimension to seamlessly compute Time Intelligence measures like Year-to-Date or Same Period Last Year comparisons. This is indispensable for analytical reporting. The slicing and dicing by Year, Quarter or Month can enable a matrix table to list rows by one attribute (year) and columns by another (month). There is also the case of showing a date with no measure value without any special logic.
The steps in this article are:
- Examine the Date Options
- Mark as Date Table action
- Understanding the Relationship(s) with Sales
- Y-Q-M-D Hierarchy
- Cleaning Up the Dimension
Date Dimension
All analytical databases have some sort of date dimension. Some data warehousing reports use built-in date functions to extract a year, month or quarter. This is essential for certain time analysis. With the latest versions of Analysis Service Tabular, the need for an actual table has been complimented with a CALENDAR table function. Developers still have to create the Year, Quarter, Month, etc. columns, but a physical date table is not required in a database. This example uses an existing date table in the database.
This date dimension needs to have contiguous and unique rows by date. Most data marts already have this dimension. The time is not included, but can be in a separate time dimension with each second and/or minute of a day. The maintenance on these dimension types involves keeping them populated with current days to match fact tables. Populating too far in advance can confuse end users of the data.
Table 1 shows the structure of the Dimension Date table in the Wide World Importers DW database.

Table 1 Dimension.Date table
The key column, Date, is a date data type. It is not a datetime data type. This is to match or relate to fact table date columns. Until recently, most date dimensions and fact tables had an int surrogate key as the related or foreign key column. This is no longer required for relationships with SSAS. This addition has simplified the date dimension and reduced the columns needed in a dimension model plus enables the fact table column to be a date data type.
Mark as Date Table
To follow along with this article, use the project you created in Level 3 of this Stairway. The Dimension Date table needs to be marked as a date table type. This enables SSAS to identify Time Intelligence for values in this table. By selecting the Table main menu (Figure 1), and then selecting the Date from the drop down menu, the Mark as Date Table submenu is available.
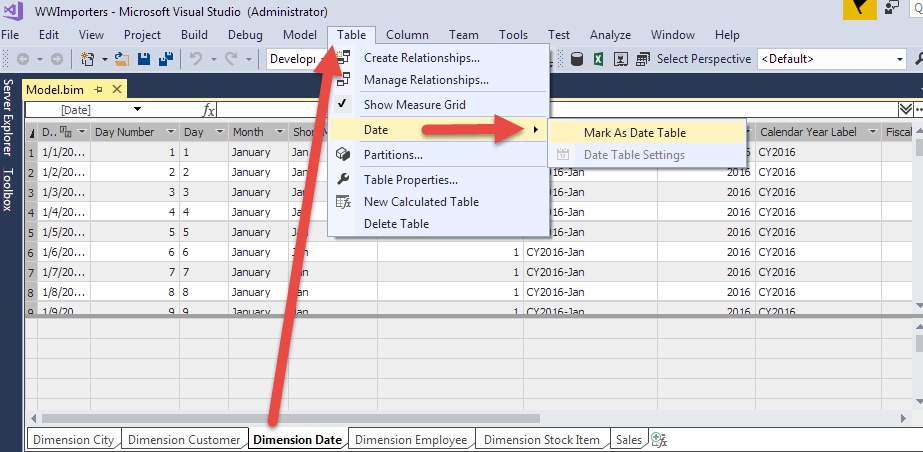
Figure 1 Mark as Date Table
In order for a table to be marked like this, there must be a column in the table as date data type that contains a unique and contiguous list of values. The Date column (Figure 2) contains the correct requirements in this example.

Figure 2 Date column for Mark as Date Table
Relationship with Sales
The Date column from table Dimension.Date has two foreign keys to fact table Fact.Sales. When there are more than one foreign key relationships between two tables, only one can be active. The Import Data wizard selected Invoice Date Key as the active relationship. The inactive relationship is with the Delivery Date Key. To see the relationships, switch from Grid view to Diagram view, select the Display icon (Figure 3) in the lower right of the work area.

Figure 3 Grid and Diagram View icons
Figure 4 shows the Diagram view of the Model. The Invoice Date Key relationship has a solid line while the Delivery Date Key relationship has a dotted line. This is how to visually identify the active versus inactive relationship.

Figure 4 Date Relationship with Fact table
These relationships were built because the tables had foreign keys. Relationships can be built manually if using views in the Import Data option or if the tables in the database do not have foreign keys defined. Figure 5 shows the relationships in SSMS.

Figure 5 Fact.Sales foreign keys to Dimension.Date
The active relationship can be changed by editing the existing relationships. The active one will have to be flagged as inactive before another relationship can become active. Figure 6 shows the Edit Relationship window. You can bring up this window by double-clicking on the relationship line.
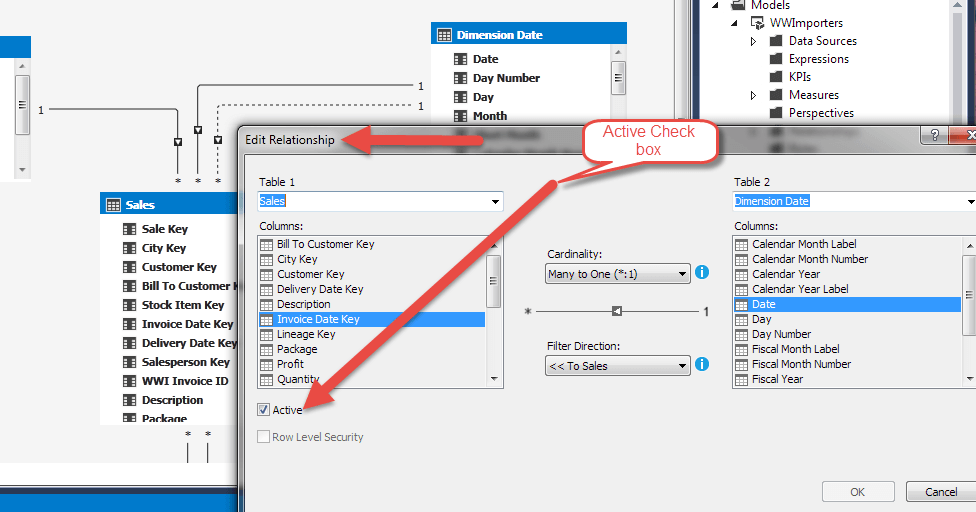
Figure 6 Edit Relationship
The second relationship on Delivery Date key can be used in DAX formulas. The DAX function USERRELATIONSHIP would have to be used in the measure to use a different relationship than the active relationship.
Date Hierarchy
A date hierarchy enables an end user to easily drill up or down date attributes like Year, Quarter, Month and Day. Before creating the Date hierarchy of Year, Quarter, Month and Day, we need a column for Quarter (Qtr). There are DAX functions for extracting the year and month from a date, but nothing for quarter. Below is the DAX formula used in this example for new column Qtr. The letter Q is concatenated (& character) with the value extracted from ‘Dimension Date’[Date] based on the function Month(). That value is divided by 3 and rounded up (ROUNDUP) to 0 decimal places.
= "Q" & ROUNDUP (Month ('Dimension Date'[Date]) / 3, 0)Code 1 DAX for Quarter computed column
This is a great example of a computed column in a Tabular Model. The new column will be calculated for each row in the Dimension Date table. The initial name will be Calculate Column 1 but it can be renamed by right-clicking the column heading and selecting Rename Column submenu (Figure 7).

Figure 7 Rename Qtr Calculated Column
The date hierarchy is created in this example as Year/Qtr/Month/Day. This would be considered a natural hierarchy since the values are a given - day 1/2/2018 is year 2018 in calendar quarter 1 and month January. An unnatural hierarchy might be Size and Color of a Product.
To create a hierarchy, right click on the Calendar Year column in the diagram view and select Create Hierarchy (Figure 8).
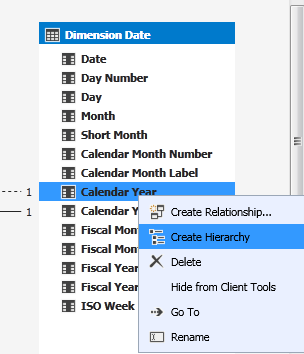
Figure 8 Create Date Hierarchy
The hierarchy will be named Y-Q-M-D. The calendar year will be used in this example and not the fiscal year. The Calendar Year in the hierarchy can be renamed (figure 9) to Year without affecting the actual column name in the table or display name for the attribute Calendar Year.
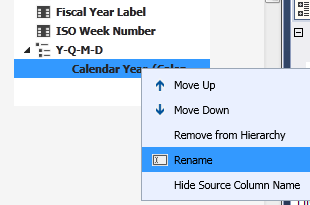
Figure 9 Rename Calendar Year in Hierarchy
Figure 10 shows how to add the month. Right click the column in the list and select Add to Hierarchy and select the Y-Q-M-D hierarchy. Repeat for the Qtr and Date columns.
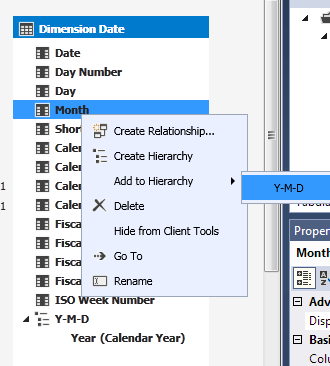
Figure 10 Add Month to Y-M-D hierarchy
Cleaning Up the Dimension
The first step to clean up the Dimension Date is to rename (Figure 10) the table to just Date. Since the active relationship of this dimension is on Invoice Date of Sales Fact, another option is to rename it Invoice Date.
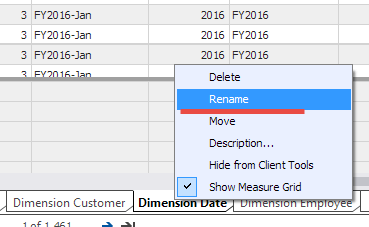
Figure 10 Rename Date Dimension
Hiding columns not needed in the reports can be accomplished by right clicking the column heading and selecting Hide from Client Tools in the submenu. Figure 11 shows hiding Day Number. Repeat for columns Calendar Month Number, Calendar Month Label, Calendar Year Label, Fiscal columns and ISO Week Number. Hidden columns can be used in DAX formulas
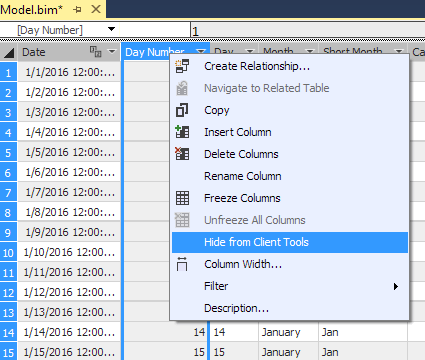
Figure 11 Hiding A Column from Client Tools
The last step is to sort the Month column by the Calendar Month Number. This changes the display from the alphabetic order (Jan, Feb, Mar…) to the month number order (1, 2, 3…). This is accomplished by first selecting the Month column and going to the properties window (Figure 12). Click in the Sort By Column property and click the drop down. Here, select the Calendar Month Number column.

Figure 12 Month column Properties (Sort By Column)
Summary
Configuring a dimension table in an Analysis Services Tabular Model pays dividends later for analytical reporting. Time Intelligence is needed for Year-to-Date measures and this is accomplished with the Mark As Date table option. Hierarchies will help for drilling of measures from Year to Quarter to Month to Day. Most reporting relies of the month being sorted by number but displayed by text description. Remember to always Process and/or deploy to development for further analysis with the Analyze in Excel option.