

Introduction
Power BI vs SSRS. Which one is better? That is the question.
SQL Server Reporting Services (SSRS) and Power BI are both reporting tools from Microsoft. SSRS comes with SQL Server. You can develop reports in Visual Studio using the SSRS extension. On the other hand, you can use Power BI in the desktop edition, in Azure, Power BI Server Report, Power BI Mobile, or other versions.
This article will explain and provide an opinion about them. We will compare them and give the advantages and disadvantages of each one.
Getting Started
First of all, we will talk about different topics to compare them. Let’s talk about prices first.
Power BI has different licenses. The following picture shows the different pricing options.
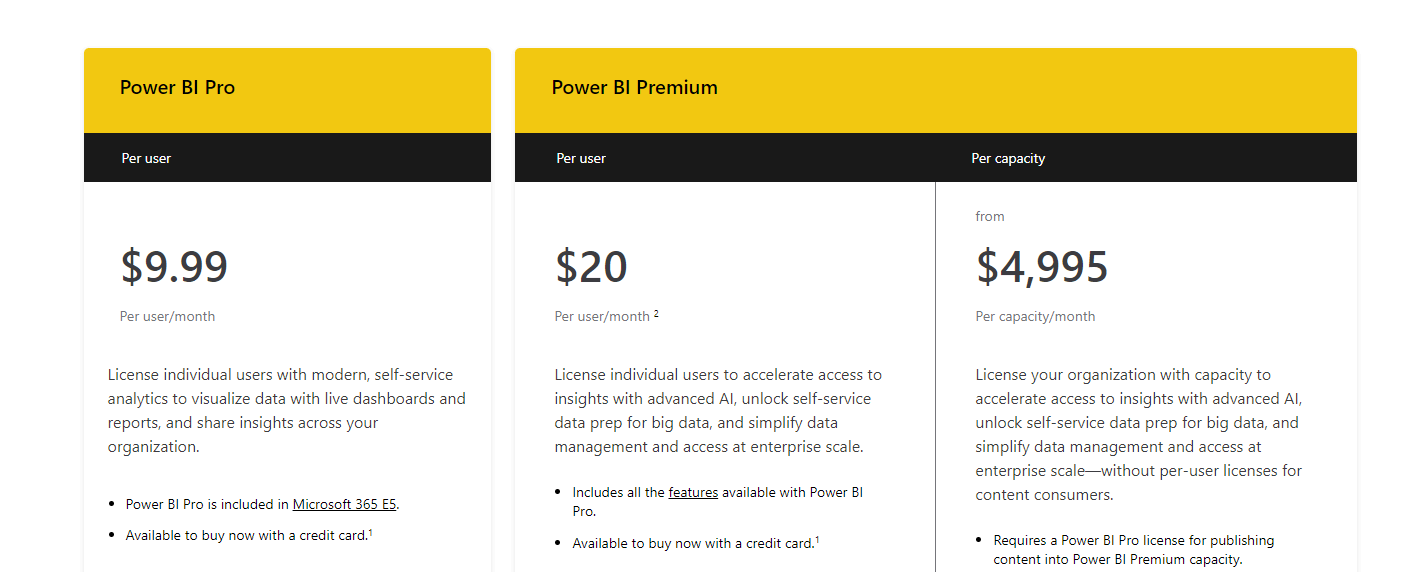
So, if you have few users, the option to pay per user can be affordable.
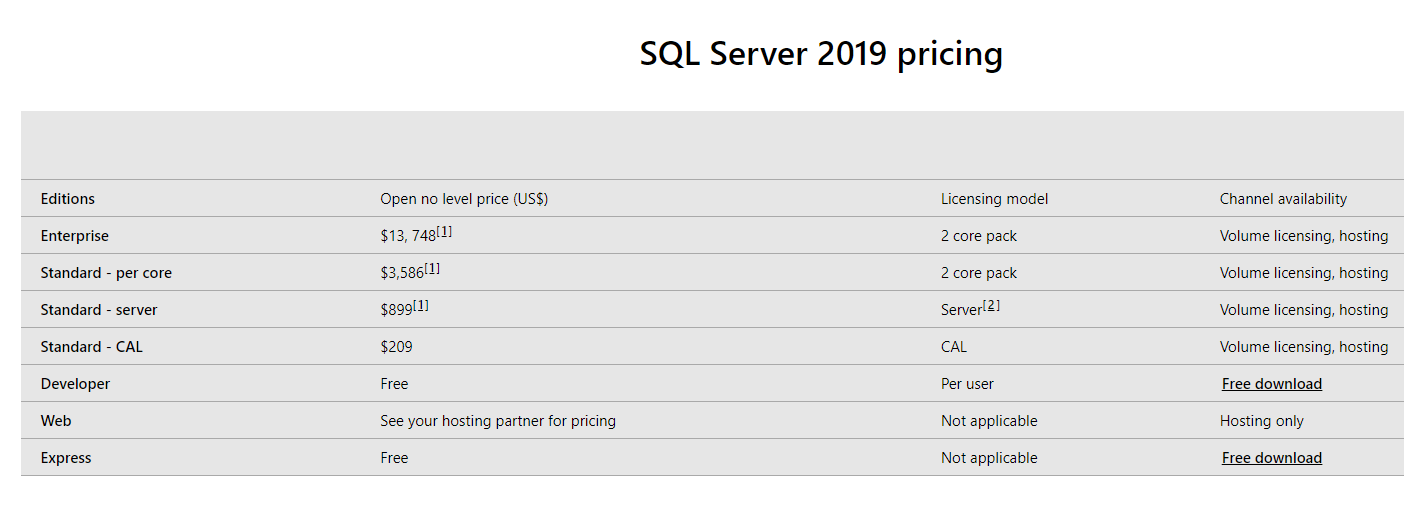
In SSRS, the license comes with SQL Server. If you already bought SQL Server, the tool is free, so if you do not want to spend more money on Power BI licenses, you can stay with SSRS. For more information about features supported in SQL Reporting Services per edition, refer to this link: SQL Server Reporting Services features supported by editions
In addition, for more information about SQL Server prices, please take a look at this image:
Data Sources Supported
With Power BI, you can connect with everything. It provides you a Wizard to connect to almost anything. For example, you can connect to files like XML, JSON, HTML, Several databases, Power Platforms, Azure Services, Online Services like SharePoint, Microsoft Exchange, Dynamics 365, Salesforce, Google Analytics, Adobe Analytics, GitHub, LinkedIn Sales Navigator, and more.
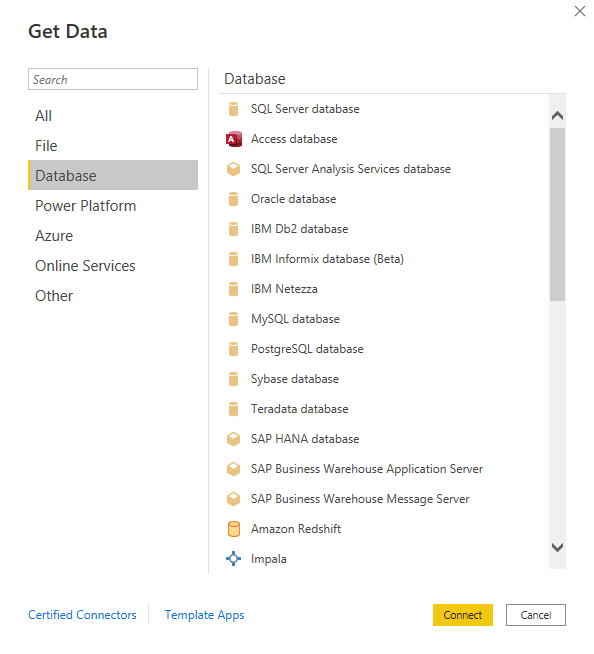
For a complete list of supported data sources in Power BI, refer to the following link: List of supported Data Sources in Power BI
Moreover, In SSRS you have a more limited number of data sources. You can connect to SQL Server, Azure Synapse, SSAS Multidimensional or Tabular, to Power BI Premium datasets, SharePoint lists, XML files, Report Server Models, SAP multidimensional databases, Oracle, DB2, Teradata and create generic OLE DB and ODBC connections.
For the complete list of data sources supported refer to this link: List of Data Sources supported in SSRS
Also, there is a big disadvantage in SSRS. There is not too much documentation to connect to different sources using ODBC and OLEDB.
Power BI vs SSRS popularity. Which one is the most popular reporting tool?
If we check the Gartner data, we will see that Power BI has 4.4 stars with 2433 ratings.

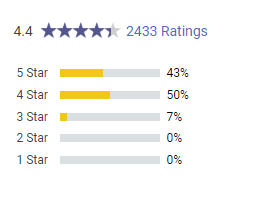
If we compare with SSRS, we notice that it has the same number of stars, but just 508 ratings.
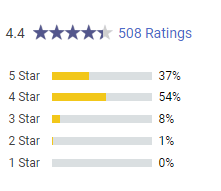
This gives us an idea about how popular they are and we clearly see that there are more users in Power BI. If I look for SSRS jobs in Google, I get 3 million results.

On the other hand, if I look for Power BI jobs, I get 2510 million results! It is a big difference!

The same in job sites (Fiverr, Indeed, etc.), you will find more jobs, more developers for Power BI. That does not mean that you should necessarily move Power BI because there is a lot of developers competing for the same jobs. In SSRS, there are less experienced developers around the world and then, it is sometimes easier to get a job there. However, it is always a good practice to know the competitors.
Also, you will also find more communities, forums, documentation for Power BI which is always useful.
SSRS Expressions vs DAX
To make your reports more dynamic and use functions, you can use SSRS Expressions in SSRS and DAX in Power BI.
First of all, for more information about SSRS Expressions refer to this link: SSRS Expressions Tips and Tricks
Secondly, for more information about DAX, refer to this link: Apply DAX basics in Power BI Desktop
In general, there is more documentation for DAX and more books related. You can use DAX in Tabular Databases, Multidimensional Databases. DAX sometimes is similar to Excel functions (I repeat sometimes) so it is easier to understand and create some queries on it. It is a more complex and complete expression language to handle data. On the other hand, SSRS expressions are simpler and most commonly used to handle parameters and make the report more dynamic. It is not fair to compare them because there are used in different situations. DAX is used mainly for queries, while the Expressions can be used to add more options, parameters, dynamic queries.
Power BI vs SSRS. Which one has a better UI?
Even if you never used the tool, you can easily drag and drop and create simple reports in Power BI in 30 minutes.
On the other hand, in SSRS, you can easily create a report with the Wizard, but to understand the structure (data sources, data sets, and the report itself, it will take you a little longer to customize your report). The UI is modern and intuitive in Power BI. You will feel it is newer and use-friendly.
SSRS did not modify too much the old interface from 2005. The interface is almost the same.
In Power BI you can click on your graphics and get some dynamic filters on them. The graphic reports are more powerful and have more functionality.
New Visuals
Something that I love about Power BI is that you can easily get more visuals for Power BI.
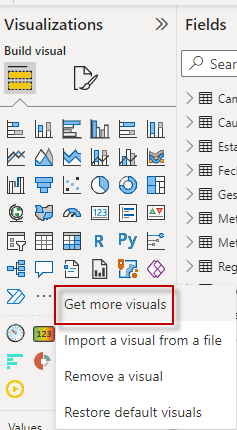
There is a big community that can provide you with nice visuals to create custom reports. In SSRS, there is no such big community to create custom controls. Also, creating your own custom item in SSRS is a more complex task that requires good programming knowledge and the documentation is harder to follow for newbies. In Power BI, creating your own visual is not a straightforward task either, but at least you have more resources with better documentation.
Some Power BI disadvantages
Not everything is great with Power BI. In SSRS you can easily export your reports to XML, CSV, TIFF files, PDF, MHTML, Excel, PowerPoint, and Word.
In Power BI you can export to PDF. It is true that you can download some Python or R extensions to other formats, but in general and by default, it officially exports the reports to PDF and you need to do extra efforts to have your reports in other formats.
For printable Reports, SSRS is still better than Power BI. Power BI created the Power BI Report Builder which looks like the SSRS report builder to create paginated and printable reports.
Another big disadvantage of Power BI is that it can take too much space because the PBIX file is a compressed model while the SSRS RDL file is a small XML file with queries to the database.
Conclusion about Power BI vs SSRS
To conclude, we can say that Power BI is an extremely powerful tool to easily generate reports. SSRS did not innovate the UI and is still using the same technology concept for the development with a few changes.
There are still several jobs for SSRS in the market, but if you are an SSRS developer is a good idea to take a look at Power BI or similar tools in the long run.