

As I was preparing my presentation for the C# Corner SQL Server Virtual Conference, I came across (accidentally) a query plan that was unexpected. This plan had a suggested index that unfortunately supported that very unusual query plan. This article is not a “how you can do something better” one, but more of a starting point to discuss why the optimizer did what it did.
I look forward to your comments after reading (and maybe running the code on your computer). I’ve forward this code to Microsoft but have yet to receive acknowledgment or any discussion from them.
The Issue
Let’s look at what I did and what the results were. For reference, this code was run on SQL Server 2019, CU8.
Using the AdventureWorks2017 database I ran the following query (with Include Actual Query Plan):
SET STATISTICS IO,TIME ON;
DECLARE @StartDateDATETIME = '1/1/2012';
DECLARE @EndDateDATETIME = '1/1/2013';
DECLARE @StatusINT = 5;
DECLARE @TerritoryIDINT = 6;-- get all territories except Canada
SELECT SalesOrderID, RevisionNumber,TerritoryID, ModifiedDate
FROM Sales.SalesOrderHeader
WHERE ModifiedDate>= @StartDate
  AND ModifiedDate<  @EndDate
  AND [Status]= @Status
  AND TerritoryID   <> @TerritoryID;
SET STATISTICS IO,TIME OFF;
and I get the following execution plan (as expected) with a query cost of 0.54456:

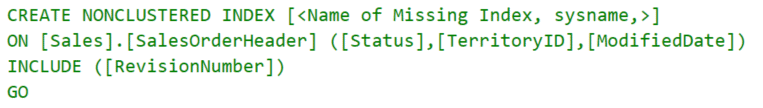
and with a suggested index of:
Looking at the executionplan.xml (attached as Query1ExecutionPlan.xml) shows a missing index suggestion and an actual cpu time of 8ms. The statistics IO results were
(3345 rows affected)
Table 'SalesOrderHeader'. Scan count 1, logical reads 689, physical reads 0, …
(1 row affected)
SQL Server Execution Times:CPU time = 16 ms, elapsed time = 223 ms.
If I apply the suggested index (as follows)
CREATE NONCLUSTERED INDEX IX_SalesOrderHeader_StatusTerritoryIDModifiedDate
     ON Sales.SalesOrderHeader ([Status],TerritoryID,ModifiedDate)
     INCLUDE ([RevisionNumber])
and then rerun the original query I get a strange looking query plan:
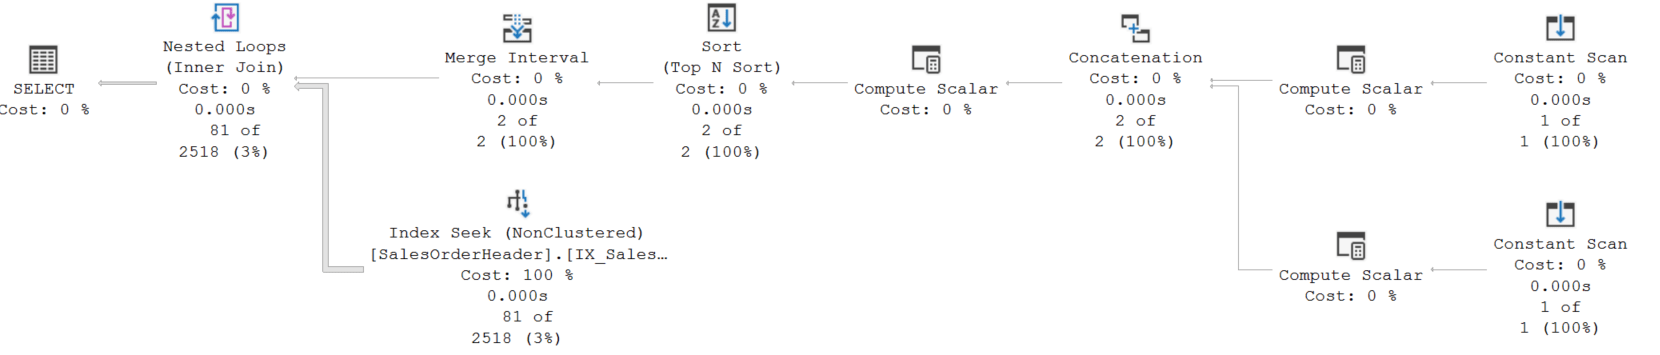
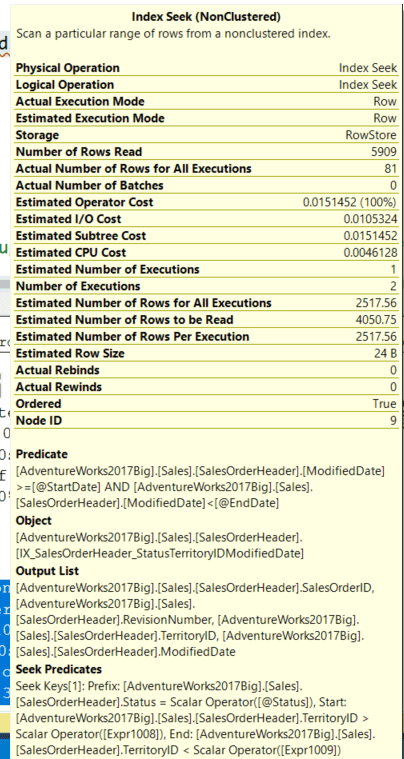
Hovering over the IndexSeek, I see these properties in the image below. With a Seek Predicate on Status and TerritoryID and a Predicate operation with ModifiedDate and a total query cost of 0.045771 with an actual cpu time = 3ms (from Query2ExecutionPlan.xml). What is interesting when inspecting the ExecutionPlan.xml is all the new Column References for Expr1008 through 1013 and their associated xml code.
The statistics IO results were
(3345 rows affected)
Table 'SalesOrderHeader'. Scan count 2, logical reads 87, physical reads 0, …
(1 row affected)
SQL Server Execution Times:CPU time = 0 ms, elapsed time = 150 ms.
But what is all this other stuff shown below?

BTW, the extra query plan “stuff” is similar in content to what Pinal Dave found in his blog on un-necessary indexes.
My Question
That is one of the questions I am posing to you.
Any ideas on why this extra logic coding shows up?
What is even more interesting is if I redo the covering index to interchange index column definition flipping order of TerritoryID and ModifiedDate
CREATE NONCLUSTERED INDEX IX_SalesOrderHeader_StatusModifiedDateTerritoryID
    ON Sales.SalesOrderHeader ([Status],ModifiedDate,TerritoryID)
    INCLUDE ([RevisionNumber])
and rerun the original query the query plan changes to what I originally expected:
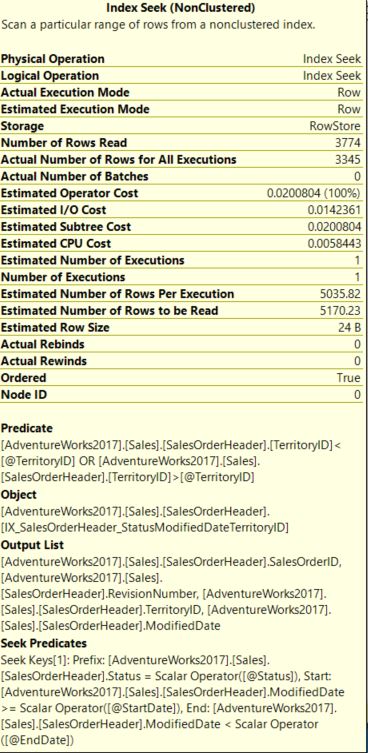
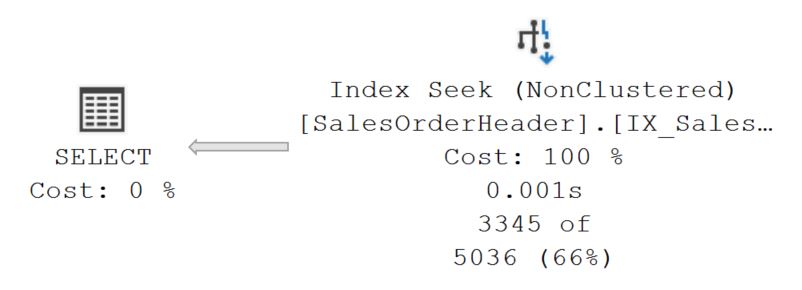
My properties are shown below. With a Seek Predicate on Status and ModifiedDate and a Predicate operation with TerritoryID, a total query cost of 0.0200804, and with an actual cpu time = 2ms (from Query3ExecutionPlan.xml).
The statistics IO results were
(3345 rows affected)
Table 'SalesOrderHeader'. Scan count 1, logical reads 14, physical reads 0, …
(1 row affected)
SQL Server Execution Times:CPU time = 0 ms, elapsed time = 153 ms.
Notice that the query plan cost is about half of the original query plan with the suggested index and also the logical IOs dropped from 87 to 14. I am fairly sure that the optimizer took advantage of the ordering of ModifiedDate after the equality check of the Status column to achieve this performance increase.
For completeness, I want to try one more scenario. Let’s modify the index and keep Status and ModifiedDate in the index definition, but move TerritoryID to the INCLUDE clause as follows:
CREATE NONCLUSTERED INDEX IX_SalesOrderHeader_StatusModifiedDate --move TerritoryID to INCLUDE clause
ON Sales.SalesOrderHeader ([Status],ModifiedDate)
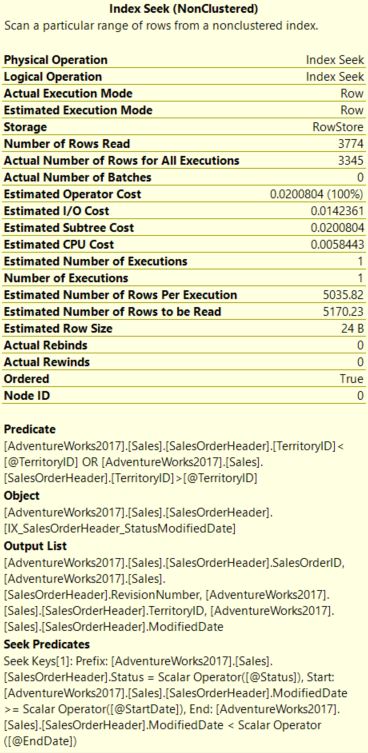
INCLUDE ([RevisionNumber],TerritoryID)And now rerunning query (4) we get exactly what we had for Query 3:
With a Seek Predicate on Status and ModifiedDate and a Predicate operation with TerritoryID, a total query cost of 0.0200804, and with an actual cpu time = 2ms (from Query4ExecutionPlan.xml).
The statistics IO results were
(3345 rows affected)
Table 'SalesOrderHeader'. Scan count 1, logical reads 14, physical reads 0, …
(1 row affected)
SQL Server Execution Times:CPU time = 0 ms, elapsed time = 152 ms.
So in Query 4 since TerritoryID was in the Predicate it didn’t matter that for the Predicate scan that TerritoryID was in the index column definition or the INCLUDE clause. For a very large table though, by having TerritoryID in the INCLUDE clause you might get a slightly lower logical read count since TerritoryID is only carried in the leaf level and not the root and intermediate levels of the B-Tree.
We all know that the query optimizer does not always give the perfect query plan, but just one that is adequate. The actual terminology comes from the ExecutionPlanXML: “StatementOptmEarlyAbortReason="GoodEnoughPlanFound"” Since this is a relatively simple query with only one table I wonder why it “stopped short”
So two more questions:
- Since this is a “simple” query why did the optimizer pick the wrong index and wrong query plan?
- What is the extra “garbage” associated with the query plan using the suggested index?
I welcome your comments. Let’s make this a collaborative effort.
Attached is the T-SQL script along with the QueryPlan.XML files for each of the four scenarios.