

I’m always trying to learn more about how the black box optimizer works and recently have been wondering how it resolves the following queries:

The dbo.Entity table contains 31,404,767 rows. All 4 queries have the same IO properties: Table 'Entity'. Scan count 1, logical reads 4, physical reads 0, etc., and the 4 query plans looking like this:
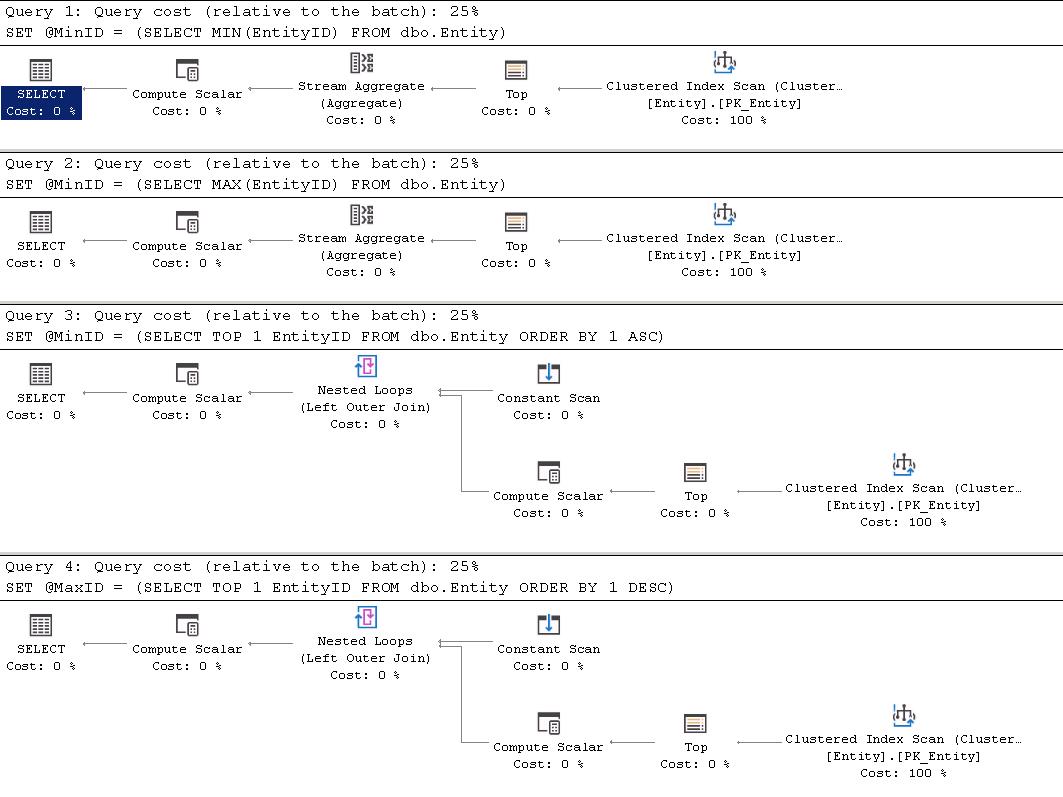
Hmmm, interesting! I would have thought the optimizer might come up with the same query plan for each query, but the TOP queries end up with a slightly more complex plan. Let’s examine the 4 plans and see what the differences are.
All 4 seem to be equal according to the query cost (relative to the batch): 25%, but looking at the actual numbers Queries 1 & 2 have a subtree cost
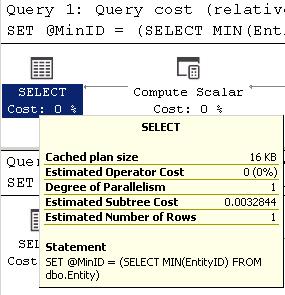
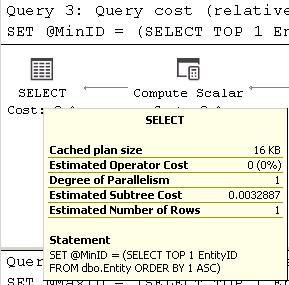
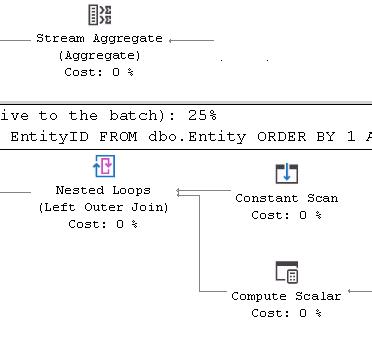
This is not a big difference (0.0000043), but it is a difference. Looking closer at the difference between the two plans the difference is in Query 1 & 2 you have the Stream Aggregate operator and in Query 3 & 4 you have the extra Compute Scalar, Constant Scan and Nested Loop operators.
I’m not going to discuss the relative merits of these operators, but one factor not shown here is that all 4 queries gave cpu times of 0 secs (really this is less than 0.5 milliseconds), but the elapsed times for all 4 queries consistently showed increased times of 4-8 for queries 3 & 4 than queries 1 & 2.
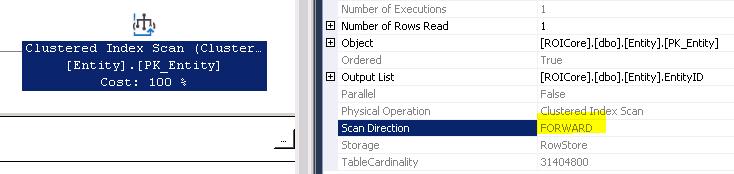
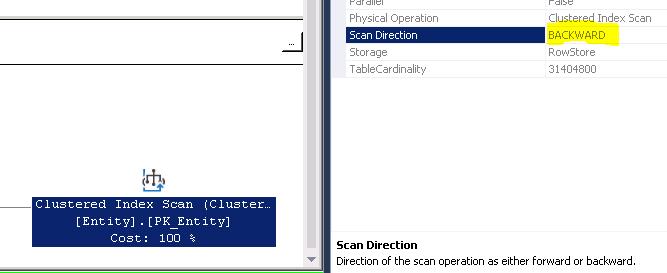
Queries 1 and 3 end up with a Forward scan of the Clustered Index (MIN) and Queries 2 and 4 with a Backward scan of the Clustered Index (Max) each returning a single row as shown in diagram below:
This is the result (and the answer) I expected from all 4 queries, but really do wonder why there all the other operators in the query plan -- I thought the optimizer was "smart" enough to recognize simple queries and not need the extra operators. 🙁
Finally, something I did not initially expect to see were the 4 logical reads. Upon review of the following query
dbcc showcontig ('dbo.Entity') with tableresults, all_indexes, all_levels;The partial results are
ObjectName | IndexName | IndexID | Level | Pages | Rows |
| Entity | PK_Entity | 1 | 0 | 257776 | 31404767 |
| Entity | PK_Entity | 1 | 1 | 792 | 257776 |
| Entity | PK_Entity | 1 | 2 | 3 | 792 |
| Entity | PK_Entity | 1 | 3 | 1 | 3 |
With 4 levels in the b-tree, even though one row was returned the queries still need to traverse 4 levels (i.e., 4 pages) to get the one row data.
So, what did we learn? It appears that the aggregate functions MAX and MIN and the TOP function all start with the same Index scan, but how the optimizer then uses the intermediate results is slightly different. Is there a big performance hit using TOP. I would say no, but if these TSQL statements were called 1000s of times over a short period time you might want to consider the MAX and MIN in lieu of the TOP function.