

This article is part 1 of a retail analytics market-based analysis in Power BI. In part 1, we will analyze customer purchasing frequency for various products, and the trend across years.
Identifying And Analyzing The Data
We will be using a sales sample file to identify the field elements for customer purchase behavior. You can download this Excel file, which looks like the image below.

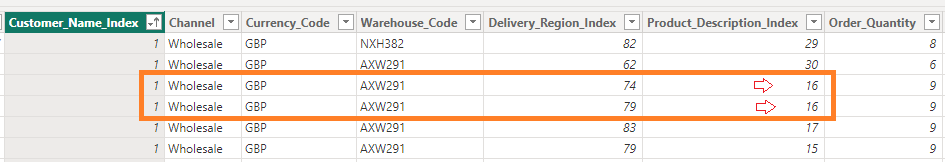
According to the sales table, the product identification is Product_Description_Index and the customer identity is Customer_Name_Index.
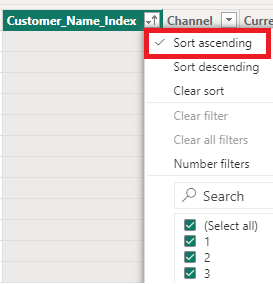
We will sort the Customer_Name_Index in ascending order to determine the number of times Customer_Name_Index = 1 has purchased each Product_Description_Index.
Customer_Name_Index 1 has made two purchases in relation to product 16. The next action is to figure out how often each customer makes purchases.
Creating Calculated Column in Sales Table
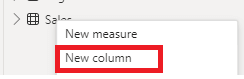
In the first step, we will create a calculated column in the sales table named Purchase Product Frequency.
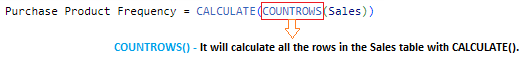
Then, we will use the CALCULATE() and COUNTROWS() functions to calculate the count of rows in the sales table. In order to learn more about CALCULATE() and COUNTROWS(), please refer to the link.
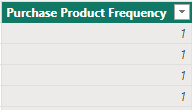
The output will look like the below screenshot. This is calculating each row on the sales table at row level rather than table level, so it shows all the results as 1.
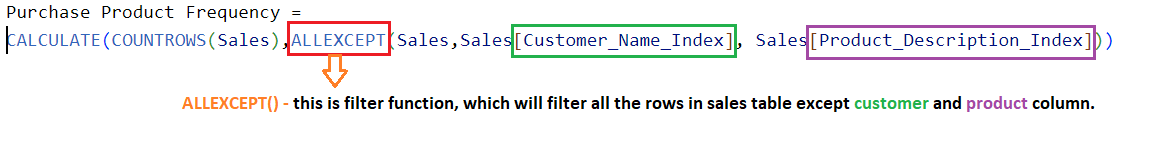
However, we want to calculate purchase frequency, which is how many times each customer has brought specific products. In order to accomplish this, we will extend our previously calculated columns by using the ALLEXCEPT() function.
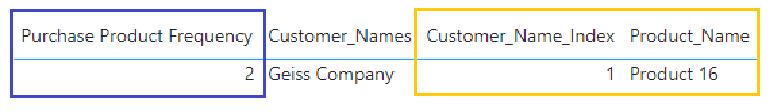
Hence, the result will look like below. if you noticed, for customer =1 the product 16 has purchase frequency 2. It is what we have determined above as well.
Trend Over Years
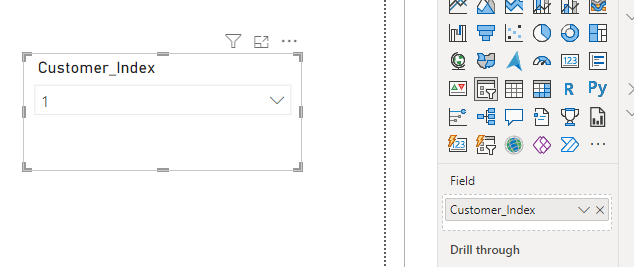
We will analyze the customer = 1 purchase frequency over the years to see the purchasing trend across all products. In step 1, we will use a slicer for customer_name_index and a table matrix visual to see the trend for all the products. We will analyze the customer = 1 purchase frequency over the years to see the purchasing trend across all products.
Slicer
Matrix Table Chart
Once you insert a matrix table chart, you will be able to see the trend over the years 2015, 2016, 2017, and 2018. The reason we want to take the count value on a yearly basis for purchase product frequency for customer = 1. It is because we can analyze the number of times purchases have been made for each product.
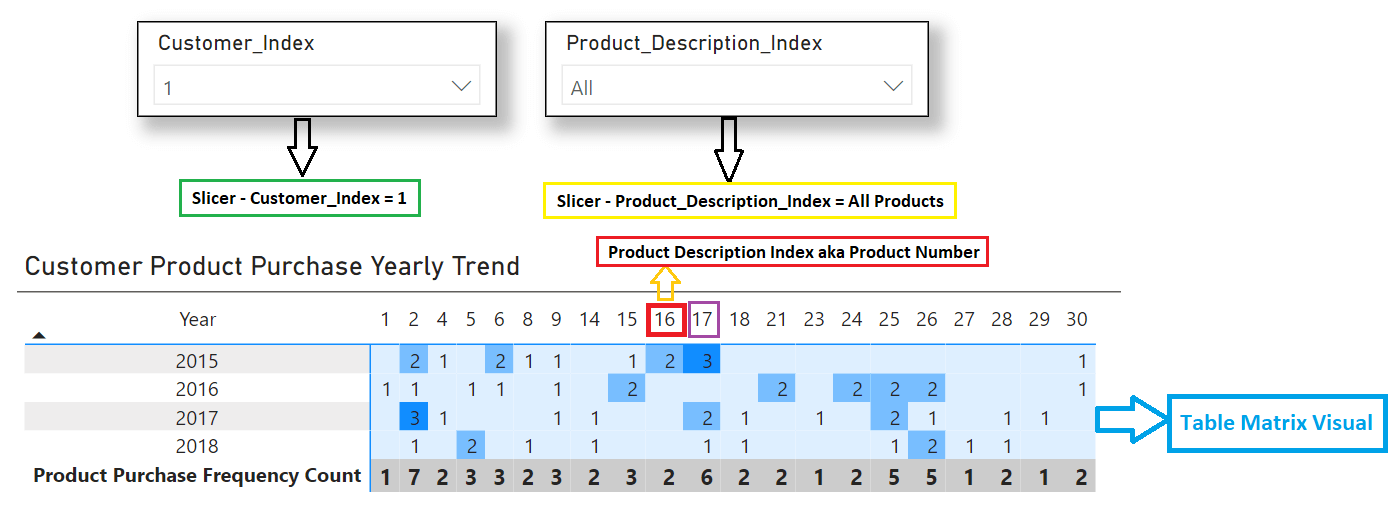
If you analyzed the above for product = 16 against customer 1, two purchases have been made. Similarly, for product = 17, there were three, two, and one in 2015, 2017, and 2018, respectively.
Conclusion
The Power BI methods mentioned above can assist us in projecting business decisions to boost sales and revenue in the retail sector and in understanding the purchasing habits of firms' customers. As part of the consumer segmentation technique, I will be conducting a more sophisticated analysis in the upcoming part.

