

Introduction
Reporting on web data has been a fascinating part of developing any dashboard or reports in Power BI. Often this data is available either free that can be consumed anonymously or by using some kind of authentication mechanism. In this article, I'm going to demonstrate how to connect to a web application from Power BI using a simple authentication mechanism (API Key) and generate a basic report on it.
Solution
For this article, the web application we are going to use is Alphavantage Stock API. It is one of the established finance APIs where you can fetch details of historical stock prices on US and global exchanges. For illustration purposes, we'll fetch data only for one stock. The same technique can be implemented to fetch details for other stocks as well. Finally, we will create a report in Power BI, that can visualize the stats for these stock prices.
There are multiple ways in which we can fetch stock prices (intraday, daily, etc.), in this tutorial, we will fetch the daily stock prices from the web API. The documentation for the API is available here. The first thing that we need to do is to create an API key that can be used to fetch the details from the web page.
Step 1 - Generate an API key
To generate the API key, you can follow the steps below.
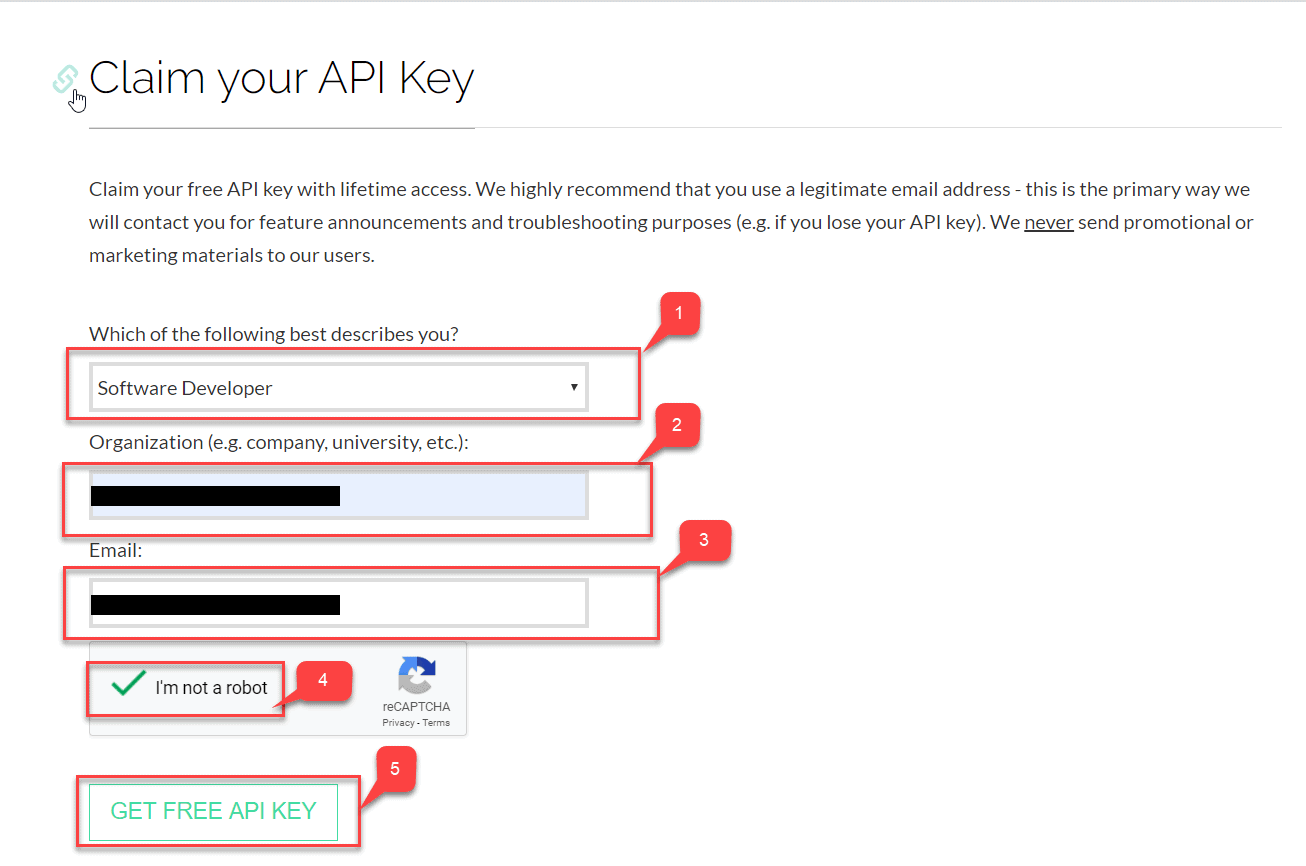
- Navigate to "Claim your free API key" and provide the necessary details. Click on "GET FREE API KEY".

Fig 1 - Get Free API Key - The API key will be listed on the same page. Just copy it for your reference.
Fig 2 - API Key

Step 2 - View the Stock Price Details
Once, the API key is generated for the web data, the next step is to call the API and fetch the stock details. You can refer to this documentation to understand more about the APIs available. In this article, we will fetch the daily stock prices, so we will use the daily time series query.
If you scroll below, you can notice that a sample link is available which we can use with a default value for Symbol = "MSFT" (Microsoft) and API key = "demo". We need to change the value for the API key in this link with the API key that we generated in the previous step.
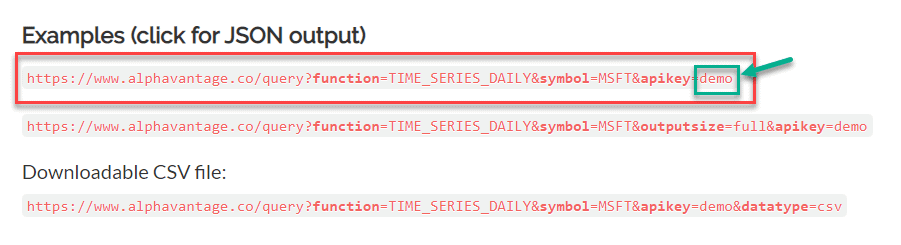
https://www.alphavantage.co/query?function=TIME_SERIES_DAILY&symbol=MSFT&apikey=YOUR_API_KEY
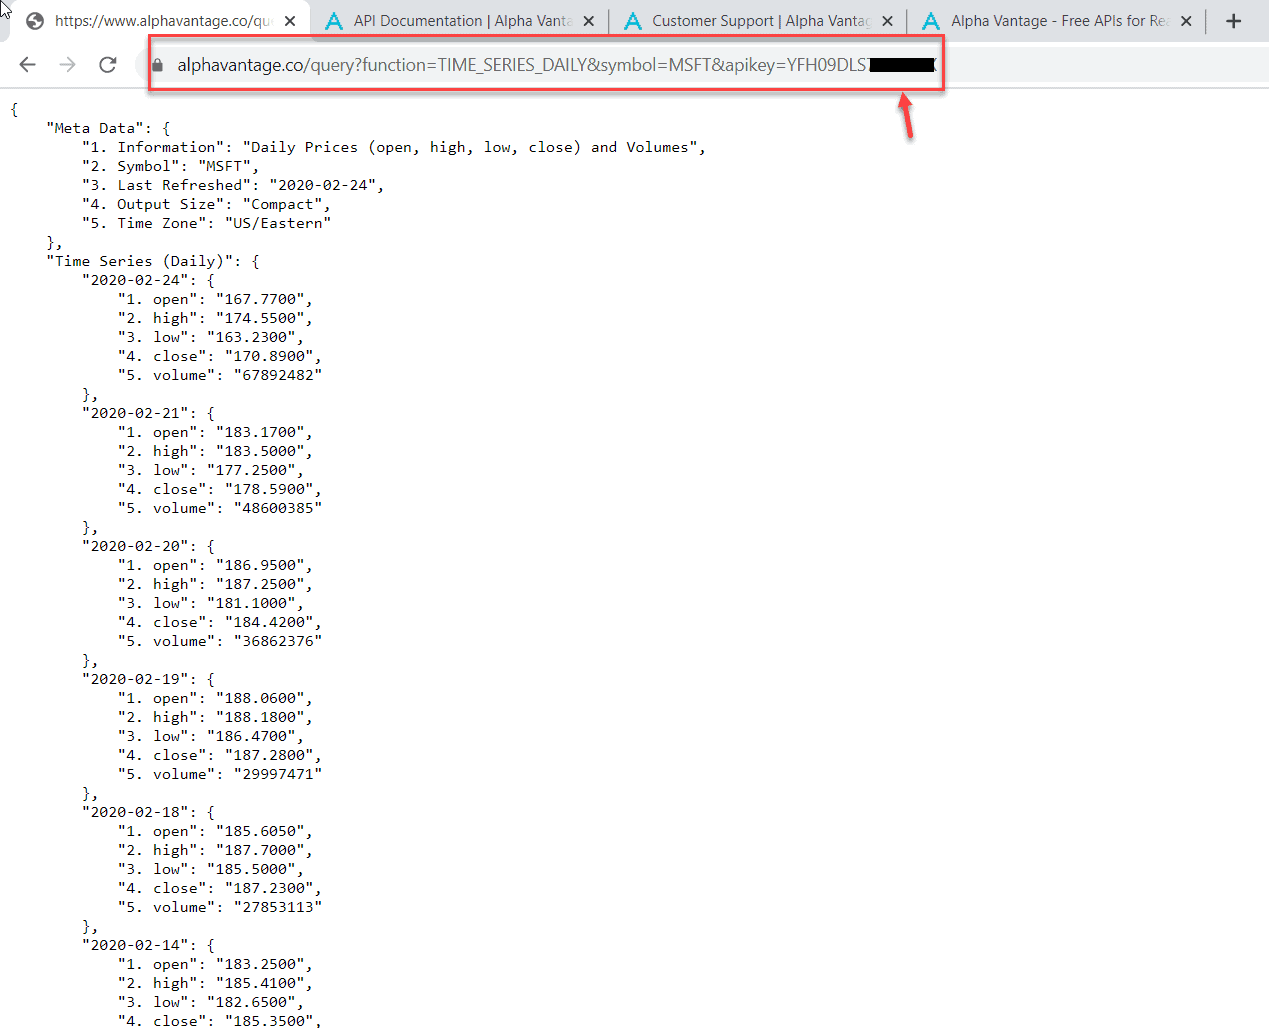
Once the API key is ready, append it the URL and hit it on the browser. You can see a dataset in JSON format.
Step 3 - Import Data into Power BI
Now, that we have generated the JSON web data in the browser, we can fetch the same in Power BI for visualization. You can follow the steps below and fetch the data.
- Copy the same URL as in the browser.
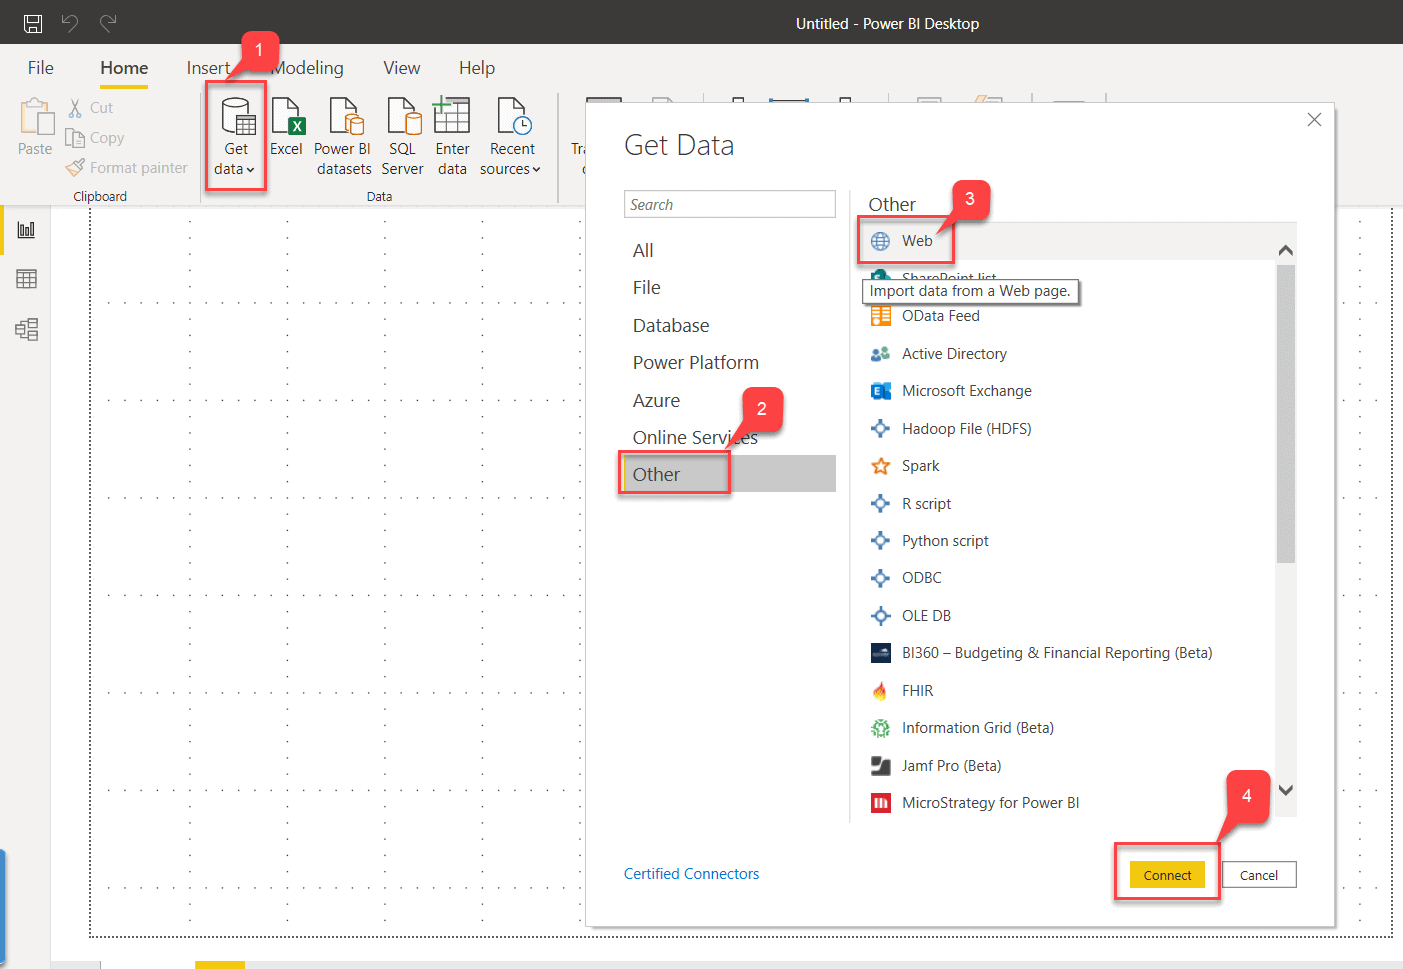
- Open Power BI and click on Get Data. Select Web from the Other tab and click Connect.
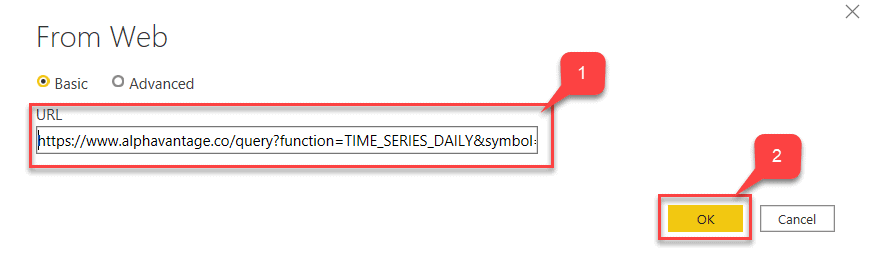
Fig 5 - Get Data in Power BI - The From Web dialog appears. Paste the URL that you have copied in Step 1 and click OK.
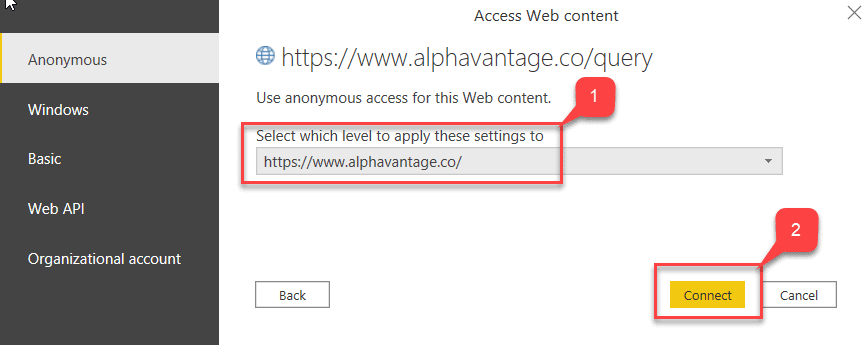
Fig 6 - From Web Dialog - In the Access Web Content dialog, select the root site as the level and click Connect.
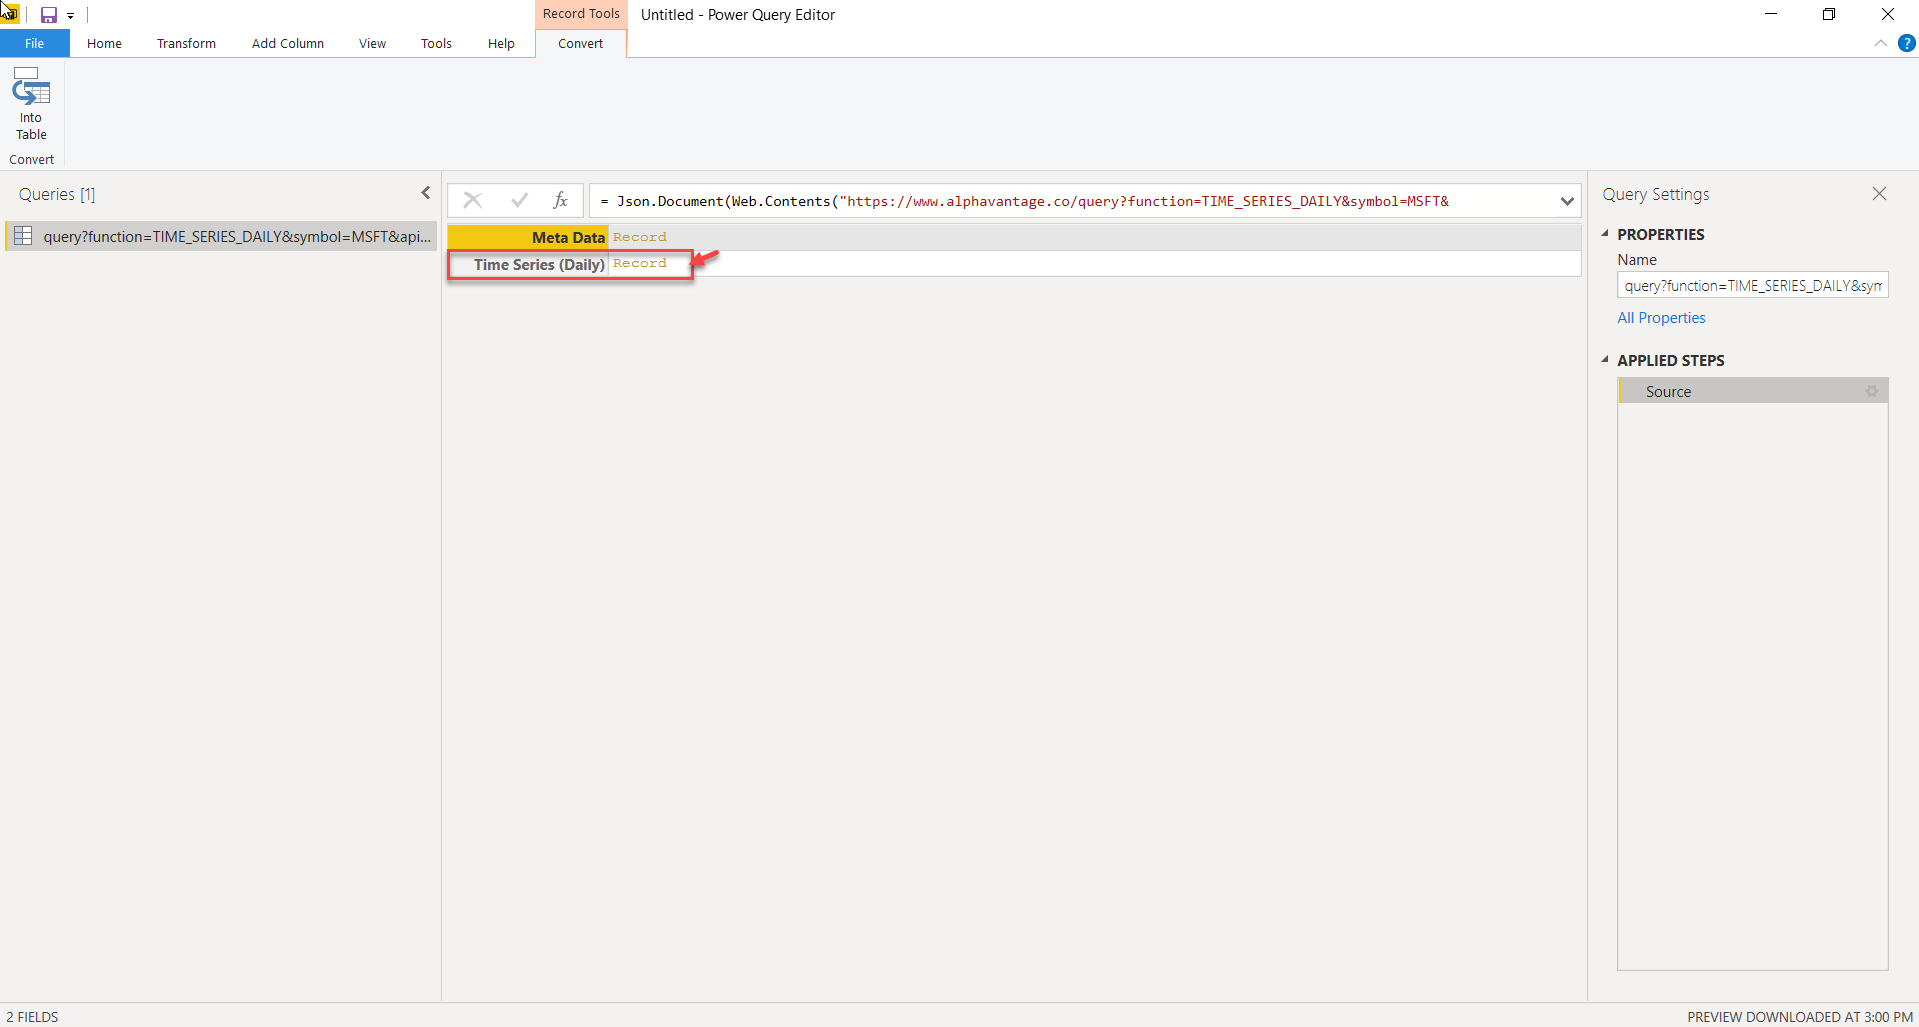
Fig 7 - Access Web Content - The Power Query Editor window opens with the JSON data included in it. Also, notice that the data is imported in the form of records. So, we would need to make some transformations in it before proceeding.
- Click on the Record against Time Series (Daily).
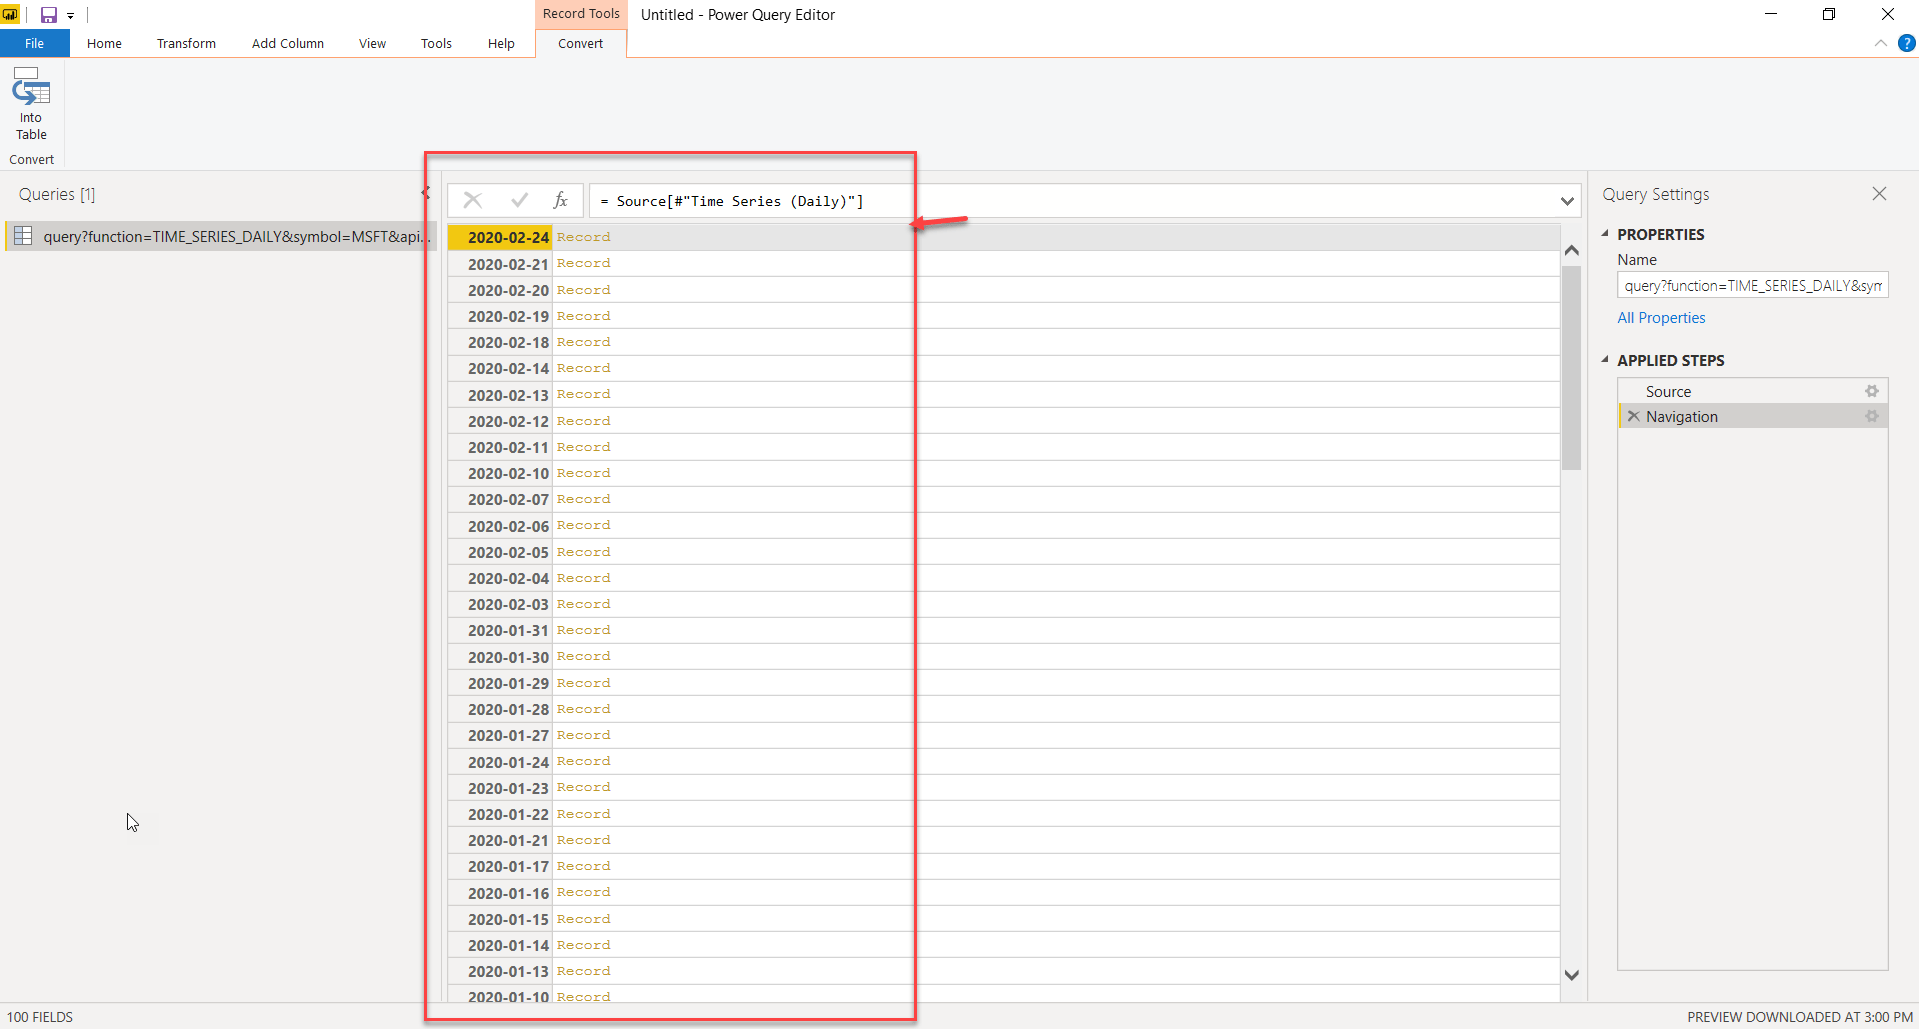
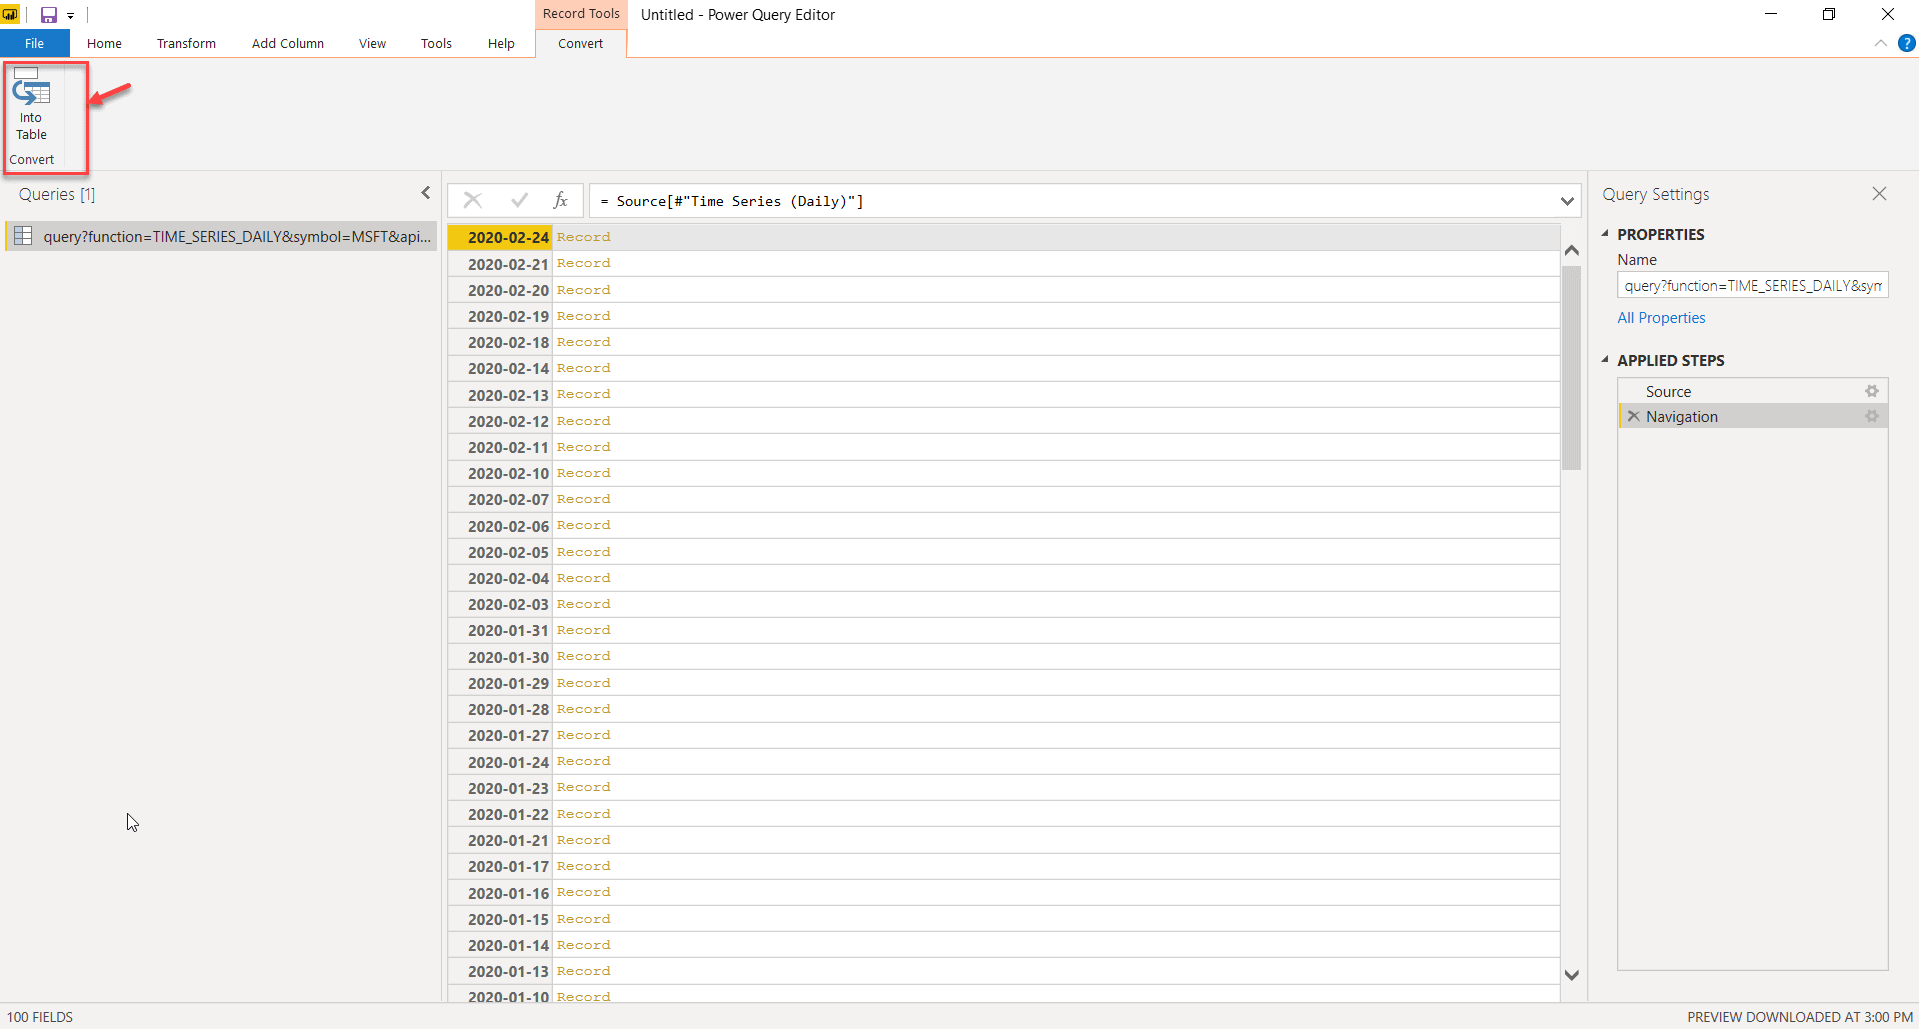
Fig 8 - Source Data in Power Query - The dataset expands and now we have Date values in it. Also, notice how these date values also contain a record in itself.
Fig 9 - Navigated to Dates - Now, we will convert this dataset into a Table in Power Query. Click on the Into Table button available on the left-hand top corner.
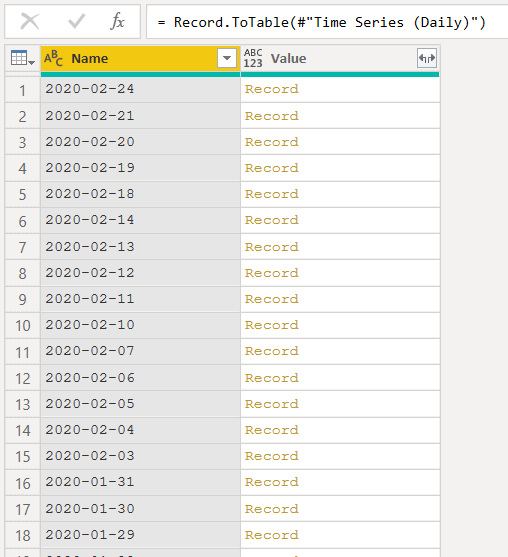
Fig 10 - Convert Into Table - Now we have converted the web data into a table in Power Query. We can make further transformations for our use now.
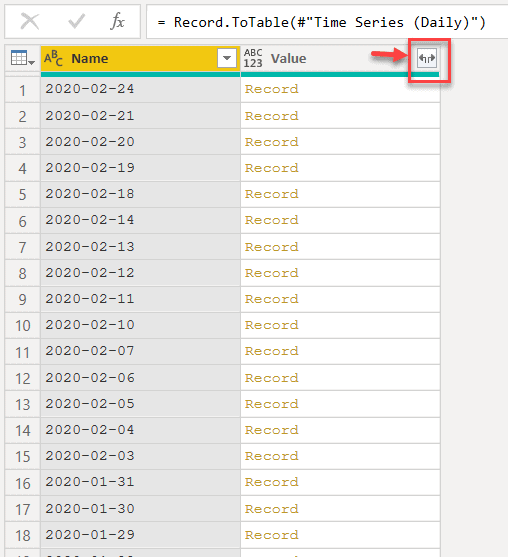
Fig 11 - Converted to table - On the column "Value", click on the expand button available on the right-hand top.
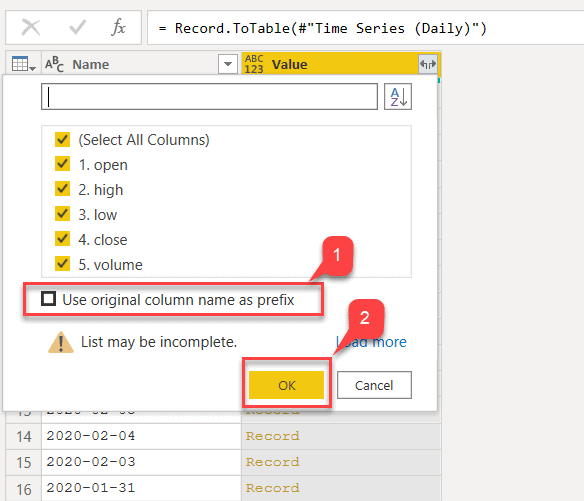
Fig 12 - Expand the records - Deselect the "Use original column name as prefix" and click OK.
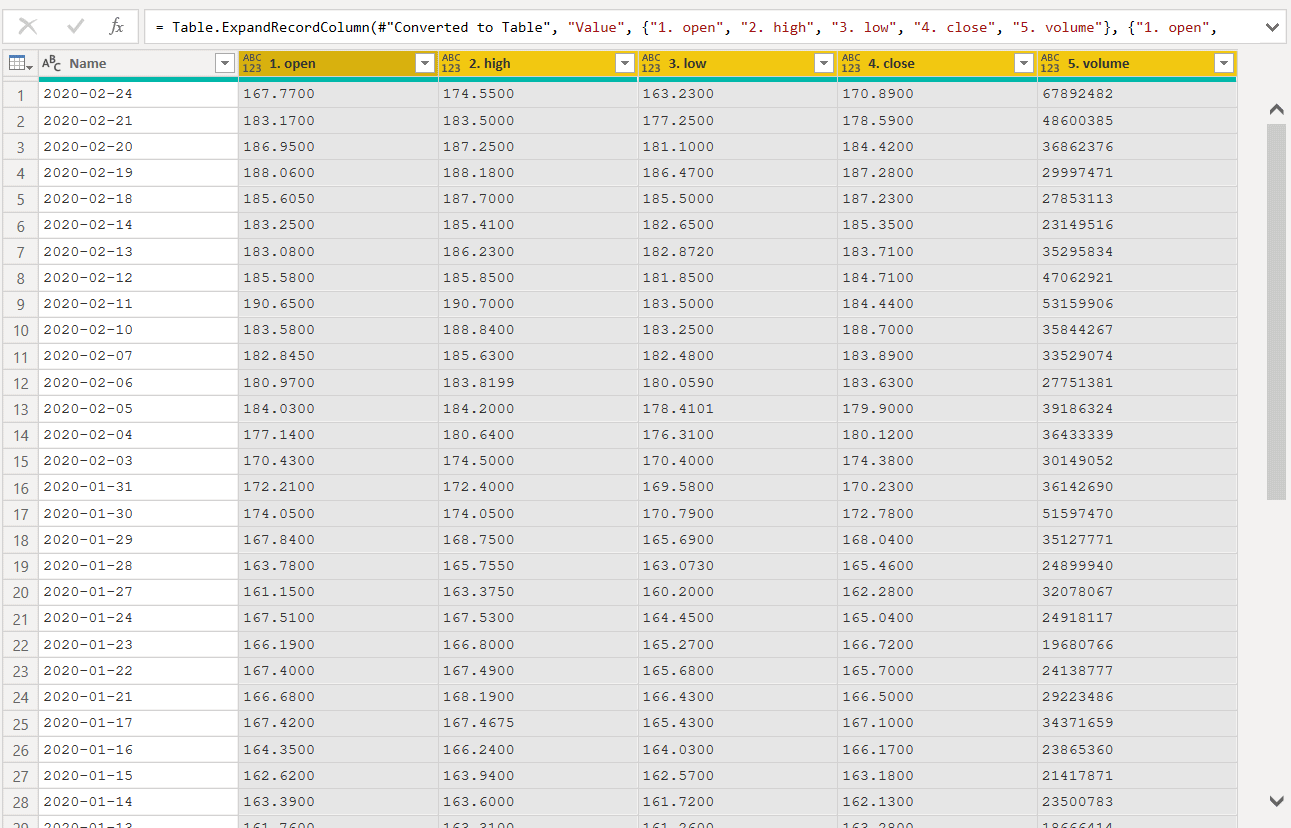
Fig 13 - Selecting Columns - Now, you can see the entire dataset available in Power Query Editor.
Fig 14 - Transformed Dataset
In the next steps, we will transform the dataset to fit our needs. We'll modify the column names and update the datatypes.
Step 4 - Transforming the data in Power Query
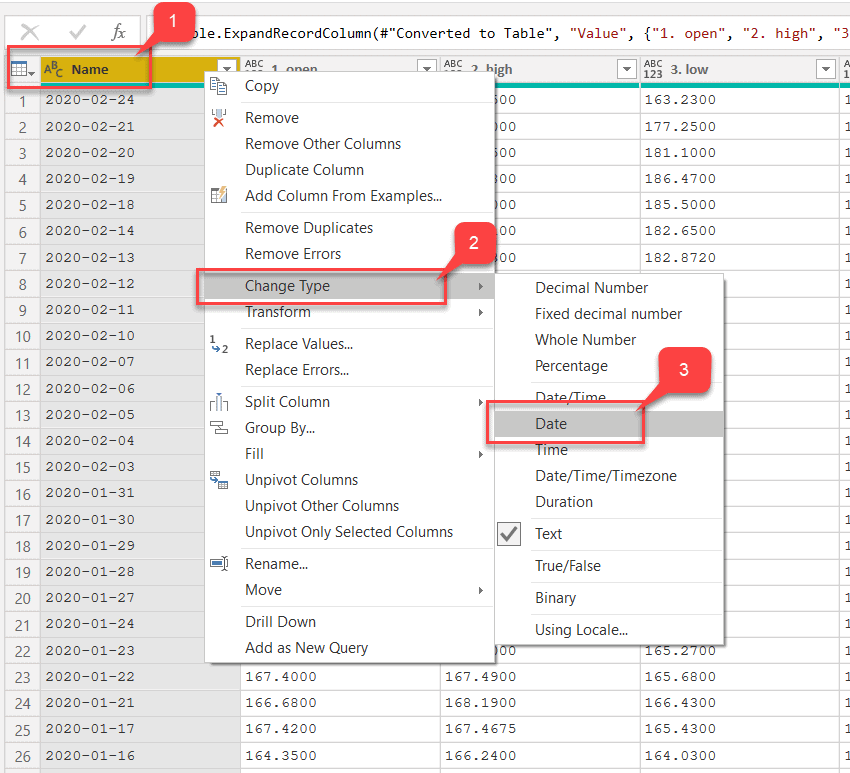
- Right-click on Name and select Change Type and further select Date.
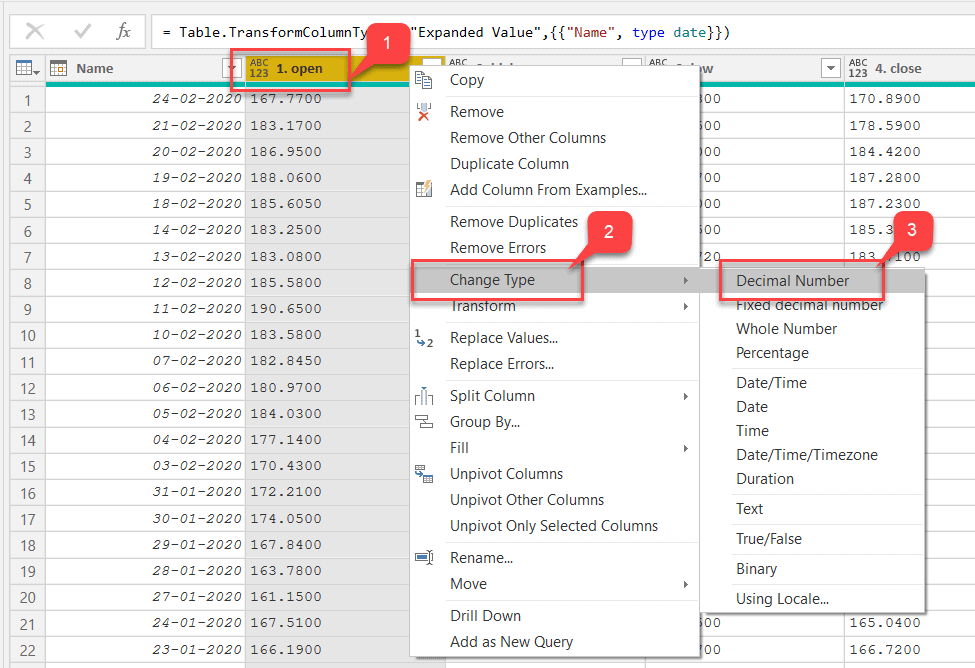
Fig 15 - Change Date data type - Right-click on "open" and select Decimal under Change Type. Repeat the same for the other three columns - high, low and close.
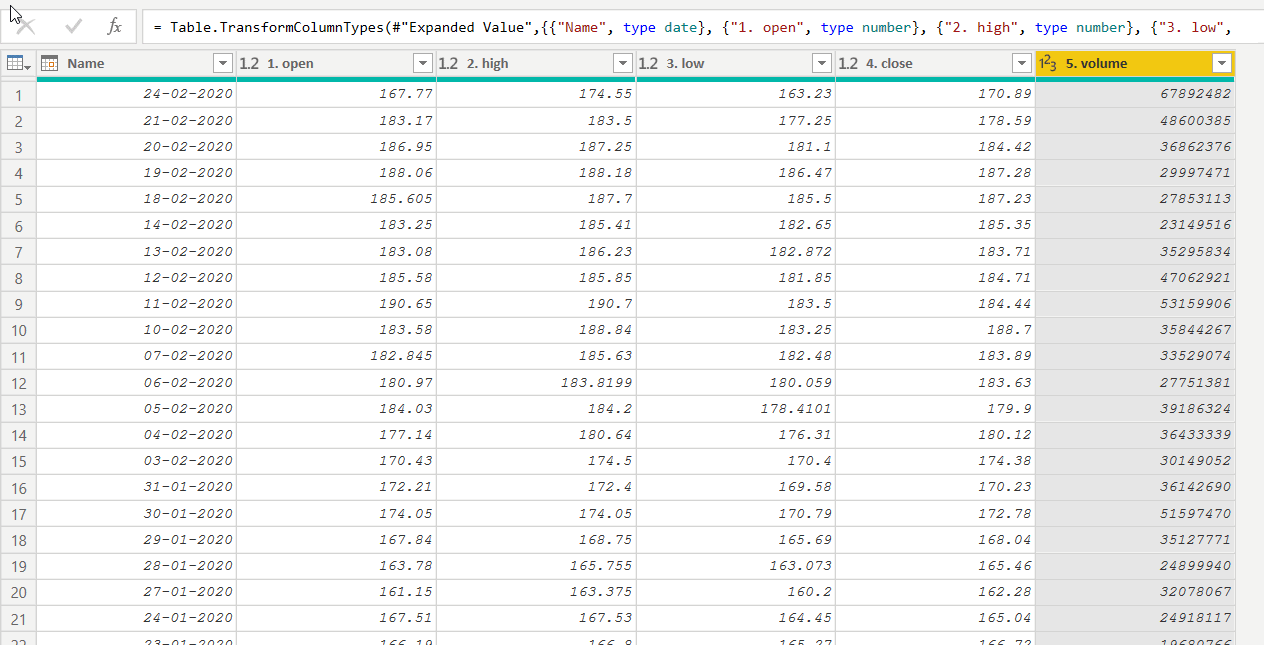
Fig 16 - Change Date data type - For "volume", select the data type as the Whole Number.
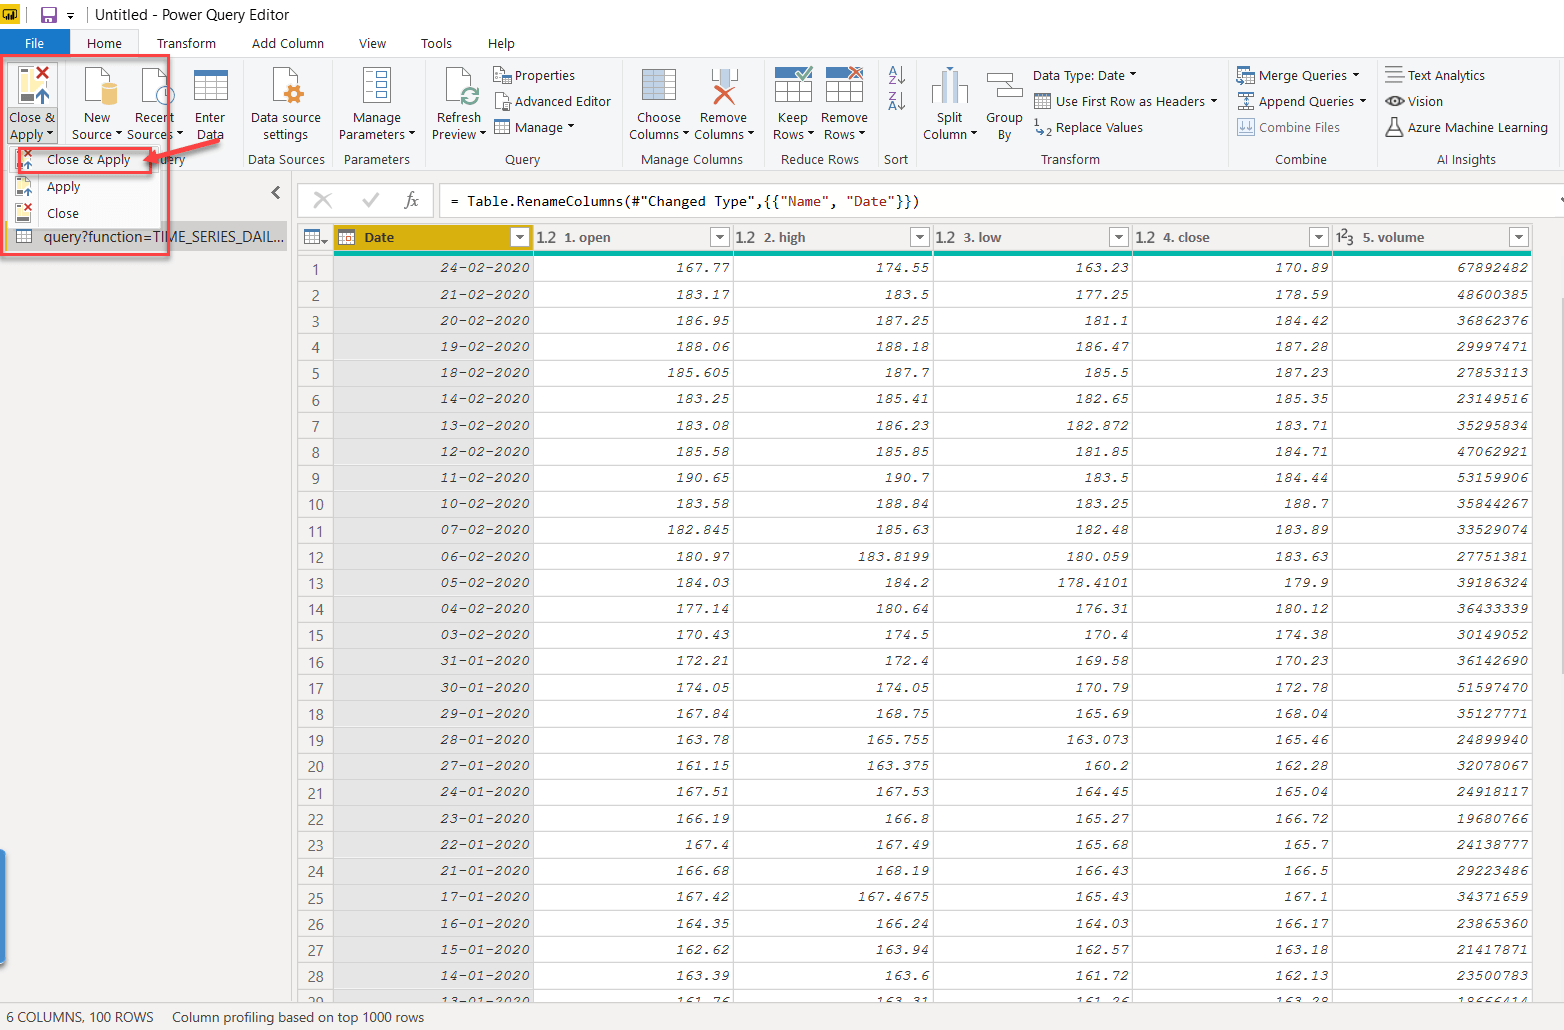
Fig 17 - Change Date data type - Rename the column "Name" to "Date" and click on Close and Apply.
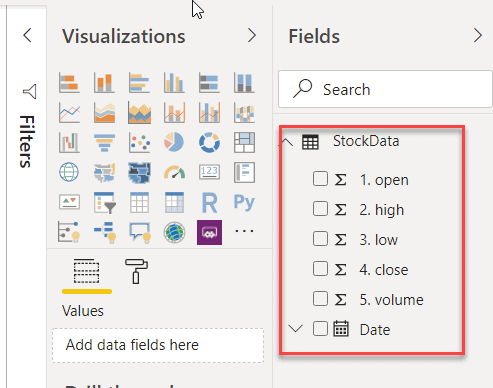
Fig 18 - Close and Apply - You can see the data has been loaded into the model. Rename the query as "Stock Data".
Fig 19 - Data imported into Power BI
Step 5 - Visualizing the data
The best way to visualize a stock price us by using Candle Stick charts. This is a special type of chart that is being used in the financial calculations to monitor the performance of a stock and so on. This chart is not available in the Power BI report by default. We need to import it from the AppSource. To learn more about the implementation of this chart, you can follow this article.
- Click on More Visuals and select From AppSource.
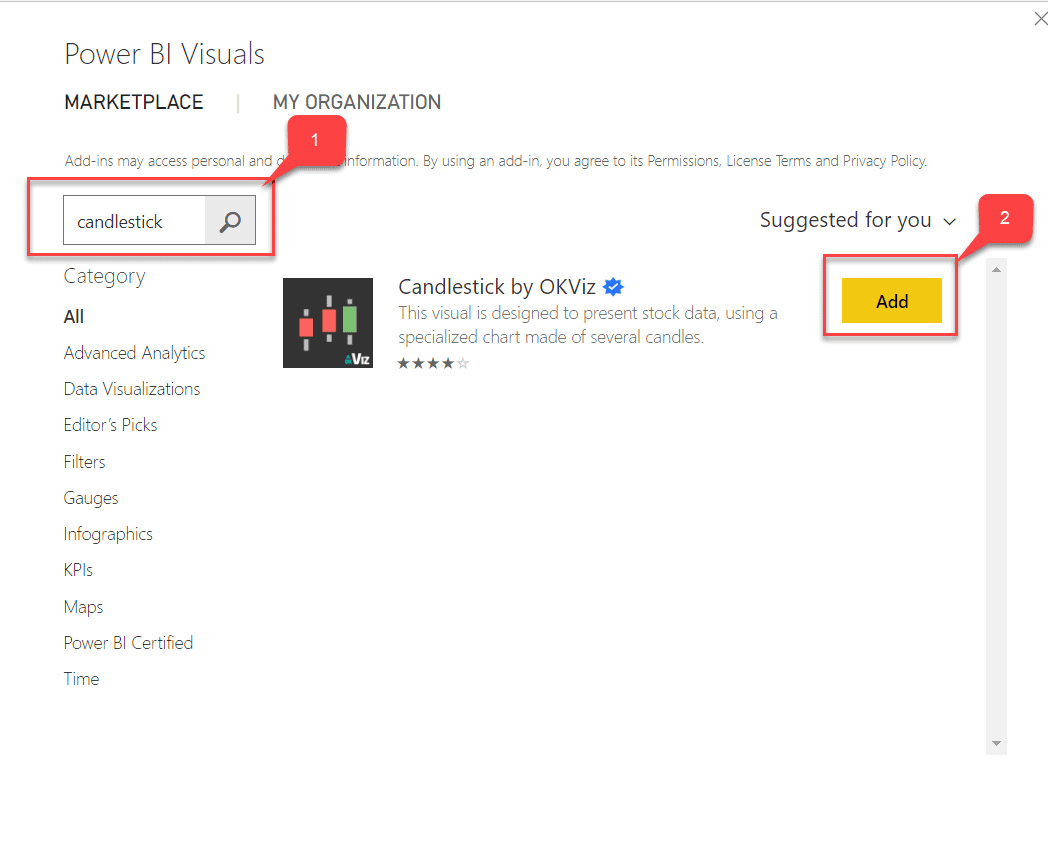
- In the Power BI Visuals dialog, search for "candlestick" and select "CandleStick by OKViz".
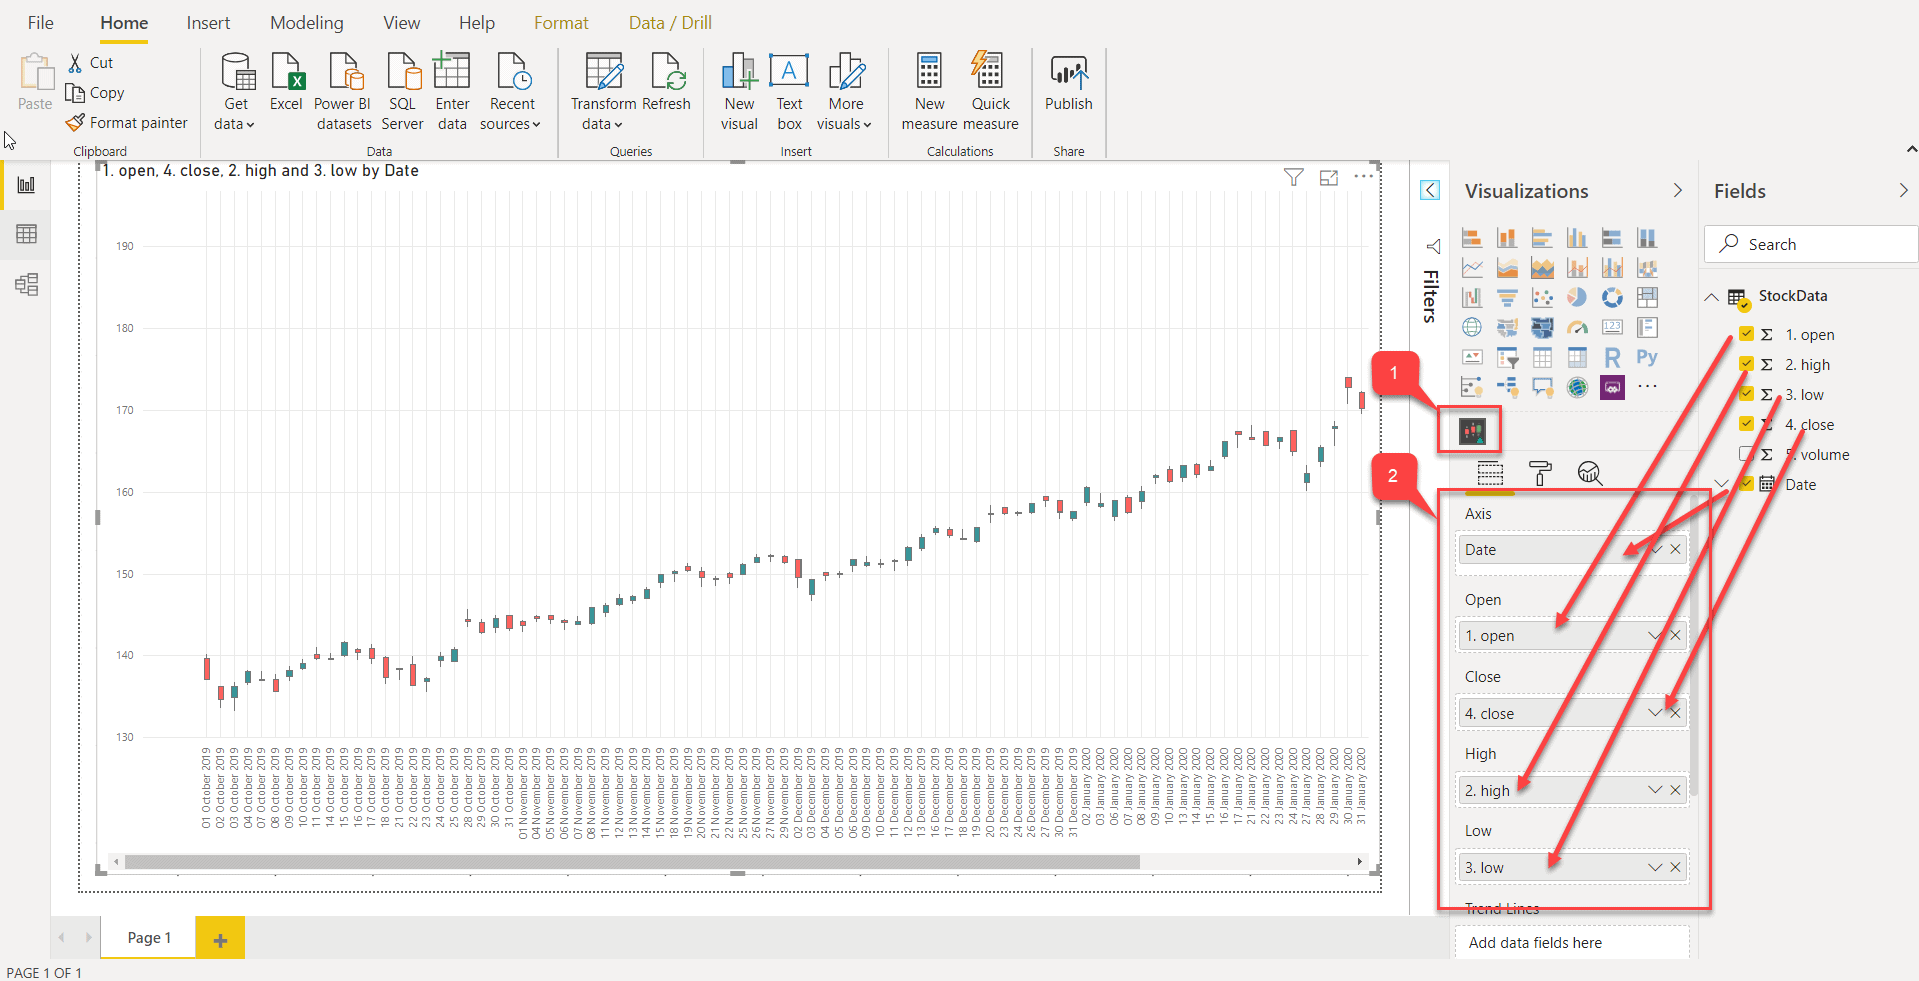
Fig 20 - CandleStick chart in AppSource - Once imported, click on the icon for the CandleStick chart. On the Visualizations pane, drag and drop the columns as shown in the figure respectively for each open, high, low and close. The candlestick chart will be generated based on the values available.
Fig 21 - Generating the chart - Expand the Filters pane, and expand Date. Select the Filter Type as Relative Date and Show items as the "in the last 30 days". Click on Apply Filter.
Fig 22 - Filtering the final chart
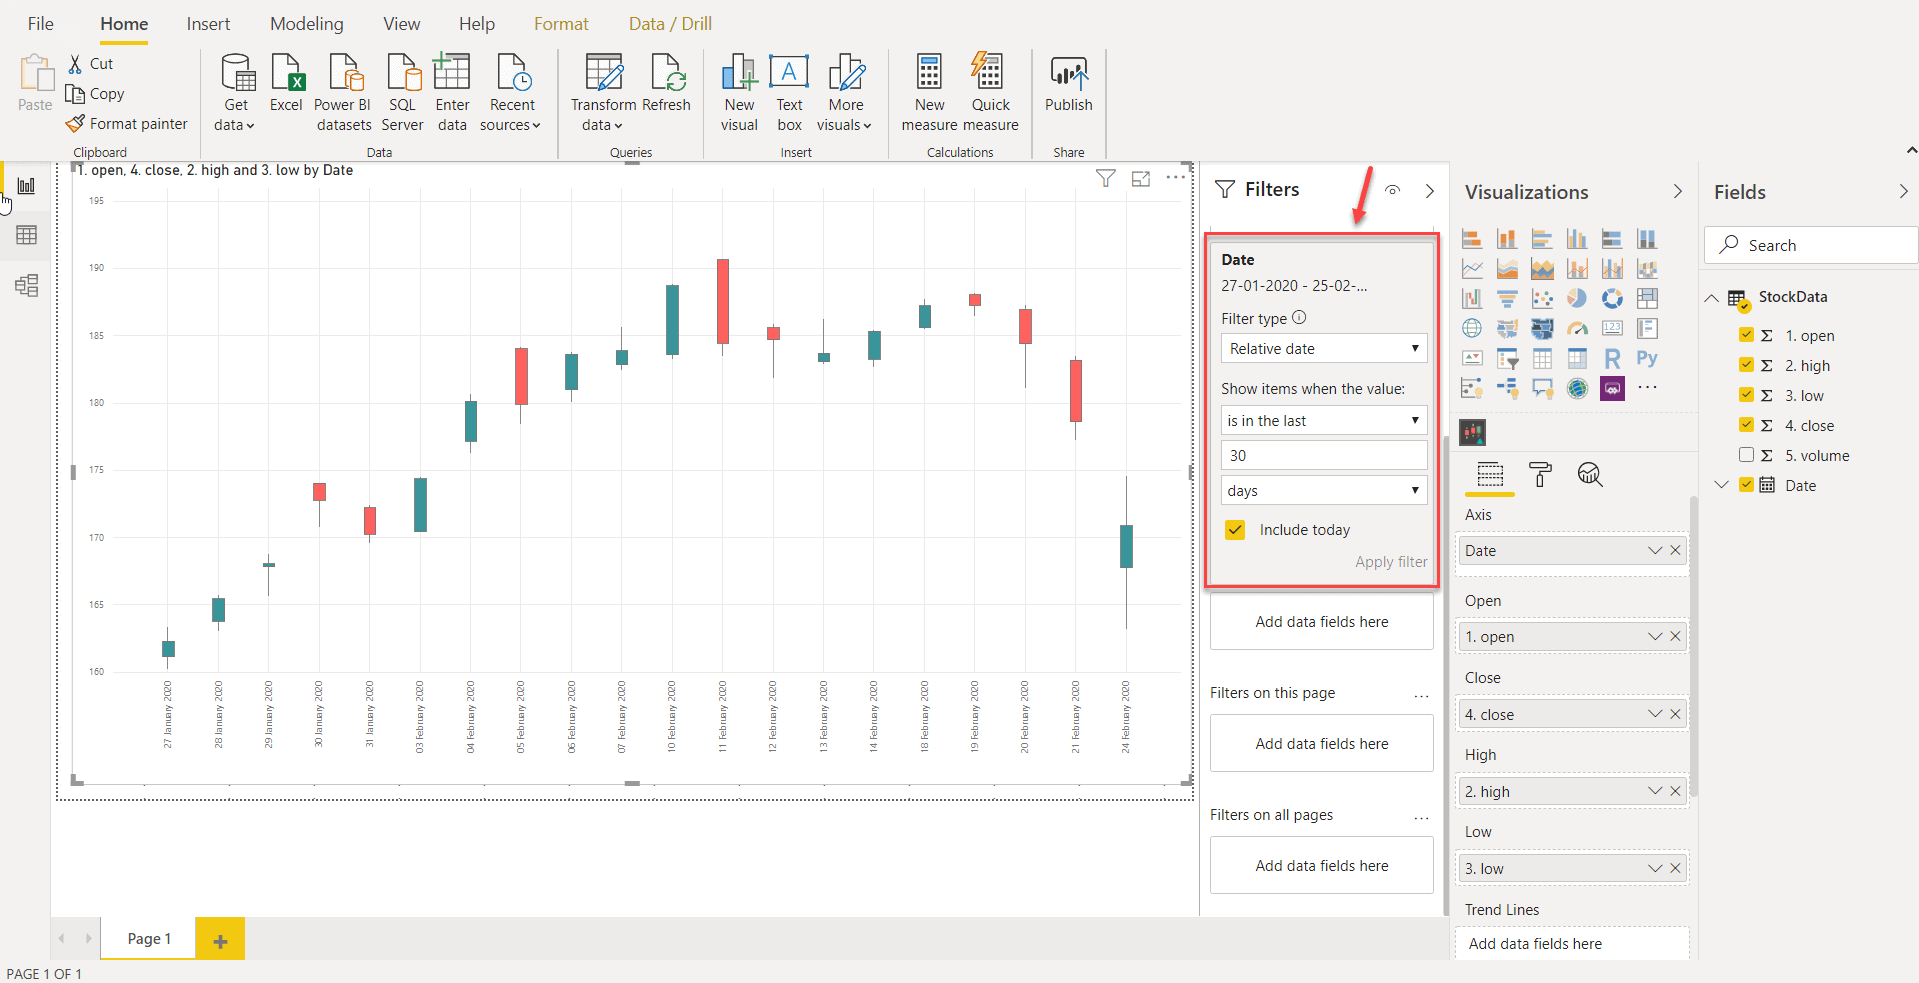
The final chart is now ready for analysis.
Conclusion
In this article, I have discussed how can we use Power BI to connect and fetch data from a web API using authentication. We have visualized the stock prices of Microsoft in the last 30 days. If you would like to fetch the same data for any other stock, you just need to change the value for the symbol in the source URL and refresh the dataset. For your reference, I have added the sample Power BI report here within. It is free to download and personal use.

