

Problem
A few weeks back, I got a request from a client of mine who had a very special requirement. They wanted to display values for a specific period in the past based on the selected dates in the Power BI report. Let us assume that if we select 30 June 2020, the report has to display data from 01 July 2019 until 30 June 2020, which is data for the last 12 months. Let me demonstrate the issue here.
Consider the following Power BI report. Now, if I select any date value from the slicer, the bar chart shows data only for that specific period. There is no way to tell the Power BI engine to calculate and display the sales for the last 12 months directly.
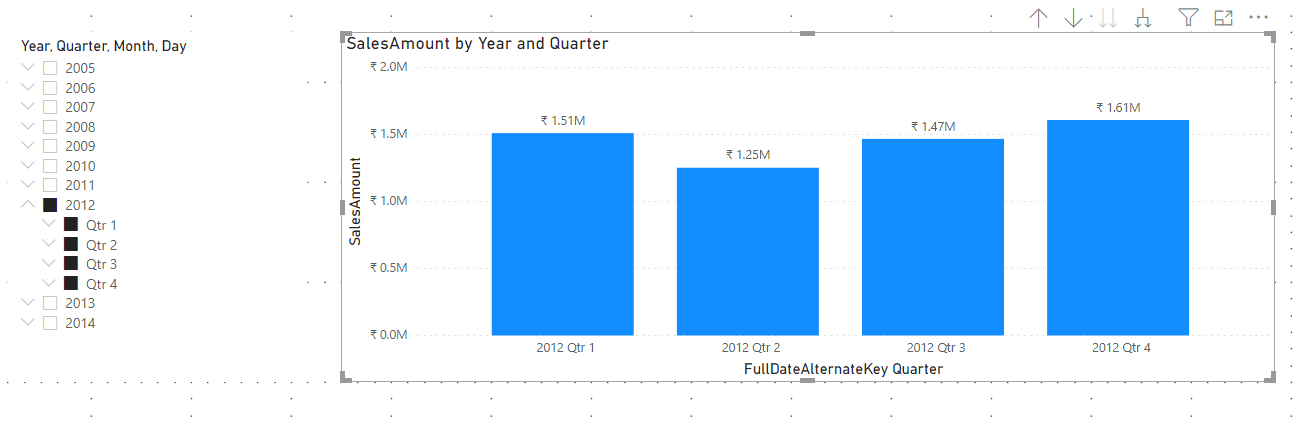
In the above picture, I have selected the year 2012 and the data is displayed only for the quarters that belong to the year 2012. Let us have a look at the data model to understand what's going on behind the scenes here.
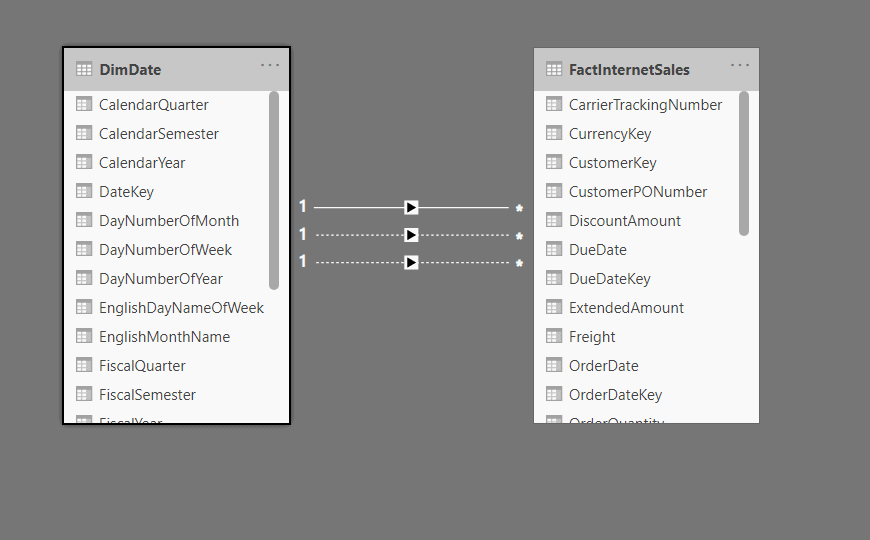
If you examine the above data model, you notice that there is a one-to-many relationship between the DimDate and the FactInternetSales tables. The column used to represent the join between these two columns is the DateKey. As we select the dates in the slicer, the exact dates are being filtered and the result is displayed in the bar chart.
Solution
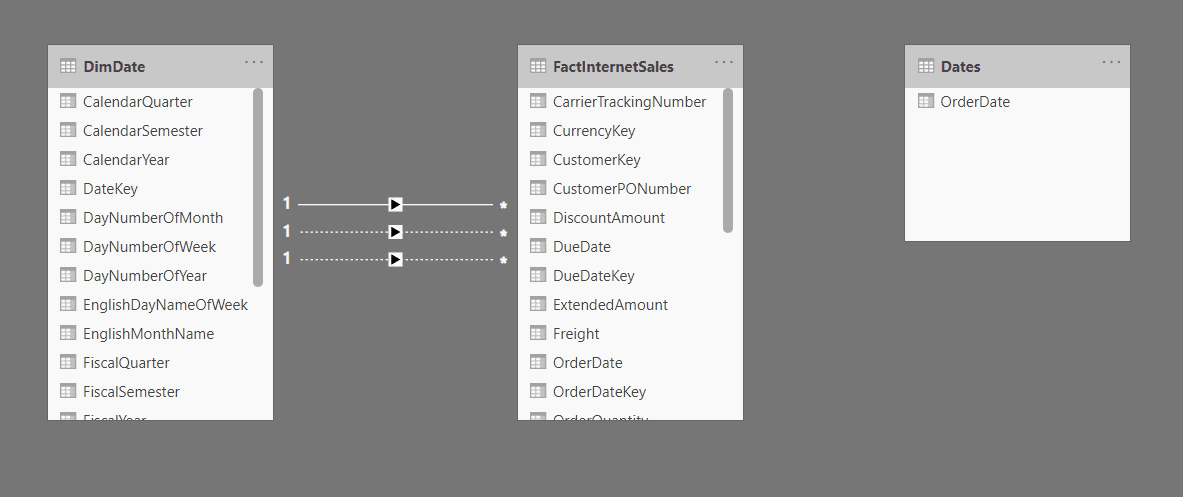
In order to override the default behavior of the Date slicer, we need to change the relationship between the date dimension and the fact table. We will continue using the same relationship between the DimDate and the FactInternetSales tables, but also create a new Dates table from the date values available in the FactInternetSales table. This new Dates table can be used as an independent date table, which will be disconnected from the FactInternetSales. This table will give us the time frame required for displaying the visuals on the Power BI report.
Let us now create the new table, Dates, from the FactInternetSales table. You can use the following formula to create this table.
Dates = DISTINCT(FactInternetSales[OrderDate])
As soon as you create the new table, you can see that a new disconnected Dates table is available in the Power BI Data model. An important point to note here is that this new table will hold all the distinct values from the fact table and should not connect to the fact table.
Now that our new table is ready, let us go ahead and create the new measure that will return us the SalesAmount for the dates that have been specified. Since in our case, we need to display data for the last 12 months, we will define the start date of the range as the selected date minus 12 months. You can use the following formula to create the new measure on the FactInternetSales table.
SalesAmount12Months =

    VAR MaxDate = MAX('Dates'[OrderDate])

    VAR MinDate = DATE(YEAR(MaxDate),MONTH(MaxDate)-12,DAY(MaxDate))

    VAR SalesAmt = CALCULATE(

        SUM(FactInternetSales[SalesAmount]),

        FILTER(

            FactInternetSales,

            FactInternetSales[OrderDate] >= MinDate && FactInternetSales[OrderDate] <= MaxDate

        )

    )

    RETURN SalesAmt
What we are trying to do is to create two date values from the slicer selection. One of these values will be the maximum date, which is the selected date. The second date will be a date that is 12 months behind the selected date. This will give us the time range required to filter the SalesAmount from the FactInternetSales table. Once we have both these date values with us, we then calculate the sales amount by filtering on the OrderDate field with the range of dates that we just created.
In the Power BI report, replace the slicer dates with the ones created from the new Dates table. Now when you select any date in the slicer, you can see that the visual displays relevant data for the last 12 months only. If there are no values selected for the slicer, the visual will display all the months that are available in the dataset.
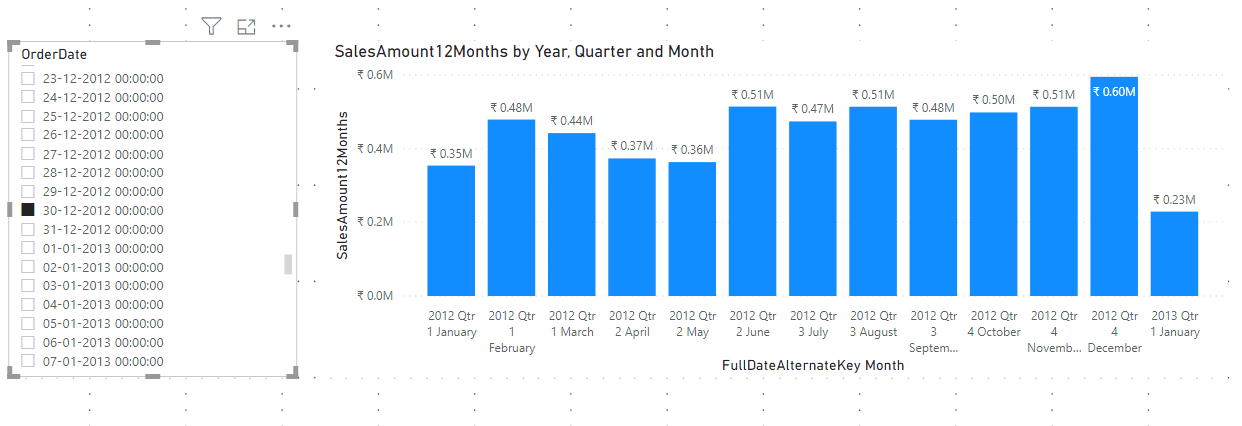
As you can see in the above figure, I have selected the date, 30-12-2012, and the visual displays all the months starting from 01-01-2020 until 01-01-2013, i.e. the last 12 months.
Takeaway
In this article, I have explained how to override the default behavior of the date filters by creating a custom measure and a date range to filter out the measure values and display on the visual which is based on the values selected.
