

Data Analyst Introduction
In this article, we are going to show the Data Analyst. This is a GPT included in ChatGPT. This component will help us to analyze and classify data easily.
In this article, we will show the following:
- First, we will learn how to clean data with AI.
- Secondly, we will show trends and charts using the Data Analyst.
- Thirdly, we will also use cluster algorithms without programming (the AI will program the code).
- Finally, we will use logistic regressions to analyze our data.
Requirements
First, you will need to register with ChatGPT. If you are not registered yet, read this article.
Secondly, we will need the paid version. In ChatGPT, go to View Plans.
 Activate the Data Analyst
We will need the paid version of ChatGPT for this GPT.
Finally, buy the Plus or the Pro version.
 ChatGPT Plus
The Data Analyzer
The paid version contains an option to Explore GPTs. Select that option.
 List of GPTs
Also, search for the Data Analyst created by ChatGPT and select it.
 GPT to analyze data
What is the Data Analyst?
It is an advanced GPT that can help you visualize, analyze, clean, and manipulate data. You can create charts, summarize, and create reports and presentations of your data.
In general, it helps to analyze your data and offer insights.
The data used
We will use a famous data set:

The Titanic was a British liner that sank in 1912. An iceberg damaged the liner, and it sank. We have the information of the dataset in the resources section. You can download it there (titanic.csv). The dataset contains the people who died, the passenger class, name, sex, and age. We also have siblings and spouse data, the fare passenger paid.
Plan to clean the data
In this section, I will ask ChatGPT and specifically the Data Analyst to clean the data.
Daniel: Can you clean data?
ChatGPT said:
Yes, I can help you clean the data! Let's start by loading and inspecting the dataset to see what kind of cleaning might be needed. I'll take a look at the first few rows and check for any obvious issues like missing values, duplicates, or incorrect data types.
I have loaded the Titanic dataset, and here are the first few columns:
- PassengerId: The unique ID of the passenger.
- Survived: Whether the passenger survived (1 = Yes, 0 = No).
- Pclass: The passenger's class (1, 2, or 3).
- Name: The name of the passenger.
- Sex: The gender of the passenger.
- Age: The age of the passenger (some values may be missing).
- SibSp: The number of siblings or spouses aboard.
- Parch: The number of parents or children aboard.
- Ticket: The ticket number.
- Fare: The fare the passenger paid for the ticket.
- Cabin: The cabin where the passenger stayed (many missing values).
- Embarked: The port where the passenger boarded (C = Cherbourg, Q = Queenstown, S = Southampton).
Clean data steps
ChatGPT:
To clean the data, I will:
Handle missing values (e.g., Age, Cabin, Embarked).
Handle duplicates, if any.
Check and fix data types if necessary.
Maybe create new features or remove unnecessary ones.
Would you like to proceed with this plan?
Daniel:
Sure, go ahead.
ChatGPT said:
Great! I'll go ahead and perform the data cleaning steps based on the plan.
Clean the data
Daniel: In this section, ChatGPT will show the plan and clean the data:
ChatGPT:
- Handle missing values:
- For Age, we can either fill missing values with the mean, median, or use more advanced imputation methods.
- For Cabin, since it has many missing values, we might want to drop it or fill it with a placeholder like "Unknown."
- For Embarked, we can fill missing values with the most common value (mode), since it represents the boarding port.
- Remove duplicates: I'll check if there are any duplicate rows.
- Check data types: Ensure that all columns have the correct data type for analysis.
Let's start cleaning!
Cleaned Titanic Dataset
ChatGPT:
| PassengerId | Survived | Pclass | |
|---|---|---|---|
| 140 | 141 | 0 | 3 |
| 141 | 142 | 1 | 3 |
| 142 | 143 | 1 | 3 |
| 143 | 144 | 0 | 3 |
I have cleaned the dataset by:
- Filling missing Age values with the median.
- Filling missing Embarked values with the most frequent value.
- Replacing missing Cabin values with "Unknown."
- Removing any duplicate rows.
- Ensuring that all columns have appropriate data types.
You can now inspect the cleaned dataset. If you have any further analysis or steps you'd like me to take, feel free to let me know!
Undo some data Filled using the Data Analyst
Daniel: I did not like that ChatGPT filled age values with the median. I also did not like that it filled in missing embarked values with the most frequent value. I will ask ChatGPT to fix that.
If there are missing values, just use NULL values; do not replace missing values with median or the most frequent values.
ChatGPT said:
Got it! We'll update the cleaning process to preserve missing values as NaN instead of filling them in. I'll revert the previous changes and just handle:
Removing duplicates.
Ensuring correct data types.
Keeping all missing values (NaN) as-is.
Let me clean it accordingly.
Cleaned Titanic Dataset (Missing Values Preserved)
Done! The dataset has been cleaned with the following approach:
No missing values were filled – all NaN values are preserved as-is.
Duplicates removed.
Data types corrected for analysis.
Let me know what you'd like to explore or analyze next!
Analyze the data with Data Analyst
Daniel: Now the data is cleaned. ChatGPT will let you download the clean CSV data. I will ask ChatGPT to analyze the data.
OK, can you analyze the data and show me some trends?
ChatGPT said:
Sure! Let's explore some trends and insights from the Titanic dataset. I'll start by performing a basic analysis of key features, including:
- Survival rate: How many passengers survived vs. didn't survive.
- Survival by gender: What were the survival rates for males vs. females?
- Survival by class: How did survival rates differ across different passenger classes (1st, 2nd, 3rd)?
- Age distribution: How does age correlate with survival rates?
- Fare distribution: Did passengers who paid higher fares have a higher survival rate?
I’ll provide insights for these trends and visualize the results for you. Let’s start with the analysis!
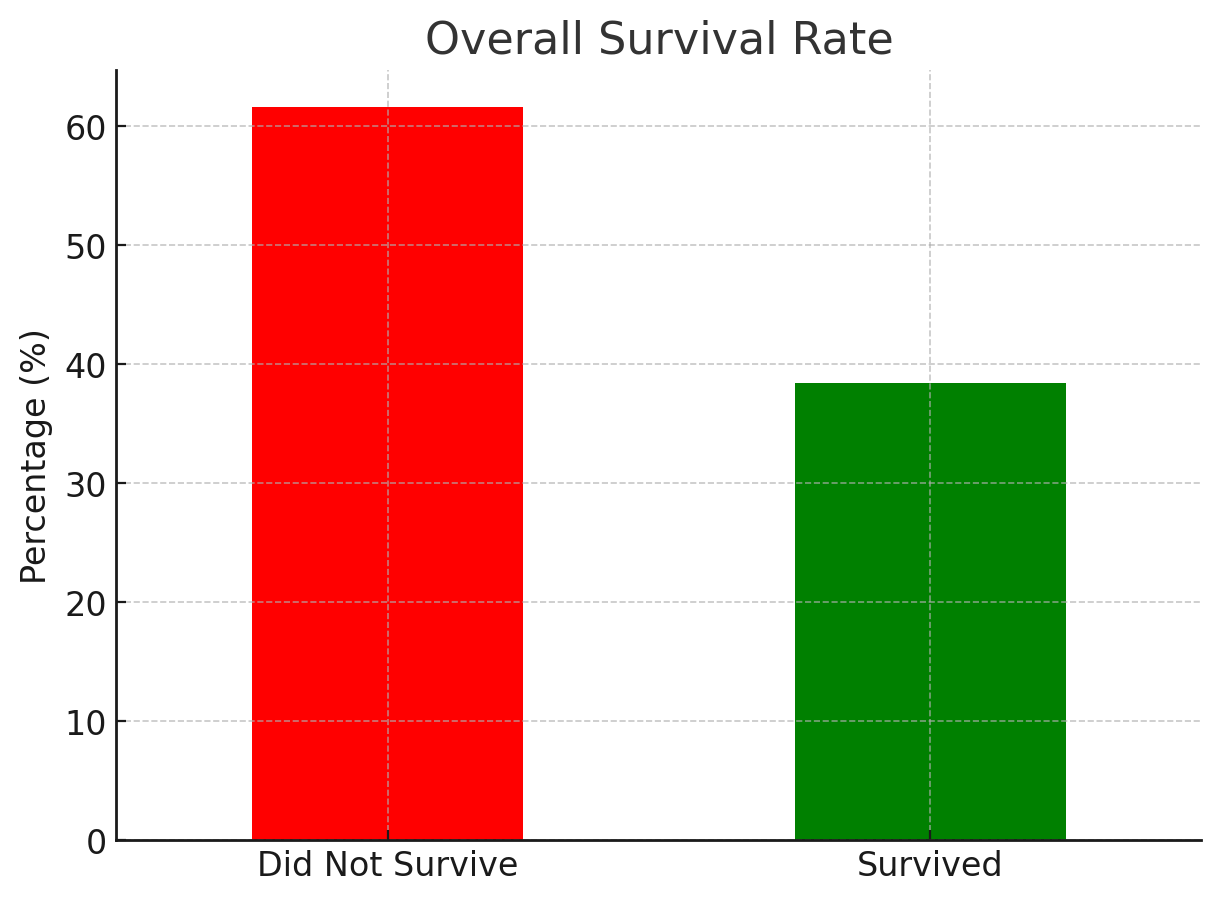
Overall Survival Rate
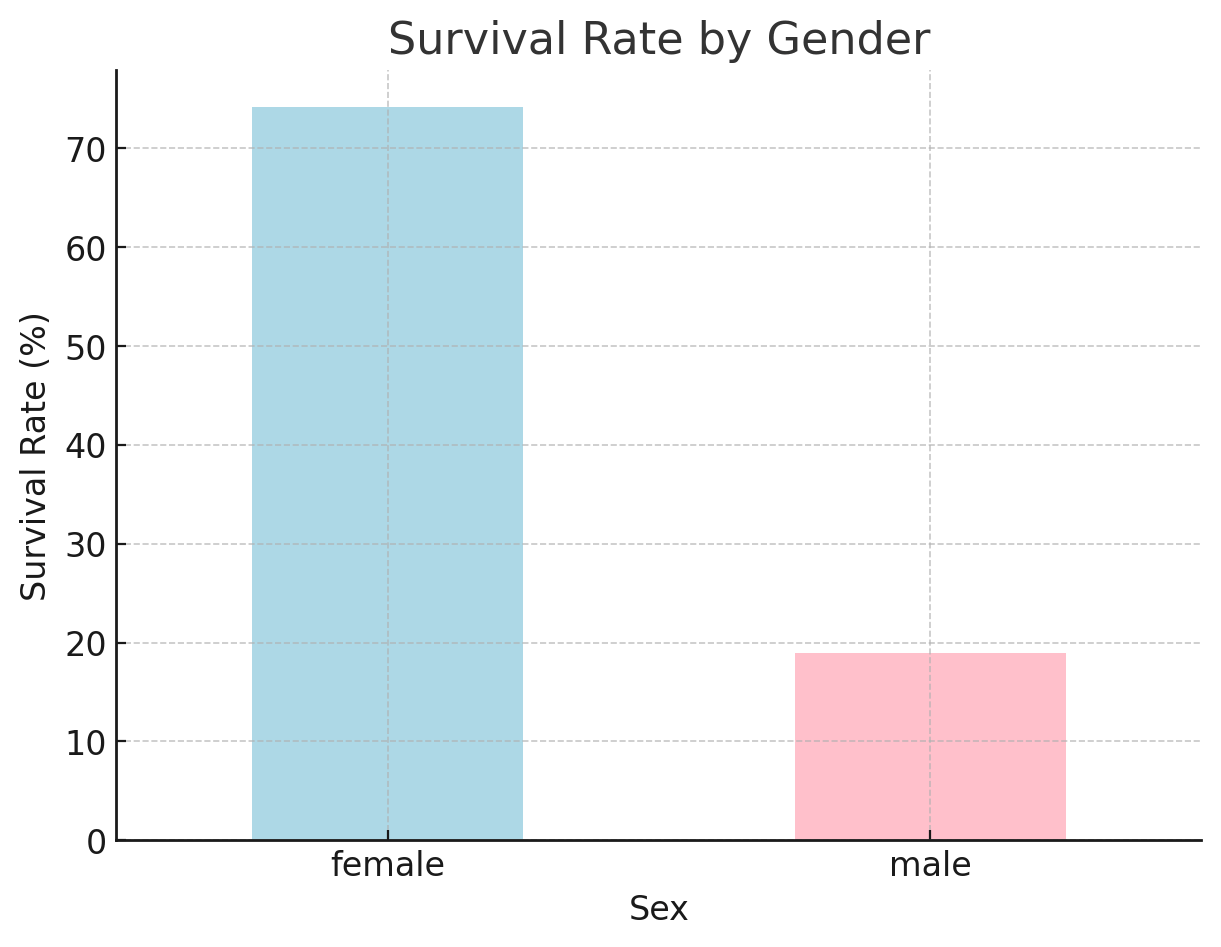
Survival Rate by Gender
 barchart created by data analyst in chatgpt
Survival Rate by Class
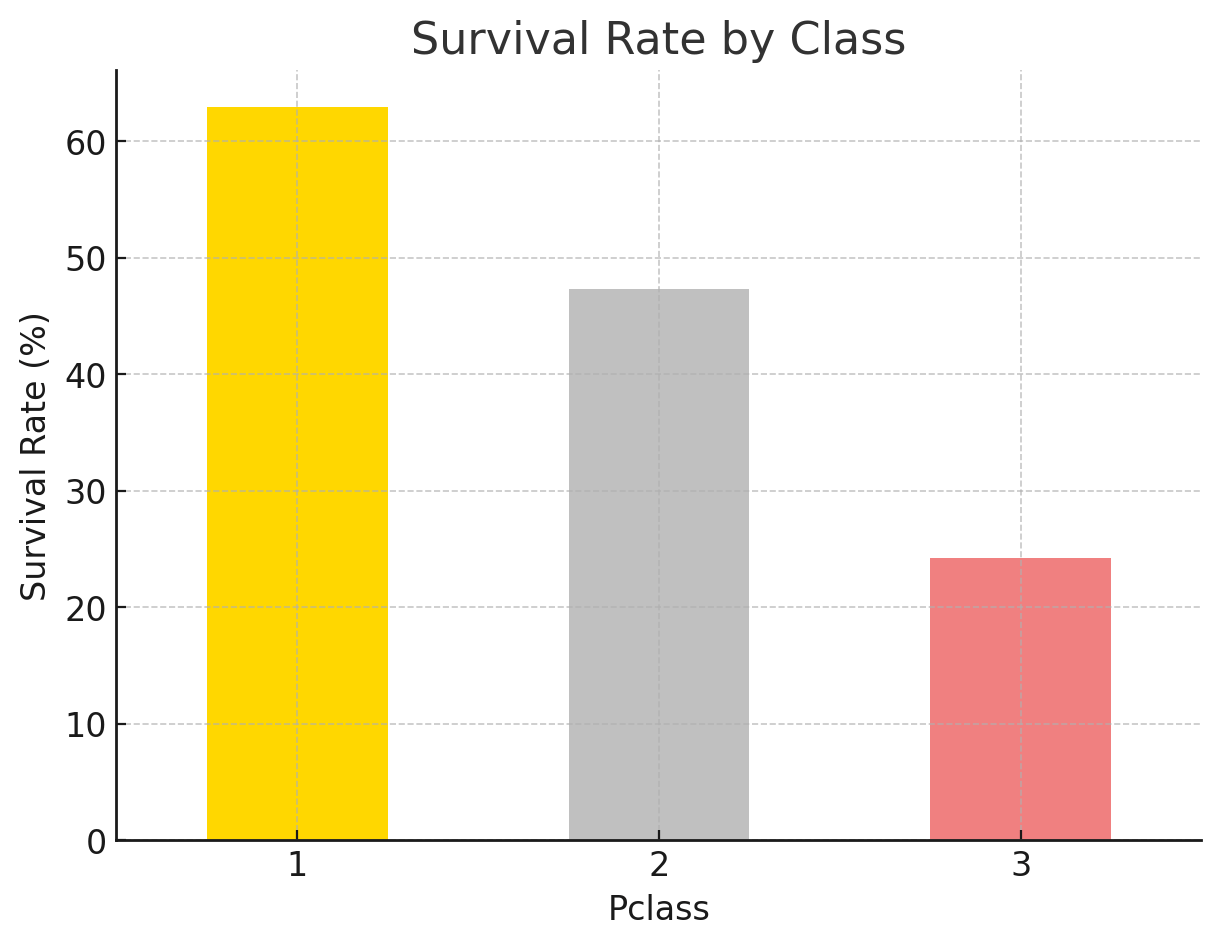 chart created by the data analyst
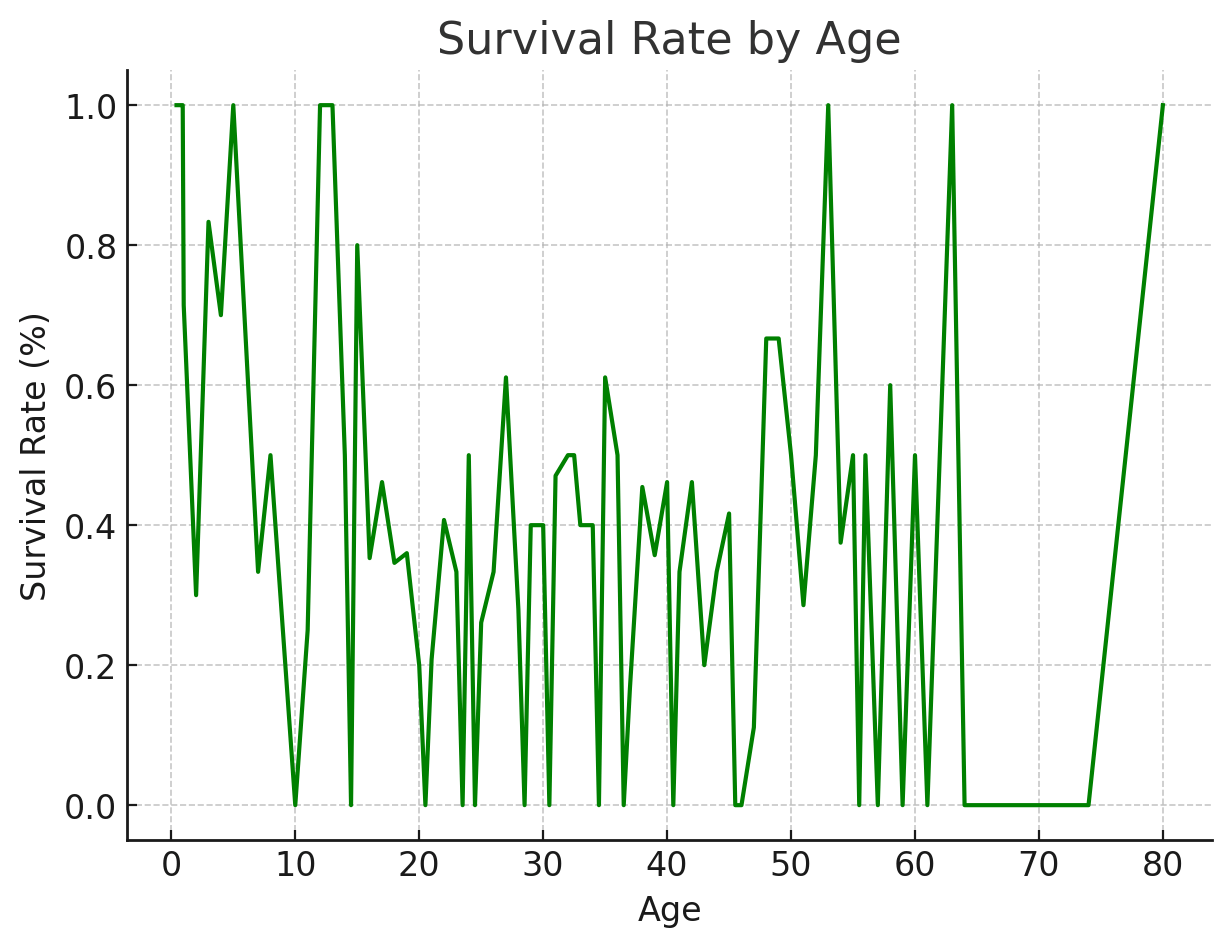
Survival Rate by Age
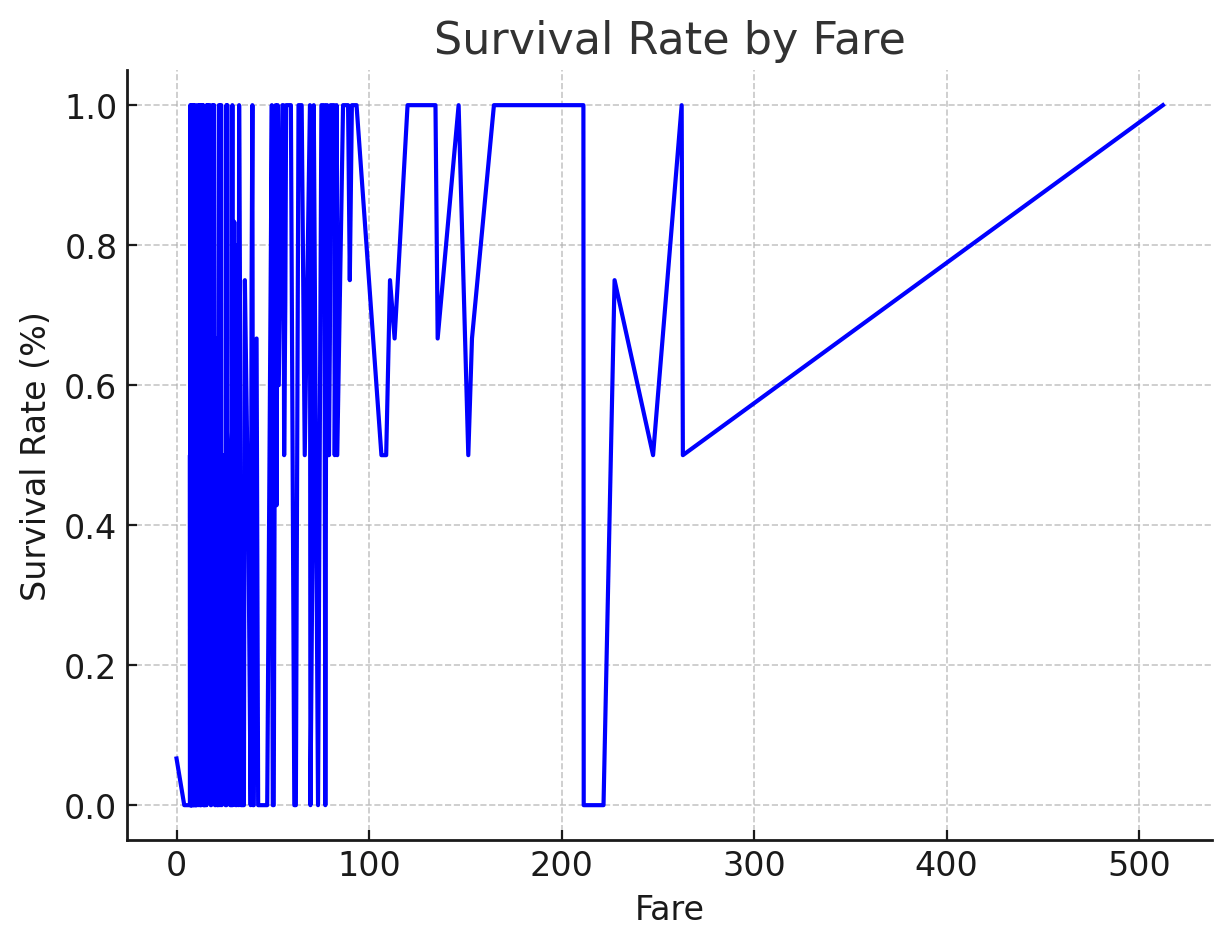
Survival Rate by Fare
Here are some insights from the analysis:
- Overall Survival Rate: The survival rate was about 38%. A majority of passengers did not survive.
- Survival by Gender: Females had a significantly higher survival rate compared to males. This is a clear trend where women were more likely to survive.
- Also, we have the Survival by Class: Passengers in 1st class had the highest survival rate, followed by 2nd class, and then 3rd class. This suggests that the wealthier passengers were more likely to survive.
- Survival by Age: The survival rate varied across different ages. Younger passengers (especially children) had a higher survival rate, while adults had a lower survival rate, which might reflect the prioritization of children during the evacuation.
- Survival by Fare: The survival rate seemed to increase slightly with higher fare prices, which is in line with the observation that wealthier passengers (1st class) had a better chance of survival.
These trends provide an interesting look into how different factors influenced survival on the Titanic. Let me know if you’d like further exploration or more detailed analysis!
Daniel: This is wonderful. ChatGPT provides several charts and also provides nice Insights. I will ask for specific data.
Bar chart of survivors by age
I will ask ChatGPT to create a bar chart of survivors by age.
Daniel: I want a bar chart of the survivors by age.
ChatGPT said:
Number of Survivors by Age
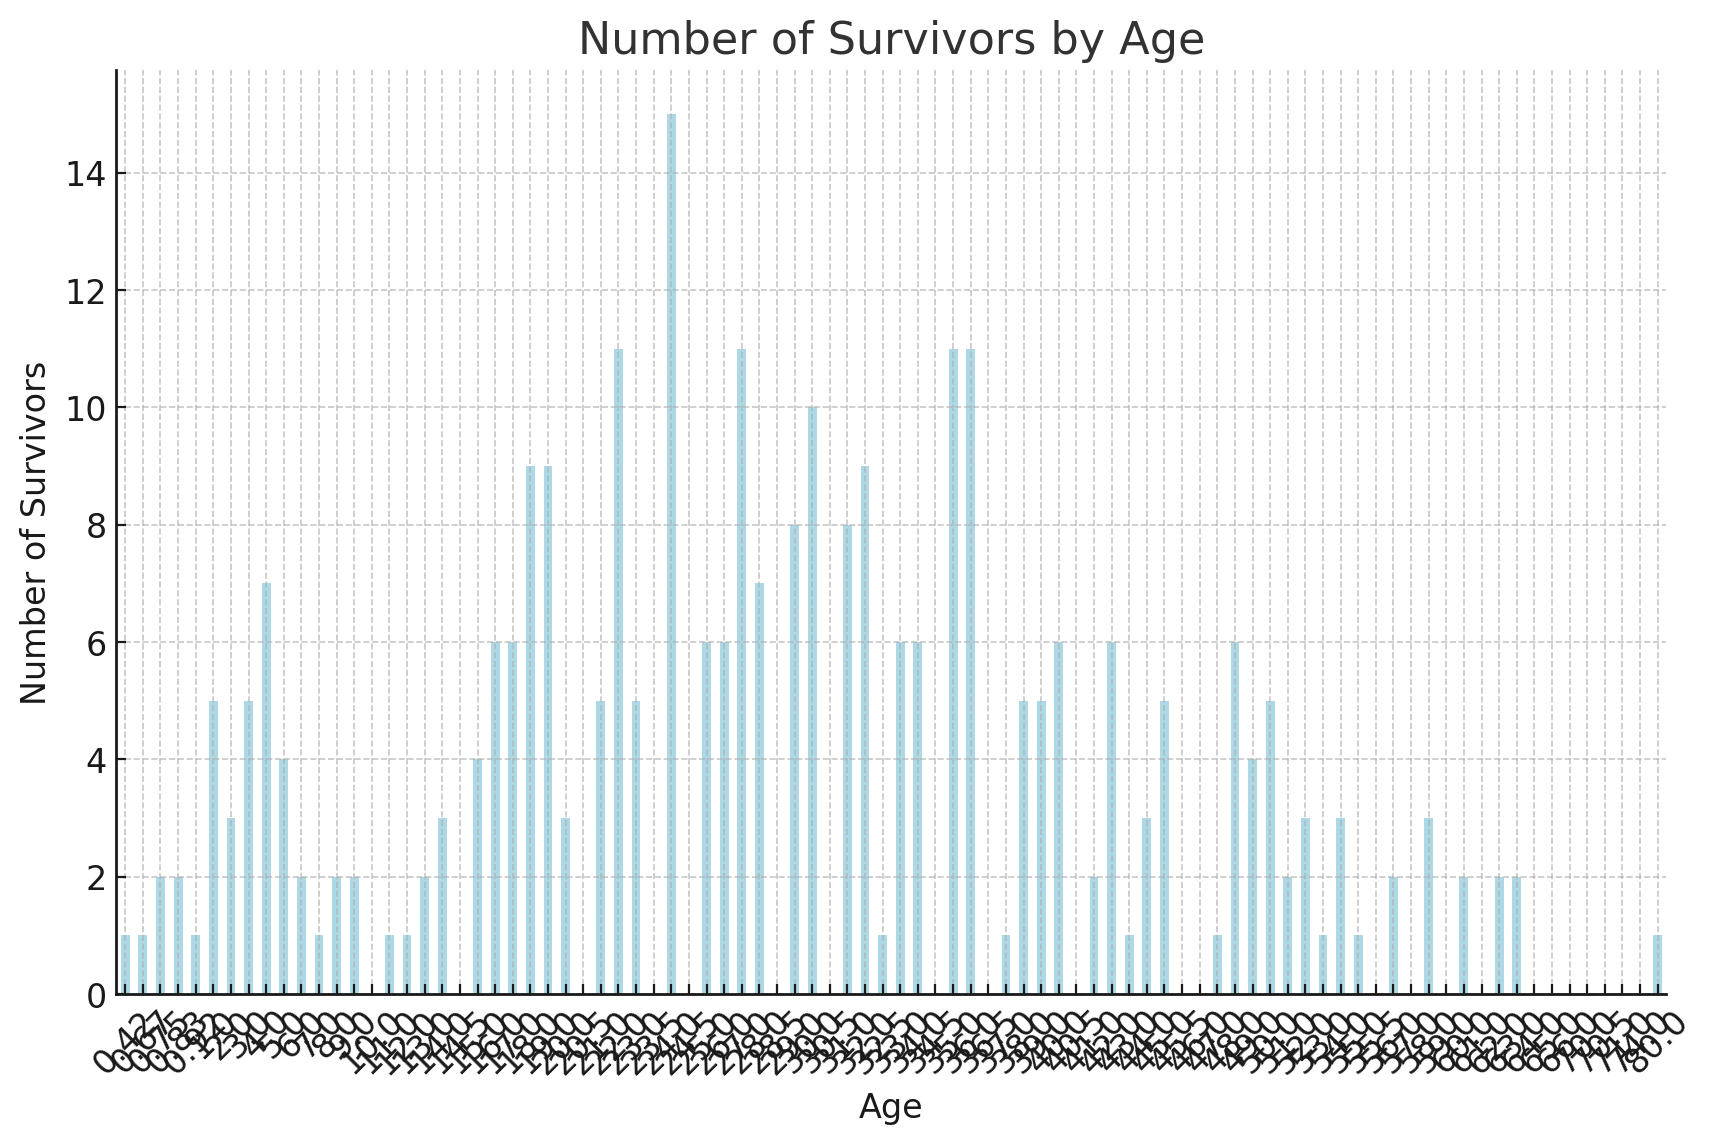
Here's the bar chart showing the number of survivors by age. It visualizes how survival was distributed across different ages. Younger passengers (especially children) appear to have a higher number of survivors, as expected. Let me know if you need further analysis or adjustments!
Daniel: This is OK, but it is not easy to read the data. I will ask ChatGPT to group the ages by decades.
Group by decades bar chart created in the Data Analyst
Daniel: Thanks. Can you group the ages by decades?
ChatGPT:
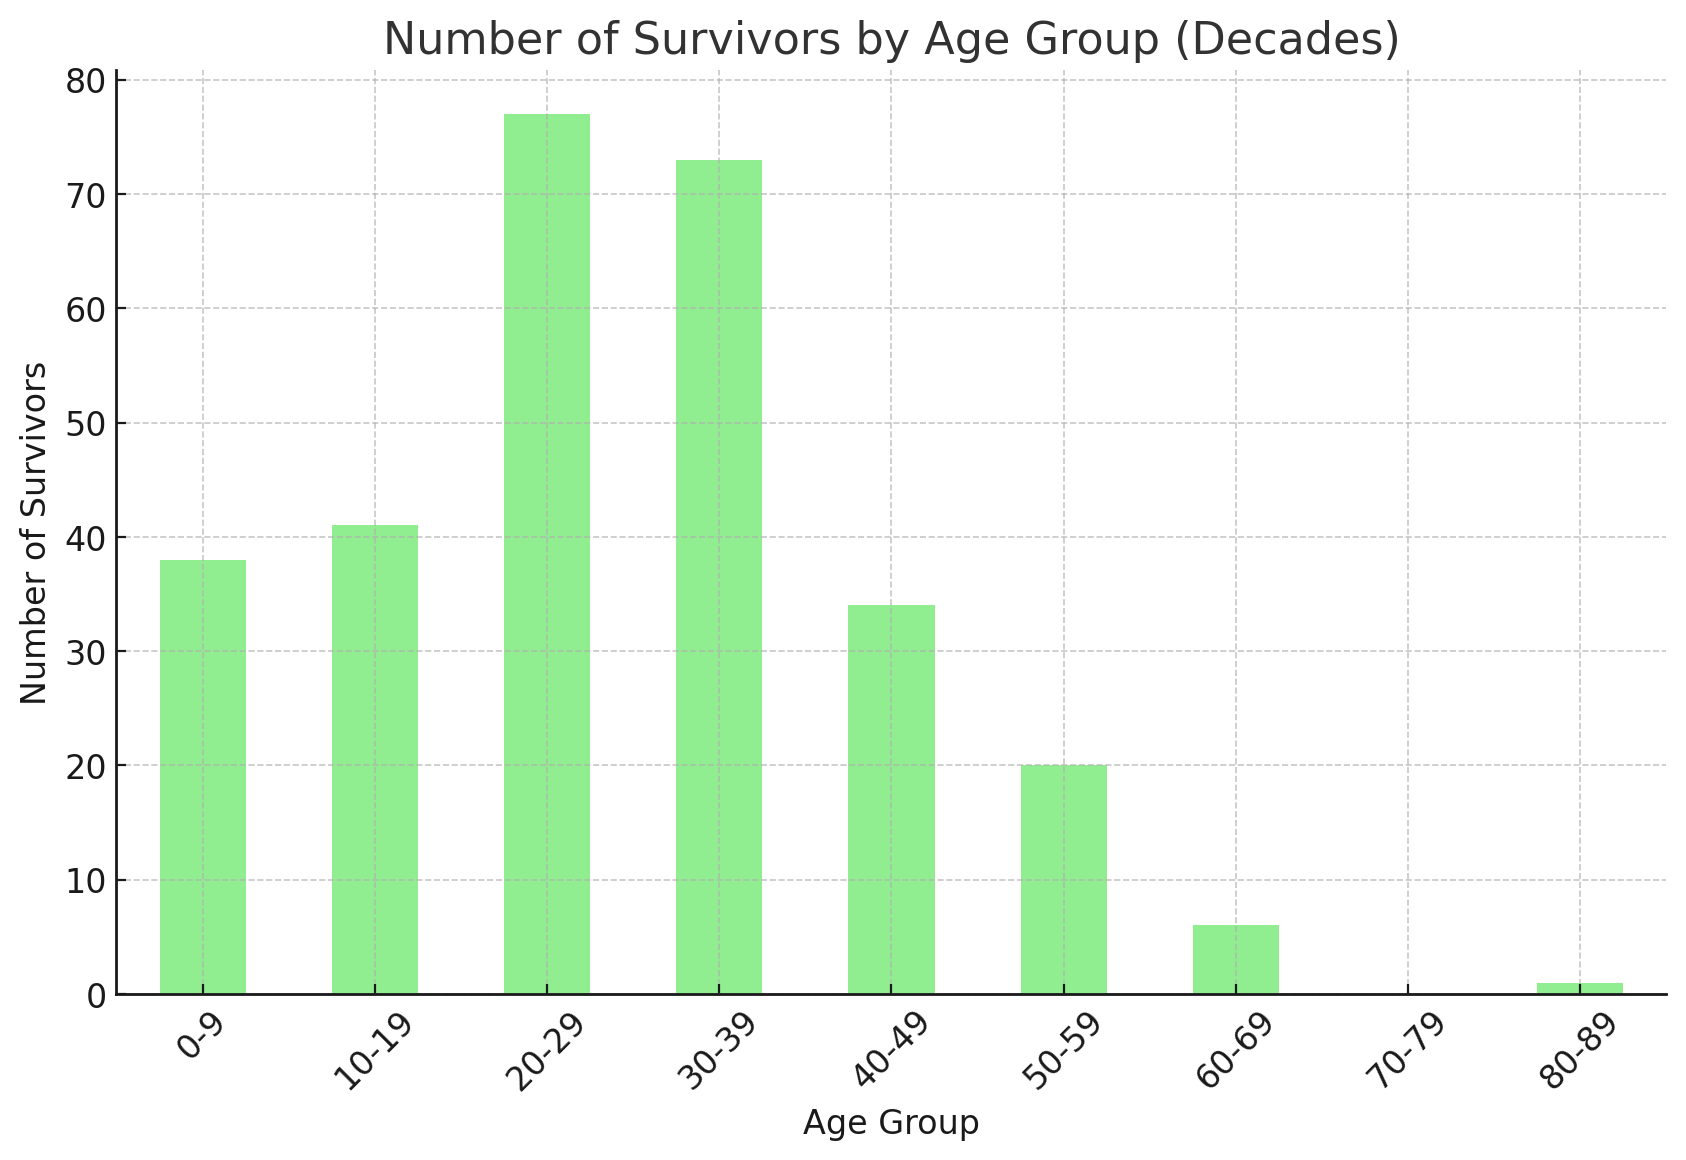
Here is the updated bar chart showing the number of survivors grouped by age decades. It gives a clearer view of survival distribution across age ranges, showing how different age groups fared in terms of survival. Let me know if you'd like any further modifications or analyses!
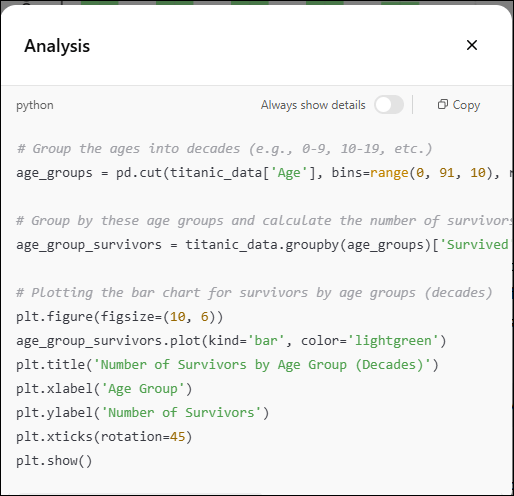
Daniel: Doing charts is a straightforward process now, fixing and rebuilding the chart is also easy now. Also, it has an option named View Analysis. Click on it.
You can now see the Python code used to clean data or, in this case, create a chart. Python is useful to use Data Analyst.
Number of Deaths by Age Group (Decades)
Daniel: I will ask you to show me the number of Deaths by Age Group.
ChatGPT, can you show me the number of deaths by age group (decades):
ChatGPT:
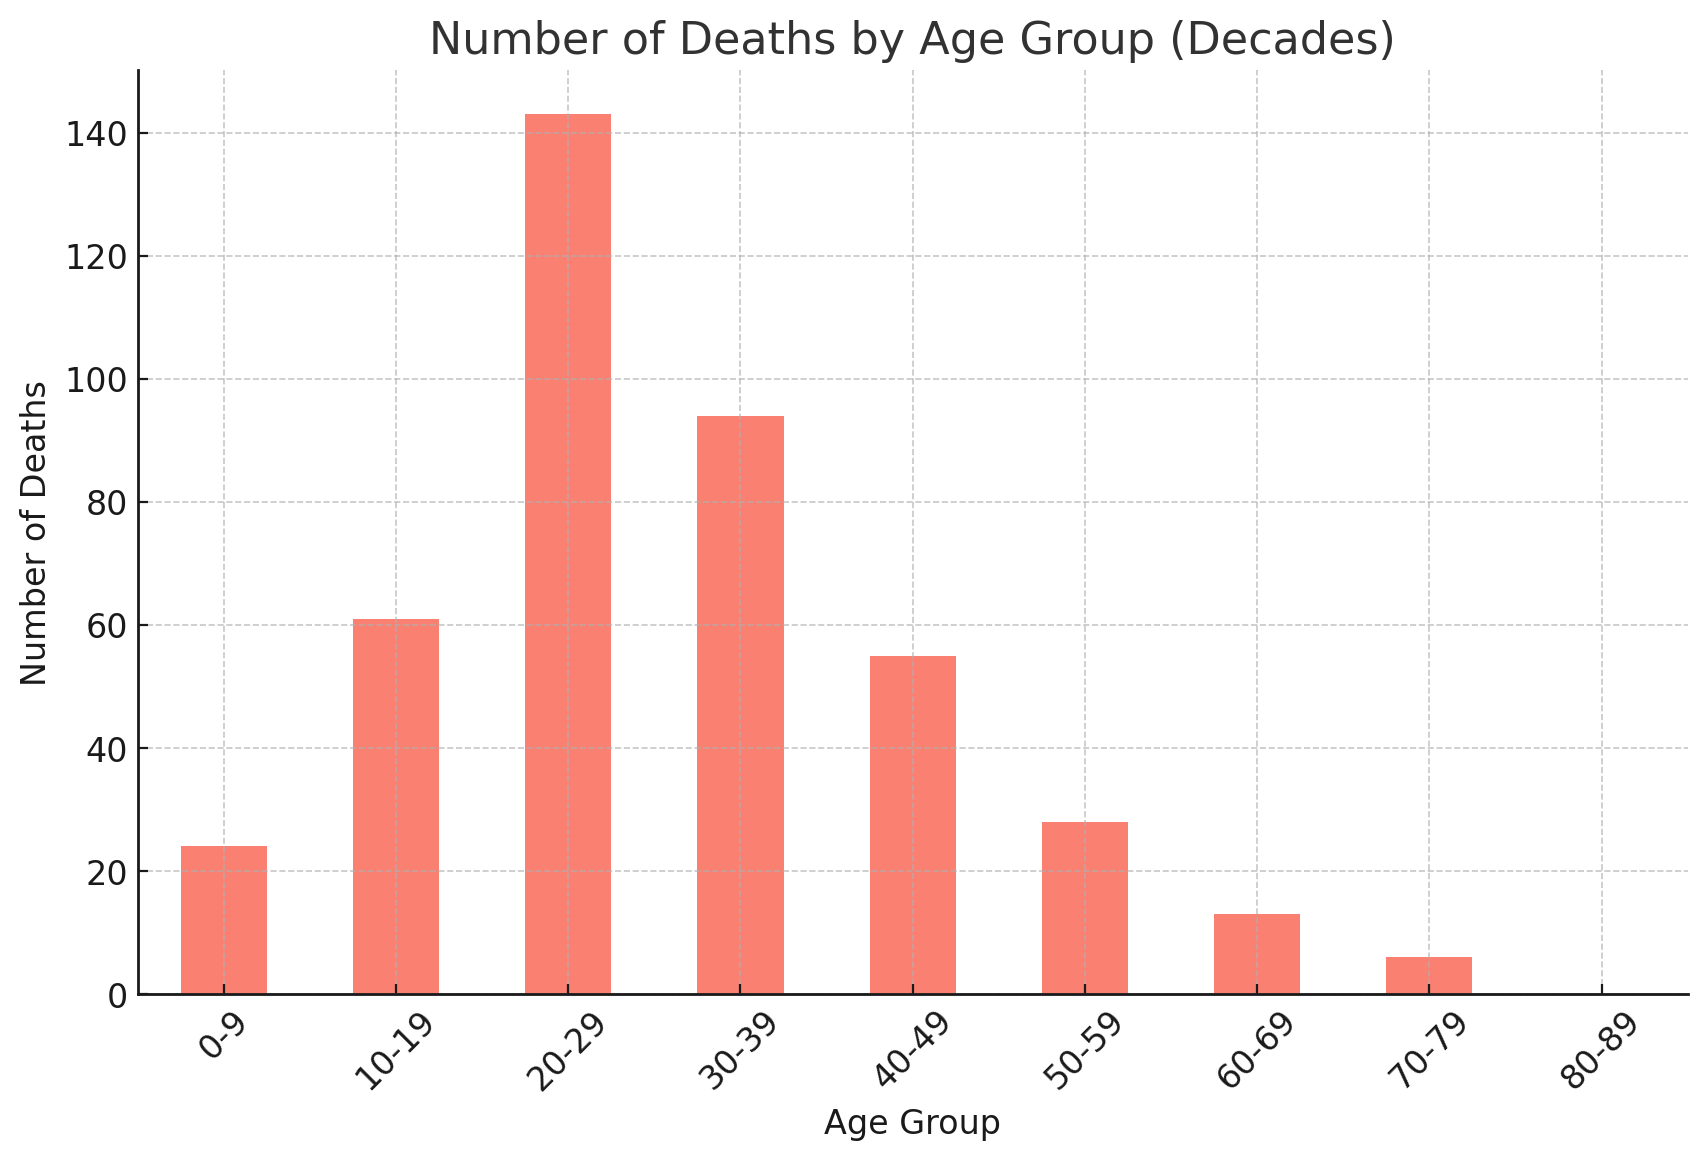 chart of titanic suvivors
Here is the bar chart showing the number of deaths by age group (decades) from the Titanic dataset. As you can see, the highest number of deaths occurred in the 20-29 age group, followed by the 30-39 age group.
If you'd like any further analysis or adjustments, feel free to ask!
Daniel: Most of the people who died were between 20 and 40 years old. Most of the people that survived were the same age as well.
Cluster the information to find patterns in the data with Data Analyst
The cluster algorithms are used in machine learning to group data in clusters. We can use cluster to find patterns. For more information about clusters, review our article about clusters here.
Daniel: Can you use cluster algorithms to show me the groups with less and more chances to survive on the Titanic?
ChatGPT said:
To perform a clustering analysis and show the groups with the highest and lowest chances to survive on the Titanic, we can use clustering algorithms such as K-Means or K-Medoids. These algorithms will group passengers based on their features (e.g., age, sex, class, etc.) and survival rate. After clustering, we can analyze which groups tend to have higher survival rates and which groups have lower survival rates.
I'll follow these steps:
- Preprocessing: Convert categorical variables (like gender and embarked) into numeric values and scale the numerical features.
- Clustering: Use a clustering algorithm to segment the passengers.
- Analysis: Identify which clusters correspond to higher and lower survival rates.
K-Means
ChatGPT:
Let's start with clustering using the K-Means algorithm and analyze the results.
It seems that there are still missing values (NaNs) in the dataset, which is causing the K-Means algorithm to fail. I will handle these missing values by either filling them or dropping the rows with missing values before running the clustering algorithm again.
Let me proceed by filling the missing values for the clustering process and then perform the clustering.
It appears there are still some missing values causing the error. To ensure the K-Means algorithm works, I will check for any missing values in the dataset and remove or impute them properly.
Let me clean the dataset and re-run the clustering process.
The clustering analysis results show the following survival rates for the three clusters:
- First, we have Cluster 0: 25.39% survival rate
- Secondly, Cluster 1: 58.90% survival rate
- Cluster 2: 50.35% survival rate
It appears that Cluster 1 has the highest survival rate, while Cluster 0 has the lowest survival rate. This suggests that passengers in Cluster 1 had better chances of survival compared to those in Cluster 0.
If you'd like to explore the characteristics of these clusters in more detail or analyze other aspects of the data, feel free to ask!
Find patterns with Data Analyst
Daniel: Can you write the characteristics in common of each cluster?
ChatGPT said:
Cluster Characteristics
| SibSp | Parch | Fare | Embarked |
|---|---|---|---|
| 0.39 | 0.28 | 77.85 | 1.17 |
| 0.2 | 0.06 | 12.1 | 1.64 |
| 1.96 | 1.78 | 38.61 | 1.74 |
Here’s a summary of the common characteristics for each cluster:
🟢 Cluster 0 – Highest Survival Rate (62.04%)
- Class: Mostly 1st class
- Sex: More females (Sex ≈ 0.56; 0=female, 1=male)
- Age: Average age around 39
- Fare: High fares (≈ 78), suggesting wealthier passengers
- Family: Generally traveling with few relatives
📝 Likely profile: Wealthy adult women in 1st class
🔴 Cluster 1 – Lowest Survival Rate (25.98%)
- Class: Mostly 3rd class
- Sex: Predominantly males (Sex ≈ 0.76)
- Age: Average age around 29
- Fare: Low fares (≈ 12)
- Family: Mostly alone or with very few family members
📝 Likely profile: Young men in 3rd class traveling alone
🟡 Cluster 2 – Moderate Survival Rate (49.29%)
- Class: Mixed, leaning toward 2nd/3rd class
- Sex: More females (Sex ≈ 0.36)
- Age: Younger passengers (average age ≈ 17.5)
- Family: Large family groups (SibSp ≈ 2, Parch ≈ 1.8)
- Fare: Moderate (≈ 38)
📝 Likely profile: Younger passengers (possibly children/teens) traveling with family
Daniel: This is amazing. With a few prompts, I can find the group with a lower survival rate. Basically, the 3rd class passengers of the Titanic and males with an average age equal to 29 had the lowest survival rate.
On the other hand, cluster 0 contains the people with higher survival rates. Females of the first class older than 39 with high fares had the best survival rates.
Neural network algorithm
This time, I will ask the Data Analyzer to use neural networks. The neural network is an algorithm inspired in the human brain. It can also be used to find patterns like we did with the cluster algorithm. For more information about neural networks, visit or link related.
Daniel: Can you do a similar analysis using Neural Network?
ChatGPT said:
Absolutely! We can use a neural network for a classification task — predicting survival — and then analyze the network’s predictions to see how it distinguishes different types of passengers.
Here’s the plan:
🔍 Neural Network Analysis Steps:
- Prepare the data: Use the same cleaned, encoded, and scaled dataset.
- Train a Neural Network to classify passengers as survived (1) or not (0).
- Evaluate performance: Accuracy, precision, recall, etc.
- Analyze predictions: Segment passengers by prediction probabilities and describe characteristics of groups with:
- High predicted survival
- Low predicted survival
Ready? Let's start by training a simple neural network.
It looks like TensorFlow isn't available in this environment, so I can't run a neural network here directly. But no worries — we can still simulate a similar effect using a more interpretable machine learning model like logistic regression or random forest, which also gives probabilities and feature importance.
Would you like to:
- ✅ Proceed with Logistic Regression (still gives probabilities and interpretable),
- 🌲 Try Random Forest (strong performance, good for understanding group predictions), or
- ⚙️ Export the preprocessed data so you can train a neural network on your own machine?
Let me know your preference
Daniel: This is important. There are some algorithms not available in ChatGPT like TensoFlow. ChatGPT and Data Analyzer still have some limitations. These limitations may change in the future.
Logical Regression
Daniel: OK, let's try Logistic Regression.
ChatGPT said:
Ah, right — the train-test split variables (X_train, y_train, etc.) were created in the earlier neural network step, but that code didn't run due to the TensorFlow error.
Let me re-split the data and continue with logistic regression properly.
Logistic Regression Classification Report
ChatGPT said:
| precision | recall | f1-score | |
|---|---|---|---|
| 0.0 | 0.8256880733944955 | 0.8571428571428571 | 0.8411214953271028 |
| 1.0 | 0.7857142857142857 | 0.7432432432432432 | 0.7638888888888888 |
| accuracy | 0.8100558659217877 | 0.8100558659217877 | 0.8100558659217877 |
| macro avg | 0.8057011795543906 | 0.8001930501930501 | 0.8025051921079958 |
| weighted avg | 0.8091625969233472 | 0.8100558659217877 | 0.8091929317716401 |
The logistic regression model performs quite well:
- Accuracy: ~81%
- Precision/Recall:
- Survived = 1 (positive class): 78.6% precision, 74.3% recall
- Survived = 0: 82.6% precision, 85.7% recall
Now, let’s break down the predictions by probability levels to understand what characteristics are common among passengers with:
- High predicted survival probability
- Low predicted survival probability
I’ll classify them into:
- High chance (> 0.75)
- Medium chance (0.5 – 0.75)
- Low chance (< 0.5)
Then I’ll summarize each group’s typical features. Let’s go!
Summary made by the Data Analyst
Survival Probability Group Characteristics
| Prob_Group | Survived | Pclass | Sex |
|---|---|---|---|
| Low | 0.17 | 2.44 | 0.94 |
| Medium | 0.6 | 2.37 | 0.23 |
| High | 0.92 | 1.52 | 0.0 |
Here’s what the logistic regression model sees in different survival probability groups:
🟥 Low Survival Probability (< 50%)
- Actual Survival Rate: 17%
- Class: Mostly 3rd class (Pclass ≈ 2.44)
- Sex: Predominantly male (Sex ≈ 0.94)
- Age: Average around 32
- Fare: Low (≈ 19.50)
- Embarked: Mostly from S or Q (encoded ~1.6)
📝 Profile: Males in 3rd class, often traveling alone, low fare.
🟡 Medium Probability (50–75%)
- Actual Survival Rate: 60%
- Class: Mix of 2nd and 3rd
- Sex: Mostly female (Sex ≈ 0.23)
- Fare: Moderate (≈ 30.45)
- Age: Around 28
📝 Profile: Mixed group, leaning female, slightly better-off passengers.
🟢 High Survival Probability (> 75%)
- Actual Survival Rate: 92%
- Class: Mostly 1st and 2nd class (Pclass ≈ 1.52)
- Sex: Nearly all female (Sex = 0.00)
- Fare: High (≈ 61.34)
- Age: Younger (≈ 28)
- Traveling: Often with family (SibSp & Parch both ~0.5)
📝 Profile: Wealthy young women in 1st/2nd class with family
Daniel: The analysis of the logistic regression is similar. Male people of 3rd class with 32 years on average is the group with lower survival probability. Women and children went first (especially if they were 1st class).
On the other hand, the females from the 1st and 2nd classes with Fare high had the best chances to survive.
Conclusion about the Data Analyst
As you can see, ChatGPT and the Data Analyst can analyze and find trends in the information. It can generate Python code that you can reuse and modify. Also, it can create charts and apply machine learning algorithms.
Note that some algorithms are not currently available. This may change in the future.