

Executive Summary
Artificial intelligence is transforming businesses across the world. There are several tools and technologies to realize the benefits of AI efficiently and effectively. However, one software package that most organizations already have is Microsoft Power BI. Artificial Intelligence in Power BI comes with both functional and visual capabilities.
Power BI is part of the Microsoft Power Platform. It has several software services, connectors, and apps. Together, they collaborate to provide interactive visualization and dashboarding capabilities. Power BI allows users to ingest data from almost any source, transform that data, and finally, visualize and slice & dice as needed. The final Power BI reports can be shared online or via Power BI Mobile apps. One of the more advanced features of Power BI is its unique AI capabilities.
Gartner defines Artificial intelligence (AI) as advanced analysis and logic-based techniques, including machine learning, to interpret events, support and automate decisions, and take actions. AI is an emerging means to make better decisions and improve the process. The current landscape of analytics mainly harnesses meaningful information from structured data. However, Enterprises have a lot of unstructured and semi-structured data, such as notes, comments, etc., that can be used with AI capability to get a better insight. As per Gartner, the business value of AI will reach $5.1 billion by 2025.
This article provides an overview of Artificial Intelligence features available within Power BI. It explains, at a high level, what these features do, and then through an AI-enabled report, it shows one of the features in action.
Artificial Intelligence Features in Power BI
There are mainly four AI features, as indicated in the graphic below:
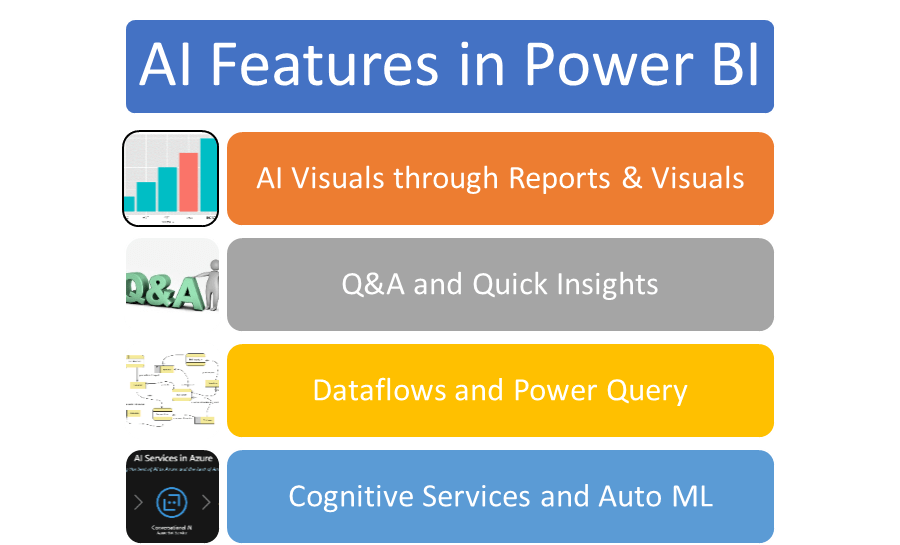
- Reports & Visuals - The AI Visuals provide Key Influencers and a Decomposition Tree analysis. The Key Influencer capability of Power BI helps in understanding the factors that are affecting a specific metric. The Decomposition Tree analysis capability lets you slice and dice the data into different dimensions so that data can be viewed across multiple dimensions.
- Q&A (Question and Answers) and Quick Insights - They are the state-of-the-art capabilities of Power BI. They are one of the competitive advantages over other competing vendors. Power BI's Questions & Answers and quick insight capability lets you explore natural language processing by performing semi-structured data exploration. It enables asking questions in natural language and provides answers in natural language.
- Dataflows and Power Query - These capabilities are used as a tunnel during data preparation that extracts, transforms, and loads data into Power BI. Power Query comes with a GUI (Power Query Editor user interface) used to transform and prepare data for further data modeling. Two Power Queries are available in Power BI - Power Query Online and Power Query for Desktop. The Power BI Query online is used for integrations within the Power platform and Power BI Dataflows. The Power Query for Desktop is used for integration within Power BI Desktop.
- Cognitive Services and Auto ML - Cognitive services can be used for Sentiment analysis, Image Tagging, and Key Phrase Extraction using unstructured data. Auto ML refers to Automated Machine Learning. This capability allows users to enable machine learning models by creating, training, and invoking ML models. Power BI lets you perform all the Machine learning activities right within itself. It is like a Low-Code-No-Code platform that allows a Citizens developer to build a machine learning model. Please note that you need Power BI Premium for this capability.
Access AI-enabled report from PowerBI.com
Microsoft has provided a sample for Artificial Intelligence in Power BI with a prebuilt AI report. We will use this report to learn the AI features in Power BI.
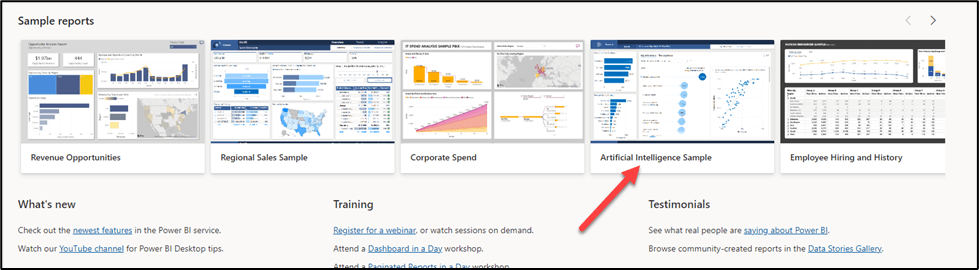
As a first step, you need to go to https://app.powerbi.com/ and then sign in with your credentials. On this page, you can create a free Microsoft account and sign on to that page if you are not already registered. Once successfully logged in, you must click on “learn” in the navigation pane. This is the lower left highlighted icon in the image below. 
In the Sample reports, select “Artificial Intelligence Sample.”
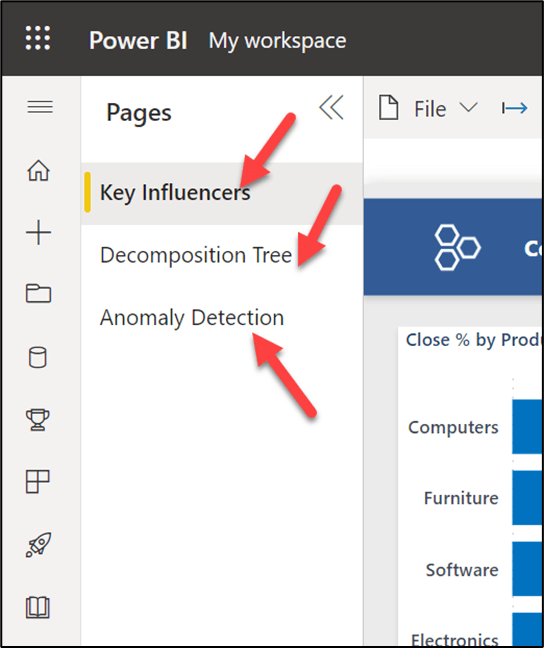
Power BI will automatically open the Artificial Intelligence report. You will see the report as shown below with three pages.
- Key Influencers
- Decomposition Tree and
- Anomaly Detection
These are shown in the pages blade in the workspace.
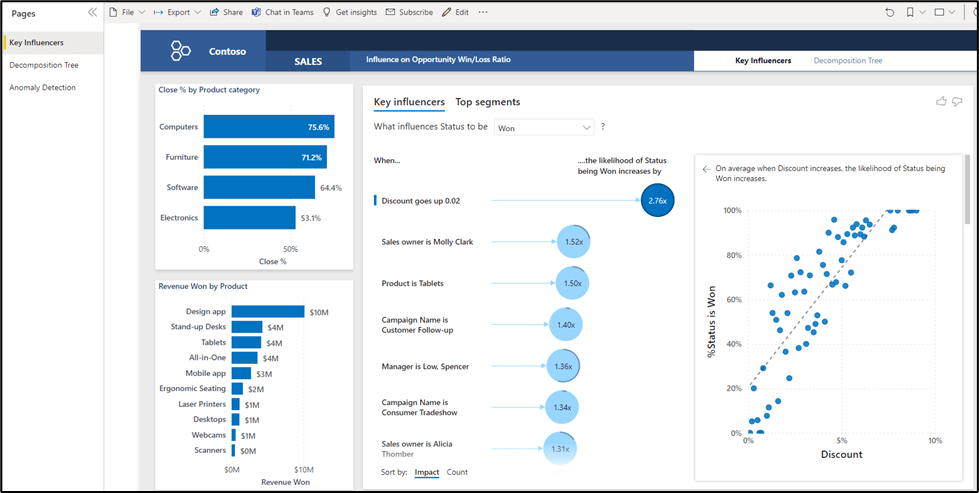
Finally, your complete report should look like the one displayed below:
Artificial Intelligence Exploration to Find the Top Contributors for Wins and Losses
We will stay on the “Key Influencers” page to find the leading contributors for wins and losses. This is the default page that the report opens with. Key Influencers is the first AI visualization in Power BI. This was first made public in 2019 and has undergone several improvements. This feature helps us analyze the driver behind a condition or a trend.
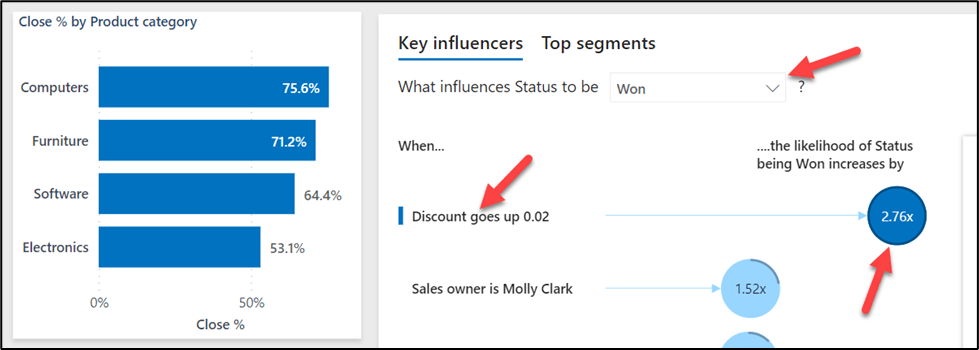
This report contains details about Product category, Revenue won by Product, and Key Influencers. The Power BI AI feature generated insights by looking at all the data to determine the factors with the highest impact. By default, you will notice the drop down after "What influences status to be" is Won. This indicates what the factors for the status to be Won are. The top two factors are as follows:
- When the Discount goes up by 0.02 (i.e., 2%), the likelihood of status being won increases by 2.76 times
- When the Sales owner is Molly Clark, the likelihood of Status being Won increases by 1.52 times
From the report’s stacked bar chart on its left, select the Software under Close % by Product Category. Power BI will generate new insights based on this selection. As a result, for Software, when the Sales Owner is Molly Clark, the likelihood of Status being Won increases by 1.60 times.
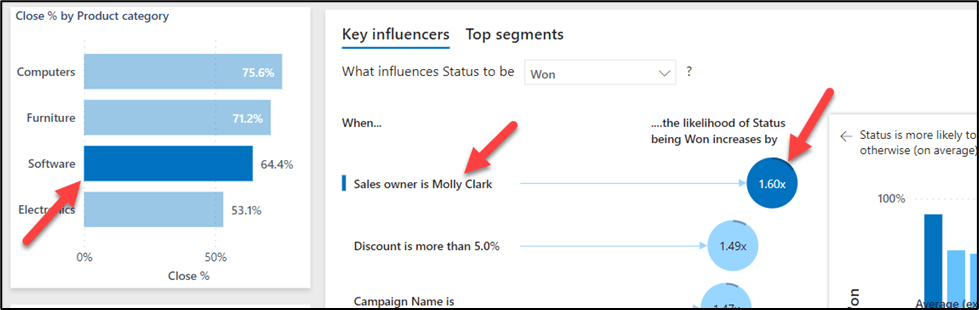
You can slice & dice this visual to answer similar questions for other product categories.
Artificial Intelligence Exploratory Analysis to Find the Root Cause using a Decomposition Tree
The Decomposition Tree is one of the most highly interactive visuals within Power BI. It can be used for Exploratory Data Analysis to understand the root cause. The default decomposition tree report looks like the figure below.
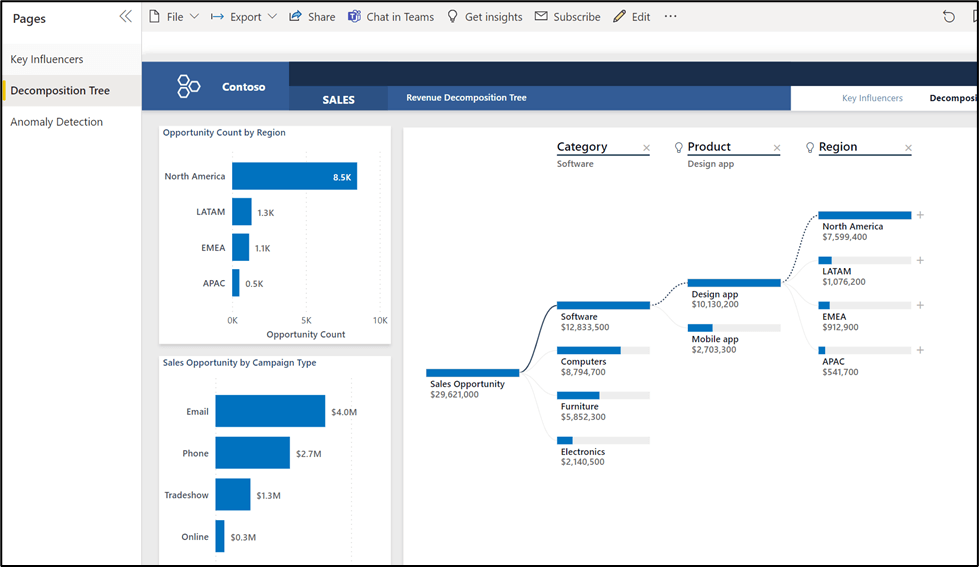
You can drill down the tree on this page by clicking on one of the categories. After that, we will select the corresponding Product to perform an AI Split. Lastly, we will identify the corresponding high and low values for Sales opportunities.
On this visual, firstly, close the Product and Region. Now we should only have Categories listed on this page. Here, click on the + sign next to Furniture Category.
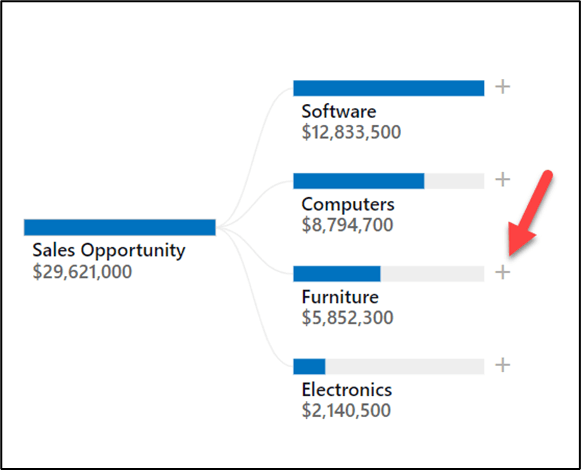
This will pop up another menu with "High Value," "Low Value," etc.
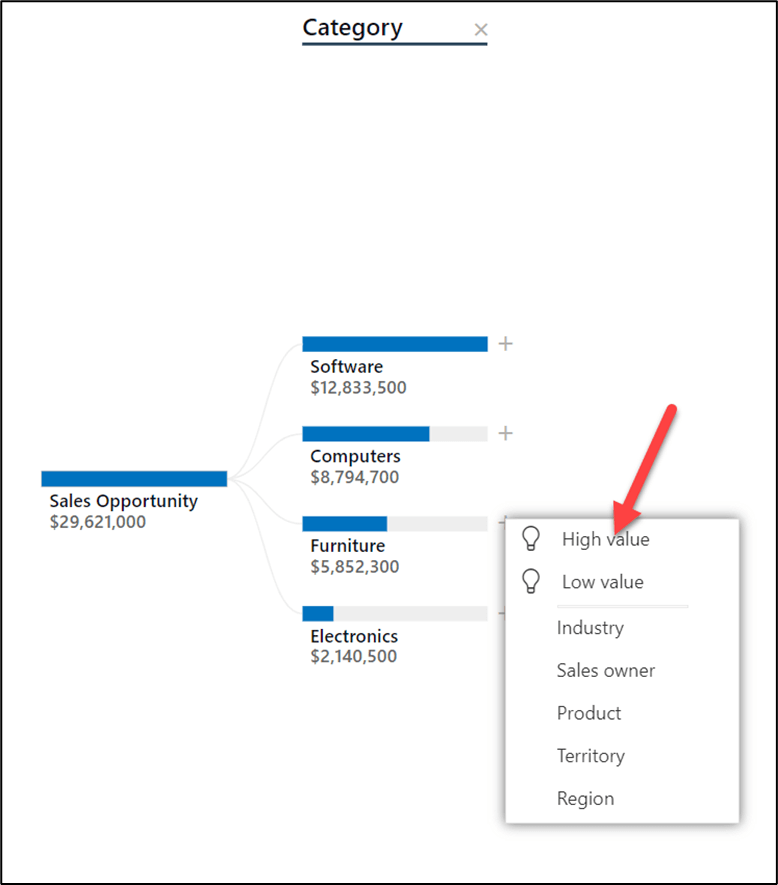
If you click on the "High Value," Power BI uses AI Splits to determine the highest value for the Furniture category. It will populate the High values for the Region for the Furniture Category. In the example, the highest value for the region is for “North America.”
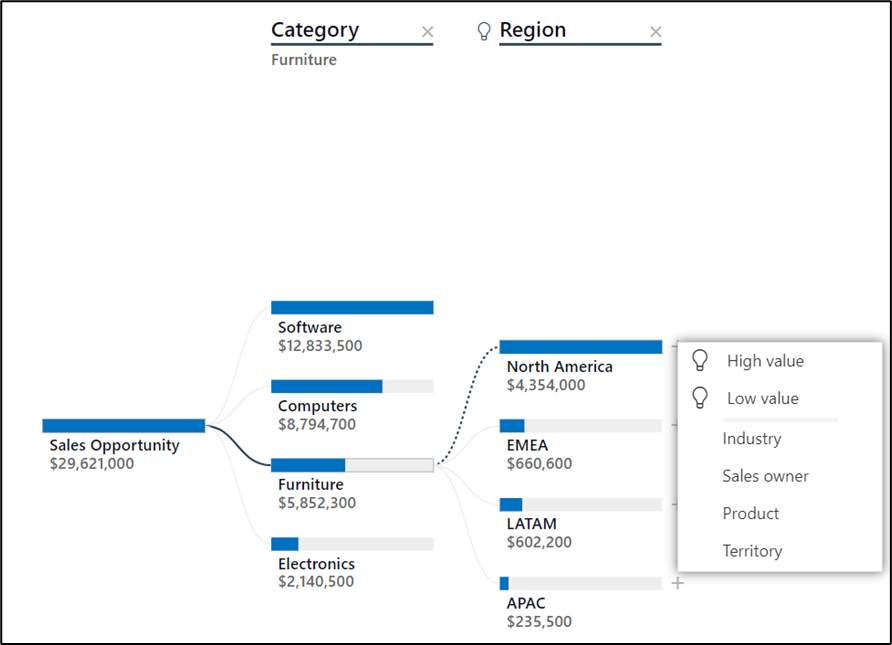
Here again, let’s click on the + sign next to North America. 
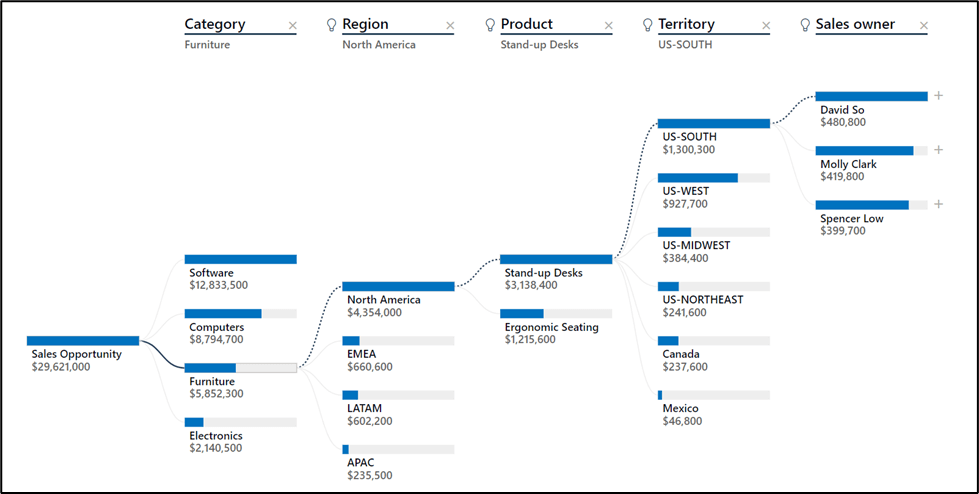
The similar menu will be displaced with "High Value," "Low Value," etc. Click on High Value, and the Power BI again runs the AI Split and determines the highest value of the Product for this Region. In this scenario, the highest value for the Product is “Stand-up Desks.” Clicking the + sign and selecting the High value again runs the AI Splits and determines the highest value for the Territory. We can keep going like this to determine the highest value for the Sales Owner. In this example, the highest value for the Sales owner is David So.
Conclusion
In this article, we learned about the Artificial Intelligence capabilities inbuilt within Power BI. We also interacted with a Microsoft AI-powered report to slice & dice data to explore AI features such as Key Influencer and Decomposition Tree features.
Power BI has been in Gartner’s magic quadrant for several years and is full of foundational and advanced capabilities. These include Data Science, Artificial Intelligence, and Machine Learning.
