

In order to understand what Data Analysis can and cannot do today, it is worth looking at how things have got to where they are today. But before we start, it is worth considering the term Data Analysis, although it has no SI definition. From my perspective at least it is the process of gaining a deeper understanding of things and garnering useful information from data. That data is simply the result of record keeping of various sorts.
Ancient Times
Record keeping in Stone Age times would not have been trivial, and it is probably not too surprising that there are not many examples extant today.

Fig 1
The opportunities for humour abound, as we think of how cavemen would have had to do things that we do today. It is no surprise that The Flintstones was the most popular TV cartoon franchise for more than three decades, and even now is only beaten by The Simpsons. Apart from the hard work of creating records, Fred would have had to manually sort through a pile of heavy stone tablets in order to produce the sort of information that the simplest computer applications can produce today.
Not quite so ancient times
And as is so often the case, people pondered these difficulties and worked on solutions, and in due course there was a giant technological leap – clay tablets were used instead of stone. This technology meant that records were much easier to produce, but performing any sort of analysis of the stored data would have again involved a hugely manual process of physically sorting through the saved clay tablets.

Fig 2
There are tens of thousands of these clay tablets created thousands of years ago that are still extant, mostly kept in museums. My own knowledge of cuneiform is somewhat sparse, but there are those who have been able to learn the various dialects of cuneiform and can read what other folk thousands of years ago considered important enough to be written down. The organisation of a clay tablet such as this one might suggest that it is a menu from the local take away, but we can safely assume that it is not.

Fig 3
No ancient novels unfortunately, but definitely records of what kings did – curiously, there is often more than a suggestion of fiction in the way that their exploits have been recorded! And then apart from the boring old laws, there are records of business transactions, and although it may pain us to consider it, tax details have been recorded.
Still pretty ancient times
There is no halting progress, and in due course, paper made from papyrus reeds burst onto the scene about 5,000 – 6-000 years ago, initially in scroll form, but then getting bound into book form.

Fig 4
A huge number of issues with the creation and storage of records were eliminated with the advent of paper. But analysis of that data would still have been far from straightforward.
Quickly zooming over the next five millennia
Other concepts, such as that of zero came into place over thousands of years. Zero itself was only invented about 1400 years ago in India, and took some 500 years to reach the West (Pythagoras was able to devise his theorem without having a functional zero). A few prior civilisations did have a sort of zero in use, but not rigorous enough to be a number of equal importance to other numbers. There are more than a few folk who attribute many of the great advances that have been made in the last 1400 years to this invention.
Various counting systems were used by different civilisations, vestiges of which still remain with us. For instance we can thank the Sumerians for their use of 60, which means that we split hours and minutes into sixtieths.
But in the West we settled on the decimal system of numbers (borrowed from other civilisations), and having rounded this off nicely with a proper zero, we had a robust system of numbers ready for some real work. Accounting got a solid base with the invention in Croatia of double entry bookkeeping almost exactly 600 years ago.

Fig 5
A clerk at a bench with a fat ledger and a quill is how accounts were done for hundreds of years. Analysis would have been very cumbersome, and this would not have been helped by the use of a non-decimal monetary system. A decimal currency gives a huge boost to analysis by making calculations so much easier.
Within Living memory
Despite any claims by my children to the contrary, I have not seen in practice any of the methods of recording data mentioned so far. I am acquainted with the terms like ‘groat’, ‘farthing’ and ‘sovereign’, but although I was born and spent my early childhood in a country that used pounds, shillings and pence, I have not used these in calculations, as decimalisation arrived there shortly after I started school, some years before the British currency was decimalised.
The earlier part of last century saw the rise of electro-mechanical accounting machines. These machines pretty much sought to duplicate a manual ledger, with a card being the direct equivalent of a ledger page. The cards had a magnetic stripe down the side on which some key bits of information were stored, depending on the application. There was always a counter to keep track of which line was to be printed on next, and a running total for the card, or sometimes more than one running total. Totals for the ledger could be calculated by running all the cards through the machine. Deeper analysis than this was not easy. To get sales by category, you might need to manually sort all the cards, and add up all the cards within each stock category, although some of the top end machines could do it a little easier than this – so long as you had simple stock categories!
These machines were a huge improvement on the totally manual methods that had been in use previously, but still had inherent problems, and analysis had to be planned when the program was written, with no flexibility. Even when everything worked well, it was still cumbersome.
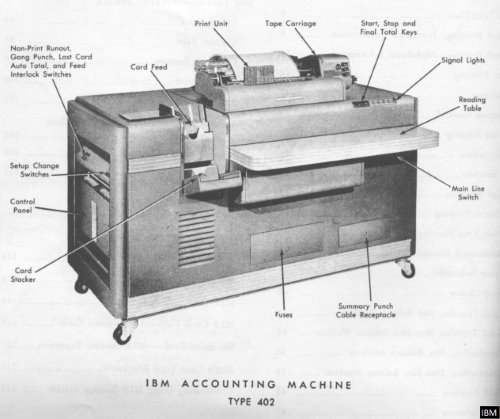
Fig 6
It’s starting to look like modern times
Then computers took over the job of storing business transactions. I was first involved in the computer industry a few years after the IBM PC had been launched, but before they were routinely networked. At that time where I was, the old mechanical accounting machines were still being used in a few places, but most companies had already changed across to proper computers.
I developed accounting systems for networked computers, using a variety of languages including Cobol and Basic. As networking PCs became the norm with the advent of Windows 3.1, they became a valuable platform for even the smallest of organisations. But there were issues. On the system that I was developing on at the time, there was only one flavour of Cobol, and one flavour of Basic. The data was stored using a separate ISAM (Indexed Storage Access Method), which meant that the data could be accessed by either Cobol or Basic, or whatever other language you chose to use on this system. However, over in the PC-world, different varieties of Cobol were not compatible, and you could be fairly certain that the code that was written in one variety could not be used in another variety without some fairly significant changes, and the data that was stored by one variety could not be accessed by another.
We have to start talking to each other
Networked computers were mostly proprietary and their networks did not talk to each other. There were tricks that could be done to pass data between systems, and I was involved in the development of a system that produced an output 80 bytes wide. This output was than fed down the phone lines into another system that had been told to listen for a card reader on that line, and so was able to import the data.
I remember the excitement when ODBC (Open Database Connectivity) was announced – okay, so not everybody felt any excitement, only some techies. It sounded as though any development language would be able to talk to any data, if you had the right drivers. Unfortunately the early reality did not quite match the initial hype, but what was important was that different computer companies were talking, and were working together to develop standards that would facilitate the interoperability of various systems.
What also became clear at this time was that a server would look after the data, and networked intelligent devices would handle the UI (User Interface). The traditional model up to this point had been a server that did everything, and dumb terminals that had only enough processing power to talk to the server. With the advent of PCs, it almost seemed as though all processing might be done on local devices. But the importance of sharing data between these local devices highlighted the need for a network, and within the network it made sense for one device to be responsible for being available all the time and keeping the data safe, so we quickly got back to the necessity of having a server.
Business Analysis starts to make its mark
In the 1980’s, I was regularly producing what were called at the time Management Reports. These were reports that were user-customisable (in a small way) that provided a variety of analyses of the data in their accounting systems. The term Decision Support Systems has also come into vogue and waned, and for some years now the accepted description has been Business Intelligence. One reason for the change in name is that there was a huge amount of change going on, and companies wanted to give an indication that they were offering something new that took advantage of the new developments. The rate of change these days is significantly reduced, although change is still the only constant. I have no doubt at all that a new term will replace BI in the near future.
The company for whom I worked at the time had also supplied a new system to Toys R’Us, and produced a marketing report about their success with this. With the aid of analysis from this new accounts package, Toys R’Us had been able to identify a toy that was just starting to become very popular, and they had been able to order stock so that they never ran out as the craze peaked, and then when the popularity was fading, they had been able to identify this early and cool their ordering so that they did not end up with piles of unsold stock. This would still be a good outcome these days, but it would not be that remarkable. At that time it was pretty much ground-breaking.
Business Intelligence today
At a very basic level, the architecture of a typical BI system that I might create today remains unchanged over several decades – extracts from the Live Database are made, and imported into a Reporting Database. Additional data may be imported to add to this imported Live data, such as market share data that is purchased from suppliers of such data. These days, the term Big Data is spoken about a great deal, and may mean that data from social media is also extracted to add to the Reporting Database.
Once all the data that is required has been accumulated, then some sort of calculation process is run on the data. Having done all this, analysis may be performed. In my experience, part of the calculation process is likely to involve populating an OLAP cube. An OLAP cube cannot deliver anything that an OLTP database cannot produce, so it might seem at first glance that a cube is redundant. In practice, an OLAP cube is able to produce answers in a fraction of the time that an OLTP database could produce those answers in. One major reason for this is that an OLAP cube does a number of aggregations when it prepares itself for use, so that when it is asked complex questions, it probably has a number of parts of the answer already calculated, and only has a small amount of work to do in finishing things off.
What sort of database do I want?
A Relational Database is excellent for storing all sorts of data in tables. With good indexing, it is possible to retrieve all sorts of answers very efficiently. A Multi-Dimensional Database is poor at storing things like addresses. Whilst it can store a little of this sort of data, I much prefer to keep textual data in the Relational database, and not clutter the cube unnecessarily. A Cube is designed to handle numerical data really well and to work efficiently with dimensions. This enables a user to easily slice and dice the data to provide the sort of analysis that is required.
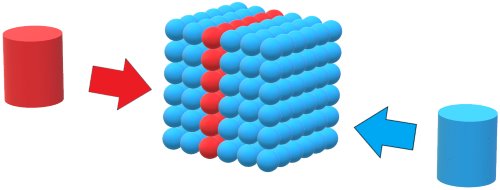
Fig 7
Analysis Services speaks MDX, and it is quite likely that an MDX query may look quite simple, while an equivalent TSQL query to produce the same answers from an OLTP database might be very complex. I always prefer to write a simple query rather than a complex one, as it is likely to be easier to get right initially, and will be easier to understand when I come back to it to make a change in due course. And if somebody else has to maintain the query, then it is much better to have a simple query for them to work with.
In-memory personal cubes
In 2009, the Microsoft SQL Development Team had a project underway – Project Gemini. I was privileged to be involved in some email dialogue with the Gemini team, and make some small input into the work they were doing. When the project was complete, it resulted in a product called Power Pivot, which although a free download, was initially only licensed for use with SQL Server 2008 R2. This requirement soon dropped, and it is now freely available for any Excel user to use, so long as it is a version of Excel that supports it.
Power Pivot is a great product, providing in-memory OLAP capabilities to ordinary users of Excel. I have loaded 120 million records into Excel in this way, and done blisteringly quick slicing and dicing on those records. There is a necessary compromise with this product – it was aimed at power Excel users, so it kept a number of features of SSAS out, in order to simplify the product and enable non-techies to use it. I have just one major gripe against it – it is not possible to write VBA code to manipulate any part of Power Pivot.
Power Pivot has effectively come out as a Server Edition in the form of the SSAS Tabular Model. The same basic SSAS features are available in both, they both use DAX expressions, and the database engine behind both is the Vertipaq engine. The major difference is that the SSAS Tabular Model can manage databases that exceed 2GB, and can handle multiple partitions, while Power Pivot is limited to a 2GB Excel file size, and can manage only a single partition.
Microsoft Office as Analysis tools
Building on the good work done in getting ODBC to be a reality, the Excel team have produced a fine product that enables Excel users to have no problem in extracting data from databases of various types in various locations, enabling folk with limited technical knowledge to interact with their data in very creative ways.
VBA is a superb adjunct to Excel. For analysis purposes, it may be used in two ways. Firstly, it may be that the analysis required needs a special calculation, and it may be best to create a new Excel Function to perform that calculation efficiently. Secondly, it may that the analysis requires a few procedures to be encoded into VBA, providing an automated solution. In this way, data may be retrieved from a database and manipulated with VBA code in order to present it as a dataset within Excel on which analysis may be performed.
VBA does come with a few cautions, and it is important to always remember that Excel is principally a spreadsheet, but it does have very useful code capabilities through VBA. Excel is not a development environment with spreadsheet features attached. VBA code is not the equivalent of code produced through a more robust code development environment, such as .Net. It is crazy to try to write a whole system in VBA.
The Excel team is always working on new and improved data visualisations, and these may come out as things like spark lines or new graphs. There are many other products that will interact with your data such as QlikView and Pyramid Analytics, all of which put pressure on the Excel team to make Excel a better product to use in order to interact with your data.
Marketing is all about keeping in contact with the client base, and Word is an invaluable tool in this regard. While Word does not contain features to crunch data, it is possible to do Mail Merges to create customised letters or emails. The list of recipients can be almost anywhere, but it is often best to extract the recipients into Excel, where they can be further manipulated and once they are in a fit state to use, the Mail Merge can be done.
More about data
I mentioned at the beginning my definition of Data Analysis which is the process of gaining a deeper understanding of things and discovering useful information from data. The data that we look at is undergoing some major changes. A few decades ago, data would have been understood to mean an organisation’s own databases, but these days, it is taking on a more flexible nature. Data is more and more available on the internet, and is starting to have more of an impact on Data Analysis. There are a number of organisations that collate and sell subscriptions to data, such as market share and pricing data.
Credit ratings and car registration details are all available to organisations that will pay for the access to that data. Different countries have different local data available, but the overall trend is consistent everywhere – more data of different sorts is becoming available.
Data is being accumulated at a massive pace. Every time a passenger jet makes a flight or a Formula 1 car drives around the track, enormous quantities of data are created. Some of this data may be transmitted in real time to a server somewhere for instant analysis, but other data will have to wait until the trip is over and things are plugged in. We create data constantly – we buy a ticket for the bus, make a phone call, play a game on the phone, send an email. More and more of the things we do are being recorded by somebody somewhere. Buses and delivery vehicles are more likely than not to have satellite tracking active so their journeys are all logged automatically, and ANPR cameras are becoming more pervasive meaning that private cars are starting to have parts (or all!) of their journeys logged.
Servers running databases are likely to be very powerful indeed, with multiple muscular processors, acres of disk space, vast RAM, and speedy networks. Analysis that could only be dreamed of a few decades ago is now possible.
So what do we analyse?
This all begs the question – what sorts of things are analysed? There are only two possible answers to this – ‘pretty much anything’ and ‘it depends’. The analysis performed on Formula 1 car data will be vastly different to that done at a mobile phone company.
All organisations are likely to have a standard set of analyses that will need to be done regularly, as well as ad hoc analysis that is in response to events. New analyses are very likely to be required every time a government talks about or implements a change – organisations that operate within the relevant sphere need to know how they might be affected by the proposed change. A volcano that erupts with the wrong sort of eruption can cause havoc with flights, and immediately travel agents, airlines, hotels etc will all need to try and work out how they will be affected. All sorts of change will result in a need for data analysis.
Different departments within a company will want to do different analyses, perhaps on the same data, or perhaps on different data. The Accounts people will be pleased to analyse the sales data, while the Sales/Marketing people might want to analyse far more detail about their customers. Where do they live? What sort of income are they likely to have? Do they have children? What sort of car will they drive? There are a host of questions that a Marketing person will want to have answered, with the questions arising out of the nature of the organisation. All the questions are designed to help the Marketing people understand their customers better, in order that they can do more business with those customers, and possibly to target advertising campaigns more precisely. Of course, if they understand who their customers are, they can also perhaps look for more people who are similar, who would make good customers.
I set things up for a company in the agricultural sector to be able to link weights and costs in the Nominal Ledger. They had individual fields or groups of fields as Cost Centres, and fertilizer costs were rocketing. With the analysis that I set up, they were able to check that the amount of fertilizer used remained constant, despite the increasing cost. This sort of analysis was hugely important to them, but not every organisation would need the same.
New York City have made available a huge amount of data, and I expect that over the next few years a variety of apps will be developed that make some sort of sense of bits of it. So if you need to do something in NYC, you will be able to access a variety of background data and analysis that should guide and support you in your task.
In one of the Die Hard films, Bruce Willis and Samuel L Jackson have to make a taxi drive in the morning rush hour, and they have less than 30 minutes to do this in. I have seen an analysis of the amount of time it would take a taxi on average to do this trip, and that suggests that this would not have been as herculean a task as the film made out. But then how exciting would it be to watch a film of a normal everyday taxi trip? Probably NYC are hoping for analysis that might be a bit more applicable to real life situations, rather than simply proving that films are based on fiction. My definition at the beginning of this article refers to 'useful information', and whilst this analysis was impressive, wading through more than a billion records of taxi trips, describing at as useful is most likely stretching the truth a bit.
What is the PATH to success?
So we have some data, and we have a problem that we have to solve, but how do we go about things. I am not going to suggest the queries you will need to write, or the pivots you might try executing, because they are so varied, depending on all sorts of things. But what I can suggest is a little methodology to get where you need to go.
The first thing you look for are Patterns, and the big thing you need to remember with these is that patterns repeat. A single instance is not a pattern – you would really need several instances at least, if not hundreds or thousands, before you can claim a pattern. As you look at your data, it may start to show that night follows day, so you look a little deeper and see that in its turn, day follows night. And this cycle seems to repeat frequently – you could be on to something here!
The next thing you need to look for are Anomalies. There is nothing intrinsic that can identify an anomaly, as it is all dependent on your data. Thinking about this day / night pattern that we may have found, if we found a short night in the middle of the day, it would definitely qualify as an anomaly.
And this brings us to the next step – you need to Test Hypotheses. Thinking about our anomalous short night in the middle of the day, we need to come up with some hypotheses that could explain it, and then we need to test those hypotheses.
The anomaly could be due to some Martians interfering in some way, but a few moments of reflection should indicate that this is not likely to be cause. It could be that the anomaly was due to an eclipse, and if testing shows that this is the case, we may find that unfortunately this anomaly does not provide the answer to our problem.
So we go back and search for more Patterns and Anomalies, and then we Test our Hypotheses – this iteration will put us securely on the PATH to success.
A Caveat or two
In closing, a few words of caution. Data Analysts and would-be Data Analysts should never lose sight of common sense!
It is quite possible that a fancy formula will occasionally have insufficient or dodgy data and provide a totally unrealistic answer. An Analyst should not be scared to give things a sense check, before the insights are published.
Common sense should also help avoid confusion between correlation and cause. It may be that an examination of data reveals a high degree of correlation between the incidence of astigmatism in polar bears, and the number of illegal U-turns performed in my town’s Main Street. But it would be ridiculous to suggest that U-turns are causing astigmatism in polar bears! A man named Tyler Vigen has created a website with a number of spurious correlations which are actually based on real data, unlike my suggested correlation – TylerVigen.com is well worth a visit.
However, we do not want to overreact, and write off every correlation too quickly. It is well known that the El Nino current affects weather patterns a long way off, and so it would be beneficial to be able to measure the El Nino in order to predict weather elsewhere. Fortunately, the atmospheric aspect of El Nino known as the Southern Oscillation is easily measured and identified. The whole effect is known as El Nino – Southern Oscillation (ENSO). If we were to think of ENSO as the stick used to knock over the first of a series of dominoes, we could analyse the ENSO data, and make predictions about dominoes some way down the track.
This has proved to be the case with drought in Zimbabwe, as folk have been able to make accurate estimates of the rainfall in Zimbabwe based on ENSO data from some months previously. Although thousands of miles and several months in time separate the two events, there is a very high degree of correlation between El Nino and drought in Zimbabwe. Having these insights months in advance should enable actions to be taken to ameliorate the effects of the drought before it happens.
Image Copyrights
Many thanks to my friend Quill Harpham who drew me some pen and ink pictures. Thanks also to Gabriel Vandervort from AncientResource.com for permission to use his images of cuneiform tablets and papyrus - if you ever feel the need for something really old, then talk to Gabriel.
