In this sixth level, we examine how to set up a complete monitoring system using a couple of open source programs, which are spreading very fast among the SQL Server community.
The Need for SQL Server Monitoring
Now that we have a SQL Server on Linux up and running, we probably want to monitor it, both for performance baselining and for troubleshooting purposes. In a Windows server you can rely on an old friend, the Performance Monitor tool, to read the performance counters and, eventually, register a trace to have a baseline. If you are running SQL Server on a Linux machine, things are slightly different. The monitoring infrastructure I want to show you is based on these three open source tools: InfluxDB, Telegraf and Grafana (aka the TIG stack).
InfluxDB is an open-source time series database, developed in Go by InfluxData. InfluxDB is optimized for fast, high-availability storage and retrieval of time series data for metrics analysis. This can be installed on a single server or as a clustered instance (Enterprise edition only).
Telegraf is an agent, written in Go, for collecting, processing, aggregating and writing metrics. It must be installed on all devices that need to be monitored, and all metrics collected by Telegraf are pushed and stored in InfluxDB.
Grafana is an open source, feature rich metrics dashboard and graph editor for Graphite, Elasticsearch, OpenTSDB, Prometheus, and InfluxDB. Data stored on InfluxDB will be visualized using Grafana.
Installing InfluxDB
As in the previous chapters, all the demos will be based on Ubuntu operating system, the same we used for the virtual machines to test SQL Server on Linux.
The first component to install and configure is InfluxDB, the time-series database. You can find it opening the page https://portal.influxdata.com/downloads/ with your favorite browser.
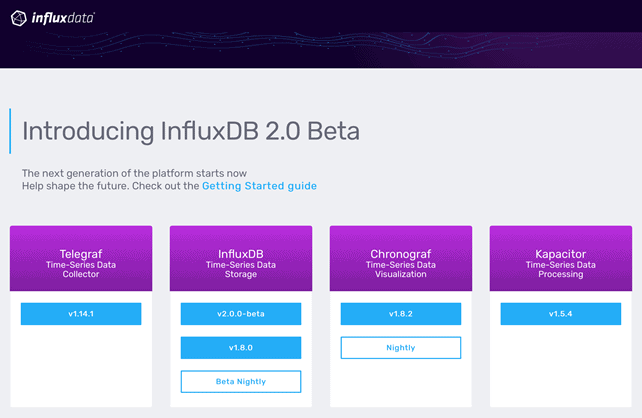
On this page you can find also Chonograf and Kapacitor, which are respectively the data visualization tool and the time-series processor engine, that will be object of a future article. You can install InfluxDB by clicking on the button “v1.8” and following the instructions related to the operating system you are running on:
Please note that I’m going to demonstrate the current stable version of InfluxDB (1.8), because the 2.0 version it is not yet released to manufacturing at the time I’m writing this article.
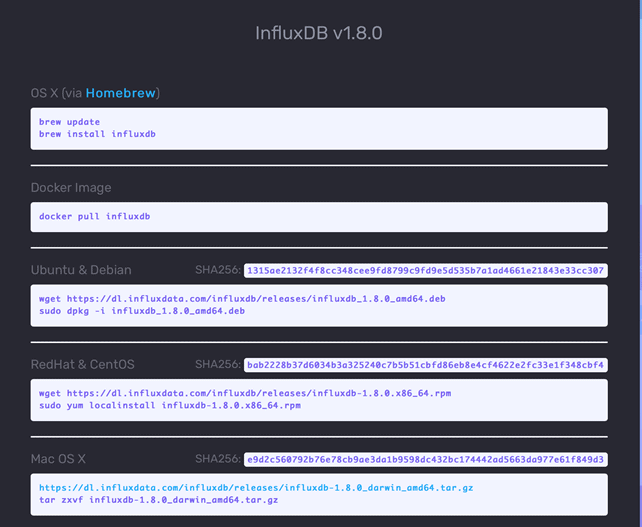
Or, alternatively, you can add the InfluxDB repository to Ubuntu and use the apt-get tool to do the job:
# wget -qO- https://repos.influxdata.com/influxdb.key | sudo apt-key add -
# source /etc/lsb-release
# echo "deb https://repos.influxdata.com/${DISTRIB_ID,,} ${DISTRIB_CODENAME} stable" | sudo tee /etc/apt/sources.list.d/influxdb.list
# sudo apt-get update && sudo apt-get install influxdb
# sudo service influxdb start
By default, InfluxDB uses TCP port 8086 for the client-server communication using the InfluxDB API, so you also need to open this port on your firewall, if enabled:
# sudo ufw allow 8086/tcp
In addition to the port above, InfluxDB may be using a plugin that require the use of other custom ports. All port mappings, however, can be modified through the configuration file, which is normally located at /etc/influxdb/influxdb.conf.
Installing InfluxDB
Now that the InfluxDB service is running, you have to create a database where save your data and change a few other settings, if you want to use the HTTP endpoint authentication, for example. This can be done by running the influx program, which is automatically installed by InfluxDB setup. You can then use the SQL-like language included in InfluxDB to run the specific commands required to perform these actions.
In the following example, you will create a new database called telegraf, a new default retention policy to delete aged data and a new user that you will use to connect to the influxdb service when connecting both via the influx client or http APIs.
# influx
> CREATE DATABASE telegraf;
> CREATE RETENTION POLICY telegraf_30d ON telegraf DURATION 30d REPLICATION 1 DEFAULT;
> CREATE USER username WITH PASSWORD 'secure-password' WITH ALL PRIVILEGES;
To enable secure connections only from telegraf agents (or your custom agents), you have to change the parameter auth_enabled to true in the [http] section of the InfluxDB configuration file /etc/influxdb/influxdb.conf and restart the service:
# sudo systemctl stop influxdb
# sudo systemctl start influxdb
You can test it by run the following command from a linux shell:
# curl -G http://your-server-address:8086/query -u username:secure-password --data-urlencode "q=SHOW DATABASES"
The command should return a JSON string with two databases: internal and telegraf.

Installing Telegraf
Our first step in setting up Telegraf will be setting the telegraf user on our SQL servers. The account needs VIEW SERVER STATE and VIEW ANY DEFINITION permissions.
Open Azure Data Studio or SQL Server Management Studio, connect to your SQL Server instance on Linux and run these commands:
USE master;
GO
CREATE LOGIN [telegraf] WITH PASSWORD = N'P@ssw0rd!';
GO
GRANT VIEW SERVER STATE TO [telegraf];
GO
GRANT VIEW ANY DEFINITION TO [telegraf];
GO
Going back to the downloads page click on the blue button v1.14.1 to see the following page:
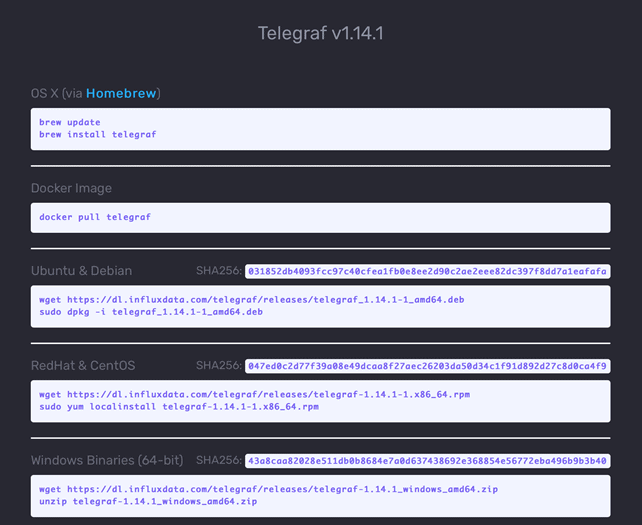
In our case, we will use the instructions for an Ubuntu machine and run the following commands:
wget https://dl.influxdata.com/telegraf/releases/telegraf_1.14.1-1_amd64.deb
sudo dpkg -i telegraf_1.14.1-1_amd64.deb
At the end of the installation, we have a few more steps to complete, configuring the service by editing the file /etc/telegraf/telegraf.conf and then starting the service.
Open the file /etc/telegraf/telegraf.conf with your favorite Linux editor and change the following sections, shown in red below. Obviously, you should change the username and password with those you selected in the influxdb configuration process:
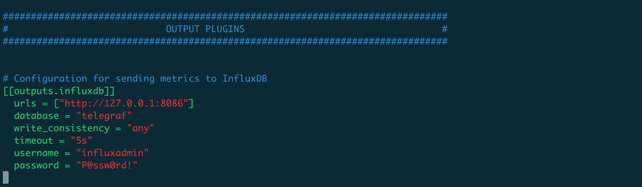
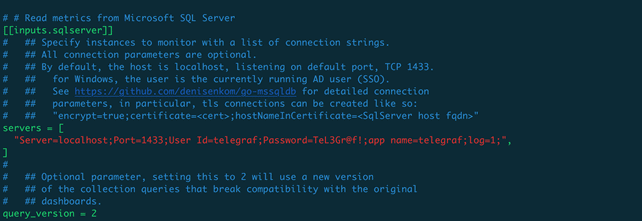
After you have saved the configuration file, it’s time to start the telegraf service and start collecting data.
# sudo systemctl enable telegraf
# sudo systemctl start telegraf
If you are curious about what metrics are collected by the SQL Server input plugin (and know a little bit of Go language), you can go to the GitHub repository here: https://github.com/influxdata/telegraf/plugins/input/sqlserver.
Please be aware that there are two versions of the metrics structure: one for Version 1 of the plugin (which is deprecated in Telegraf, starting with version 1.6) and one for Version 2, which is the current stable version (and the reason for the parameter query_version=2 in the above configuration).
The metrics provided by the Version 2 are shown here.
- Database IO: IO stats from sys.dm_io_virtual_file_stats
- Memory Clerk: Memory clerk breakdown from sys.dm_os_memory_clerks, most clerks have been given a friendly name.
- Activity: Transactions/sec/database, Batch requests/sec, blocked processes, + more
- Availability Groups: Bytes sent to replica, Bytes received from replica, Log bytes received, Log send queue, transaction delay, + more
- Log activity: Log bytes flushed/sec, Log flushes/sec, Log Flush Wait Time
- Memory: PLE, Page reads/sec, Page writes/sec, + more
- TempDB: Free space, Version store usage, Active temp tables, temp table creation rate, + more
- Resource Governor: CPU Usage, Requests/sec, Queued Requests, and Blocked tasks per workload group + more
- Server properties: Number of databases in all possible states (online, offline, suspect, etc.), cpu count, physical memory, SQL Server service uptime, and SQL Server version. In the case of Azure SQL relevent properties such as Tier, #Vcores, Memory etc.
- Wait stats: Wait time in ms, number of waiting tasks, resource wait time, signal wait time, max wait time in ms, wait type, and wait category. The waits are categorized using the same categories used in Query Store.
- Schedulers - This captures sys.dm_os_schedulers.
- SqlRequests - This captures a snapshot of dm_exec_requests and dm_exec_sessions that gives you running requests as well as wait types and blocking sessions.
For Azure Managed Instances, you get these items from sys.server_resource_stats and sys.dm_instance_resource_governance:
- cpu_count
- server_memory
- sku
- engine_edition
- hardware_type
- total_storage_mb
- available_storage_mb
- uptime
- resource governance
For Azure SQL Database, you get:
- Stats from sys.dm_db_wait_stats
- Resource governance stats from sys.dm_user_db_resource_governance
- Stats from sys.dm_db_resource_stats
Installing Grafana
The last step is to install Grafana, that we’ll use to present the collected data in a graphical form, easier to visualize and understand than raw numbers.
Following the instructions from the download page (https://grafana.com/grafana/download) to download and install the package for Ubuntu and Debian:
# sudo apt-get install -y adduser libfontconfig1
# sudo wget https://dl.grafana.com/oss/release/grafana_6.7.2_amd64.deb
# sudo dpkg -i grafana_6.7.2_amd64.deb
You also need to start and enable the Grafana-server instance, as we did before for the influxdb service:
# sudo systemctl start grafana-server
# sudo systemctl enable grafana-server
You also need to open port 3000 on your firewall, if enabled, to access the dashboard from another computer.
# udo ufw add 3000/tcp
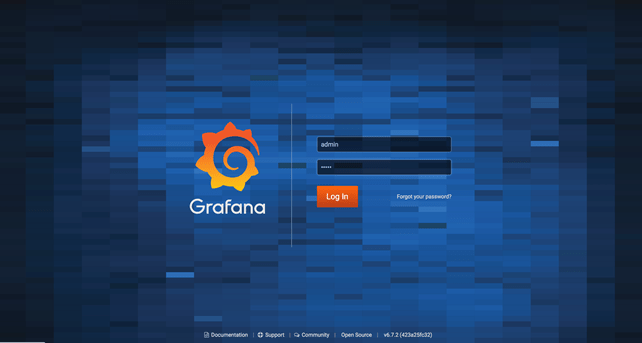
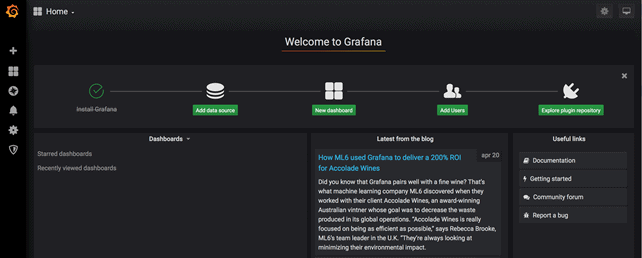
Now you can point your browser to the address http://your-server-address:3000 and access the Grafana administration using the default user admin with password admin. Please note that after the first successful login, Grafana will ask you to change the admin password.
Creating Your First Dashboard
Once installed, Grafana is an empty container, so the first step is to configure a new Data Source to start building our first dashboard.
Click on Data Source icon and select InfluxDB data source type.

Fill out the following fields:
| URL | http://localhost:8086 |
| Basic Auth | Enable |
| Basic Auth Details – username | your-username |
| Basic Auth Details – password | your-password |
| Database | telegraf |
Then click on the button Save & Test to save the parameters and check the communication with the InfluxDB service.
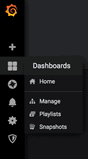
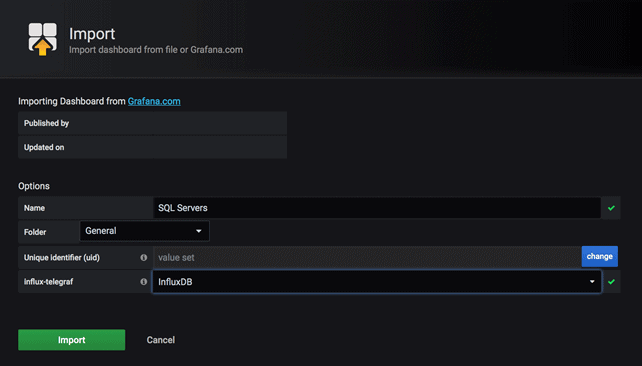
Now we need to create the first dashboard. You can click on the New Dashboard button in the home page to create a new one from scratch or import an existing template from the Manage dashboards menu item:
Copy the content of the JSON file located here: https://github.com/ddominici/StairwayToSQLServerOnLinux/blob/master/sql-server-dashboard.json. Then click the Import button. Choose the source database from the influx-telegraf combo box and click the Import button.
You should see something like this:
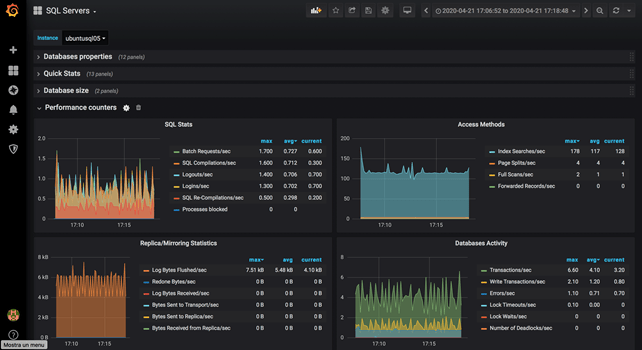
Congratulations! We have an up-and-running open source monitoring system for SQL Server, that we can use for bot Windows or Linux instances.
In the next level we’ll explore how to create and customize Grafana dashboards to adapt it to our needs. And since InfluxDB accepts data via HTTP APIs, we’ll learn how to use it to monitor, for example, the temperature and the humidity of our data center, using some cheap hardware and a couple of Azure services 😉
Enjoy SQL Server.