

Problem Statement
In one of the Business Analytics Dashboards Projects, Sales data is received from different countries (100 +) around the globe. This data is consolidated and depicts trend analysis KPIs, such as MTD, YTD, and ITD. The data received is in an Excel file in a crosstab style (Pivot) format, which is not standard. In addition, each country may have Sales volume of different months. For example, the USA may have 12 months of Sales, Canada may have 8 months of Sales, and UK may have 5 months of Sales.
To process this data and load it into the data warehouse, the data ingestion process (ELT/ETL) expects properly formatted standard files with constant columns and valid data in each column domain. To make this happen, a team of multiple software professionals, manually convert pivot files to un- pivots files and do the data transformation, such as converting string values from Jun’23 to 01-31-2023.
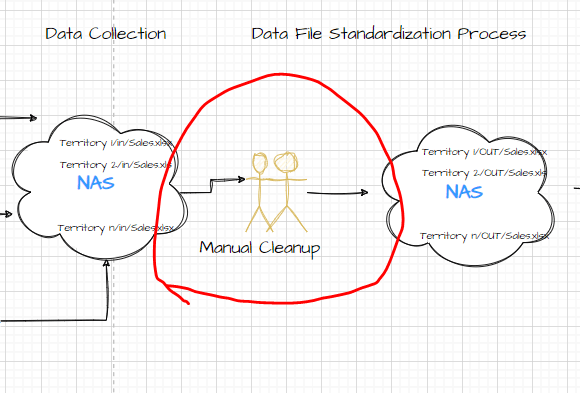
Here is the pictorial representation of the existing solution design.

The problem with performing the aforesaid standardization activities is that 1) we spend a good amount of effort and time and 2) human errors in the process. The challenge areas in the solution design are highlighted below:
To solve the above said concerns, we have developed a Python program that transforms the data efficiently and economically.
Proposed Solution Design

Solution Implementation Steps
The Python code has been designed using Jupyter Notebook to see the result at each step. The same code can be put into a Python file and can be scheduled as needed.
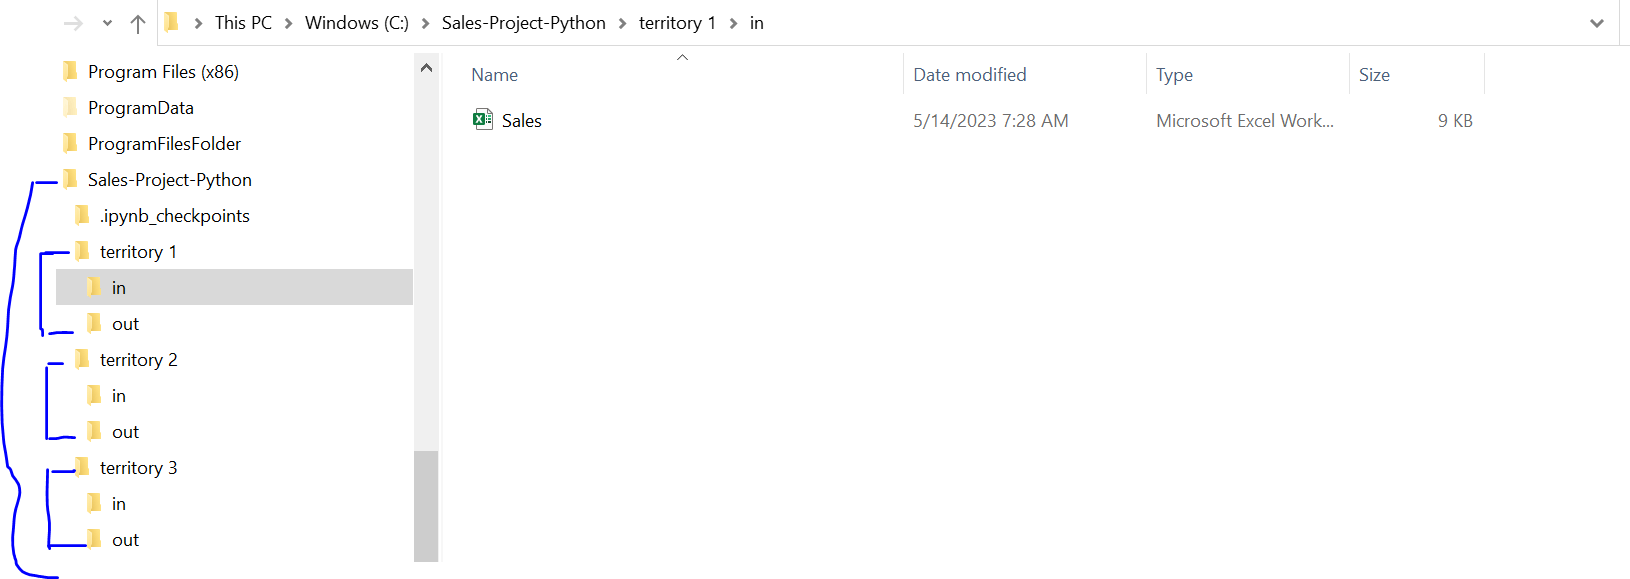
Preparing the project structure
Firstly, a project directory that is titled “Sales-Project-Python” needs to be created. This will serve as the umbrella encompassing the smaller subsections. Under the project directory, 3 folders named “Territory 1, Territory 2, and Territory 3” need to be created respectively. Within each territory 2 subfolders labeled “In” and “Out” need to be created. The original raw files of the territories can be placed in the “in” folder, and the result files are placed in the “out” folder.
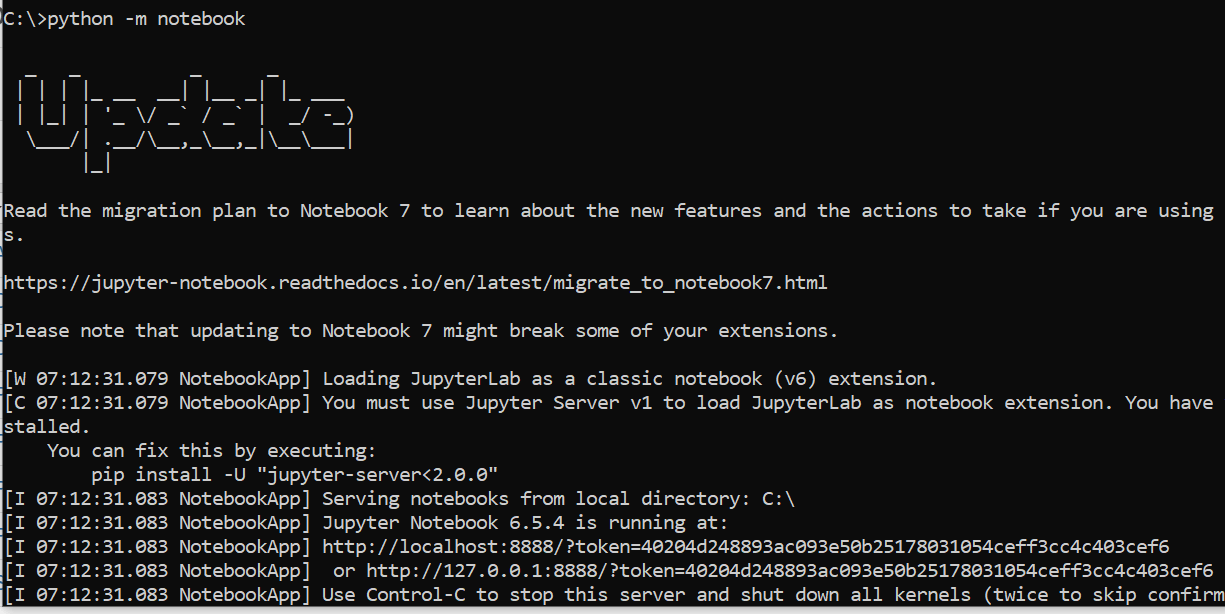
Invoke the Jupyter Notebook
The “python -m notebook.” Command can be used to invoke the Jupyter Notebook service.
Create a New Jupyter notebook
After invoking the Jupyter notebook, the browser opens up with the project’s root. To create a new Jupyter notebook, press on the File button and then press “New Notebook”.

With the new notebook created, the code can be written!
Implementing the logic for Territory 1 and then expanding this logic to multiple territories
The raw data from the “in” folder of Territory 1 is loaded into the panda’s frame as shown below.
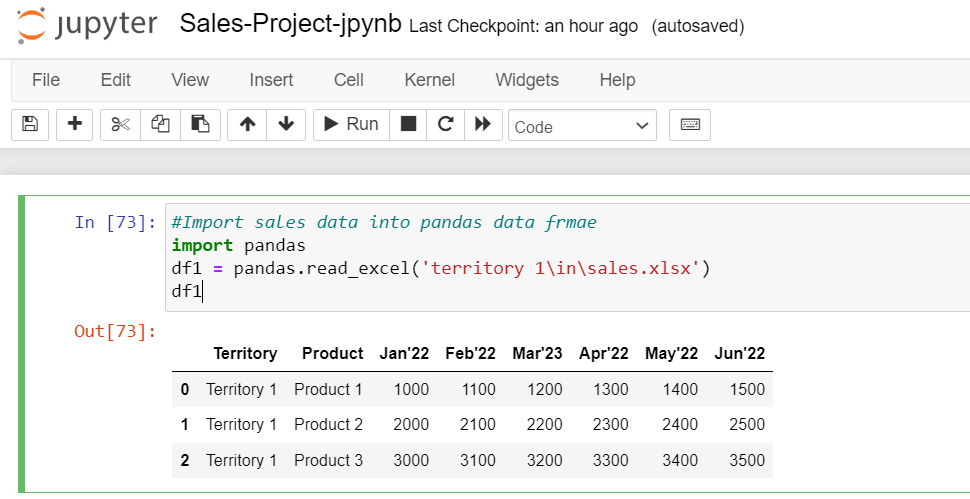
The data is imported into the data frame using the pandas.read_excle()method. This method expects the Excel file name with the path and returns the data frame, i.e., df1, as shown in the above picture.
With the data available in data frame df1, this can now be printed. Place it in the cell and click on execute. The output is shown in the above picture.
Separating header columns and variable columns
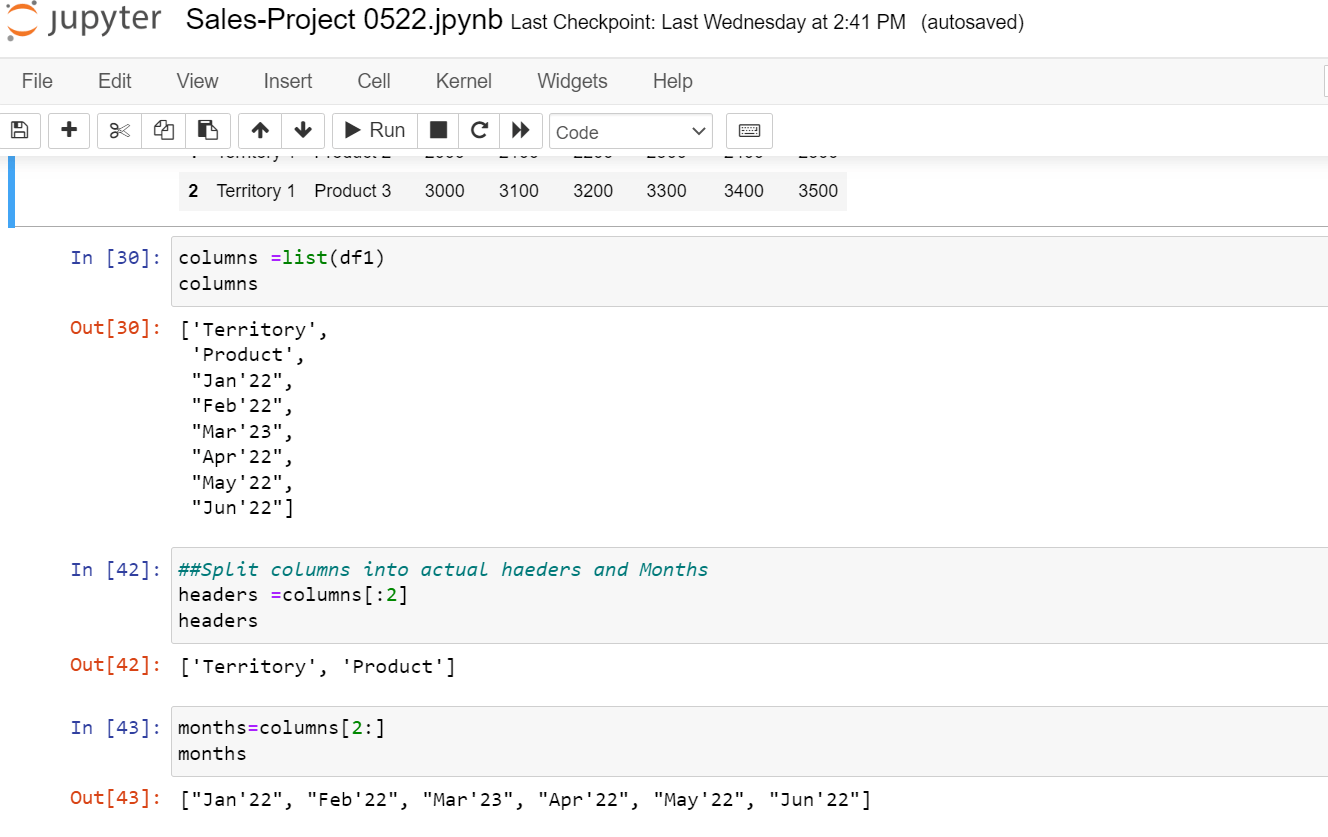
Separate the header columns, such as Territory Name and Product Name, and the variable columns, such as Jan’22, Feb’22, etc., to transform the data from pivot to unpivot and to see a fixed structure to load the data into the target DW system. The list() function is used to extract all the columns from a data frame and store it in the variable “Columns.”
Now the fixed headers and variable columns must be separated into 2 different Lists from the variable “Columns”. One list is for fixed columns and the second is for variable months, this is then stored into respective variables “headers” and “months.” As shown below picture
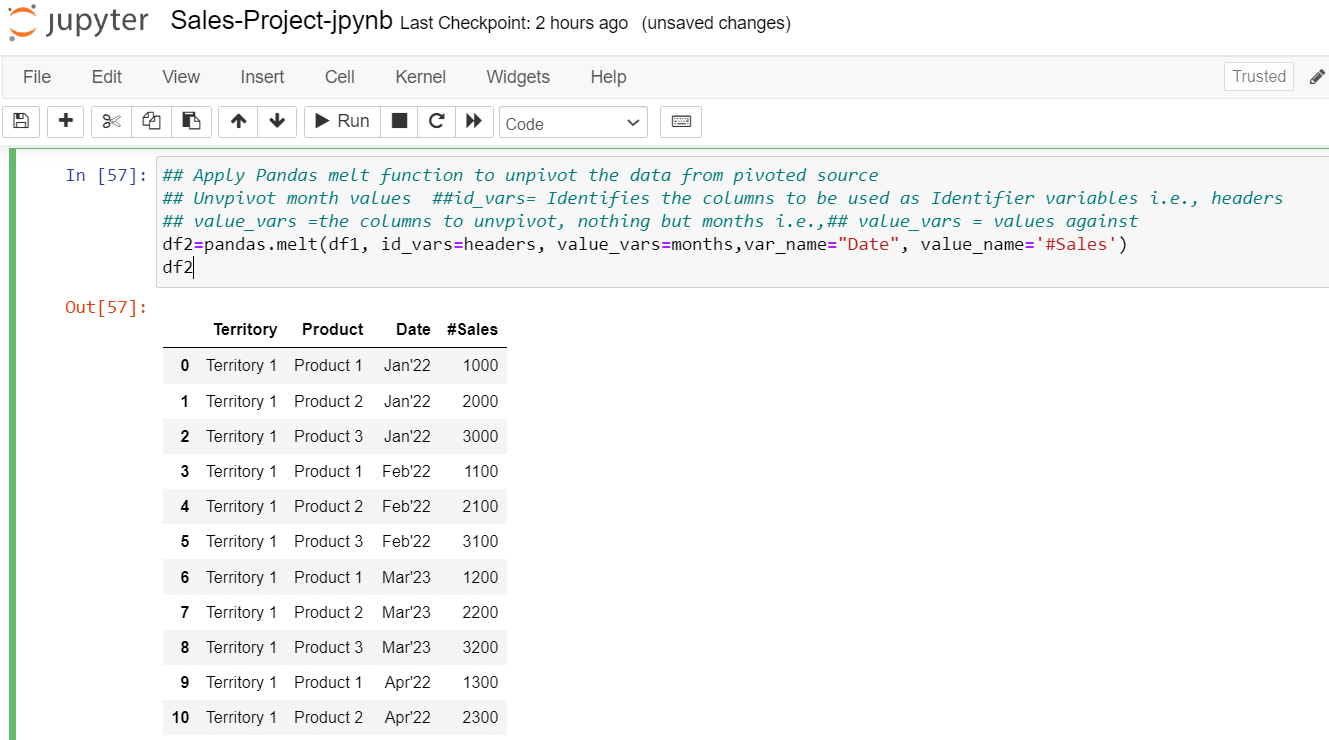
Unpivoting the data using the Pandas Melt function
To unpivot the data, pandas has provided a function called pandas. melt(). The signature of this function is
pandas. melt (frame, id_vars=None, value_vars=None, var_name=None, value_name='value', col_level=None, ignore_index=True)
Here the first parameter is data frame df1; the second parameter, id_vars, is nothing but headers, the third parameter, value_vars is dynamic months, the fourth parameter, var_name is a label for the dynamic month which is a “Date”. The fifth parameter, value_name is a measure value of “# Sales”, and then execute the code.
These are the results generated:
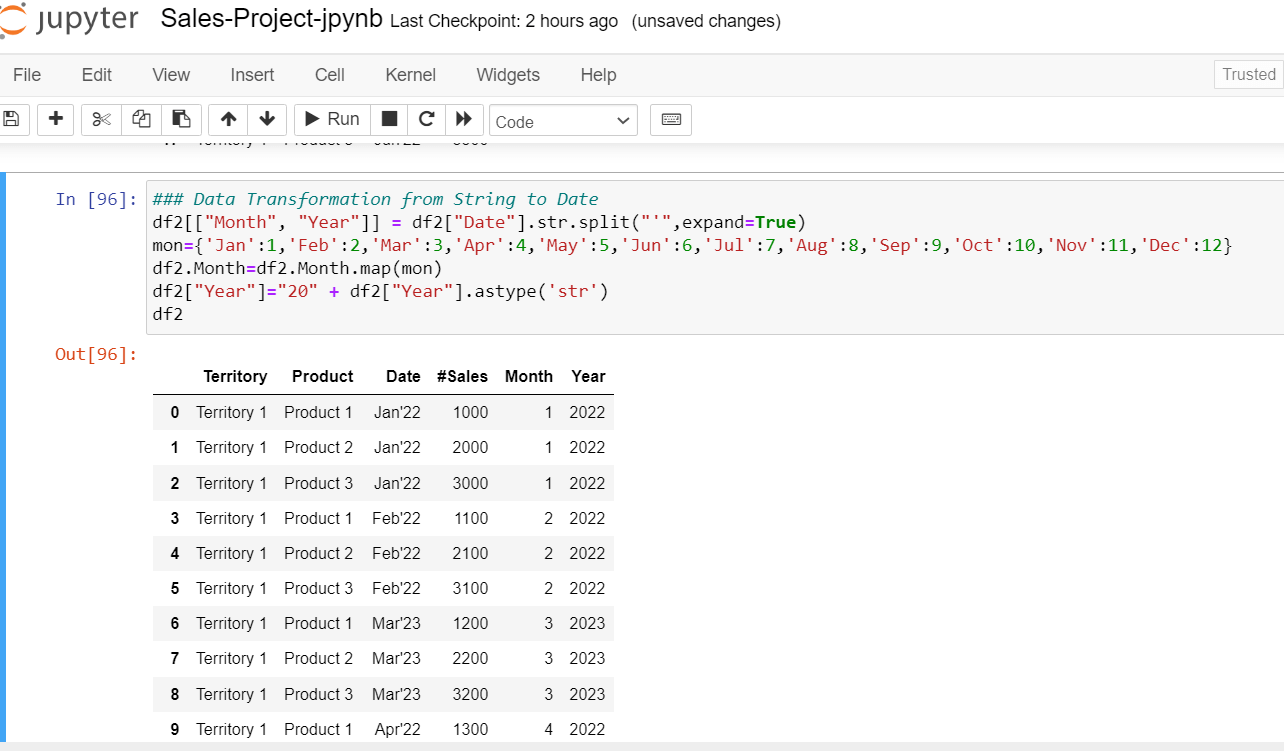
Data Transformation
To transform the month and year composite column to separate month and year columns, the string split () function, as shown in the picture with the delimiter “ ’ ” can be used. To convert string month values to integer values, a dictionary object mapping Jan to 1, Feb to 2, etc needs to be created. Example Mon_Dictionary ={‘Jan’:1, “Feb”:2, …} as shown below.
Now, to overwrite the month string value (Jan, Feb, etc.) with Integer Value (1,2, etc.) the Python map()function can be used as shown below. The last transformation is to add century values to two-digit years using the concatenation symbol (+) as shown below.
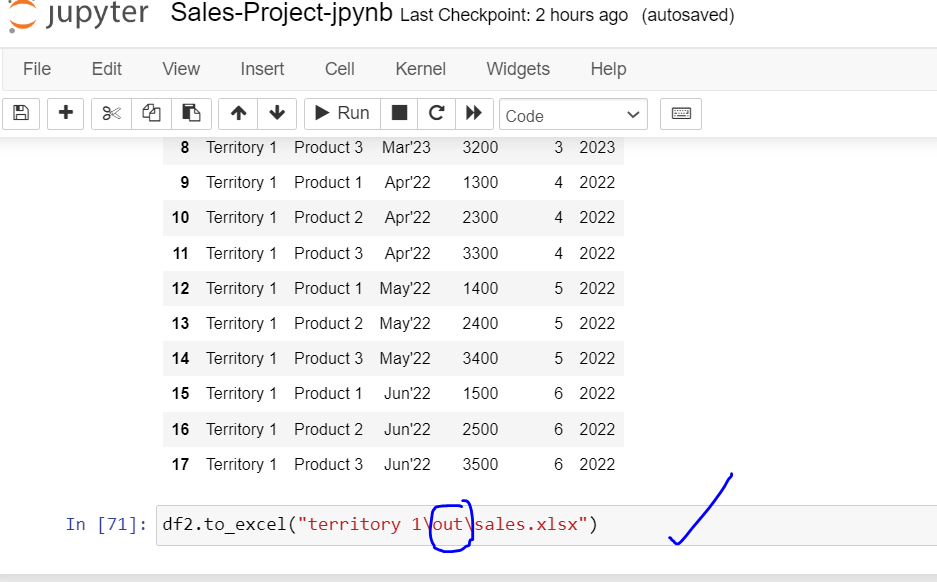
Save final result in the Target folder
Expanding the prior logic to all territories
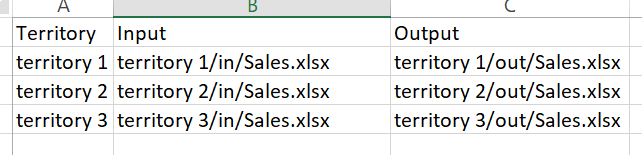
To process all the required territories data, a common configuration file containing the list of territories to process the input and output paths.
The sample file is placed in the config folder (Config/ Config-territories.xlsx), and the sample data is shown below, where each row contains each territory’s input and output paths.
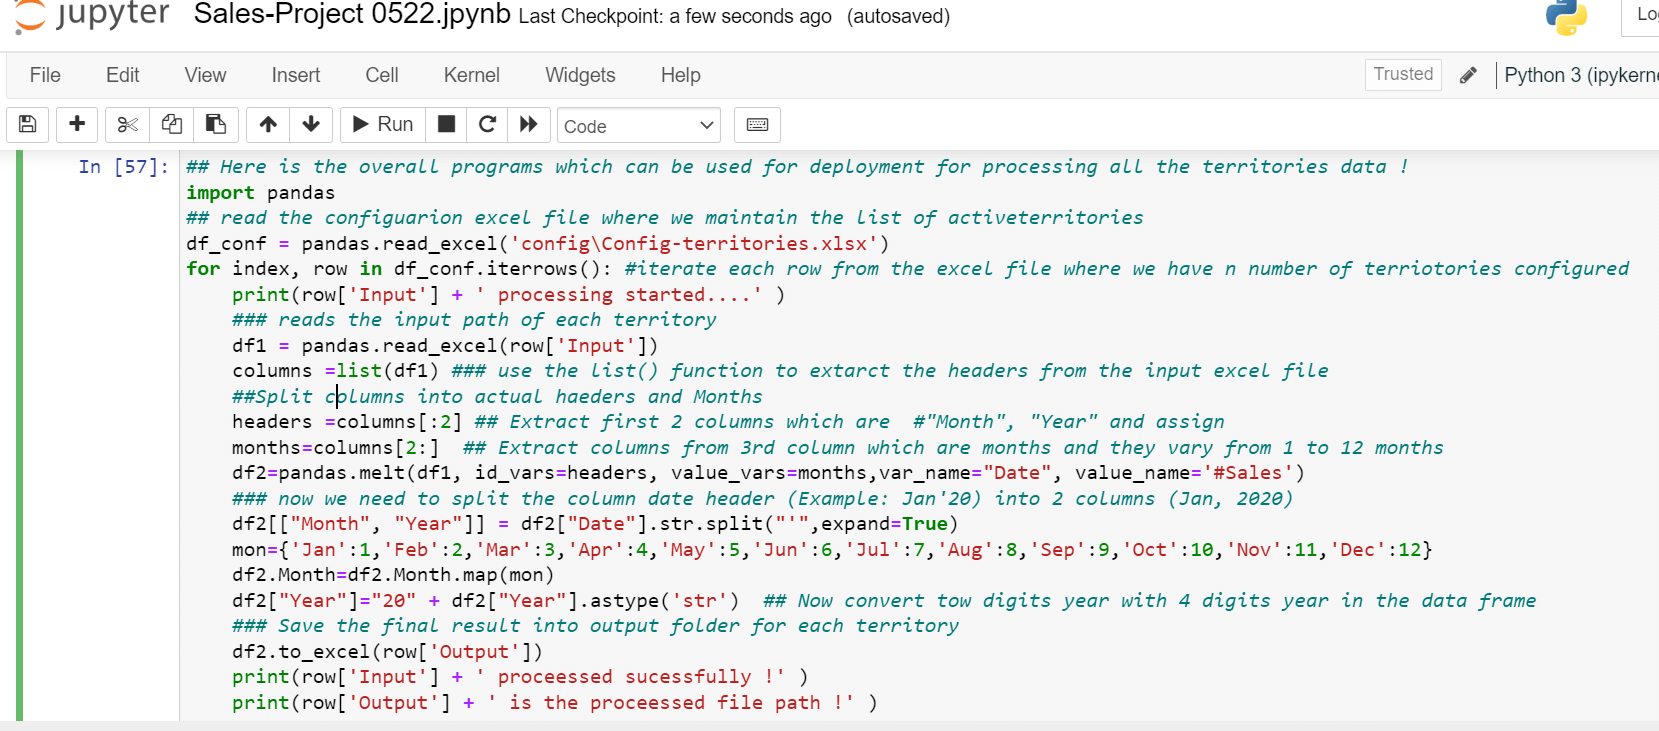
Now each row of the configuration file can be iterated using for loop. The data file can be read and processed as shown below using iterrows()to iterate each row in the for loop.
Conclusion
The major takeaways from this article include:
- Automation of complex manual processes using Python libraries
- Python library’s data frame melt functions usage for unpivoting data
- Transformation and converting of data, such as unpivoting the data and data derivations, can be efficiently performed
References
The attached Sales-Project-Python.zip project contains the following folders and file.
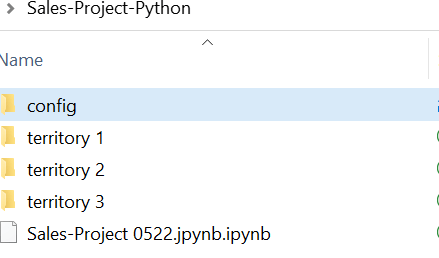
- config: this folder contains the Excel file containing the list of territories that needs to be processed
- territory 1/2/3: contains in, and out folders. “In” folder should the raw data in a pivoted format
- Sales-Project 0522.jpynb is the Juypter notebook to run the whole logic explained in this document
Input sample data
| Territory | Product | Jan'22 | Feb'22 | Mar'23 | Apr'22 | May'22 | Jun'22 |
| Territory 1 | Product 1 | 1000 | 1100 | 1200 | 1300 | 1400 | 1500 |
| Territory 1 | Product 2 | 2000 | 2100 | 2200 | 2300 | 2400 | 2500 |
| Territory 1 | Product 3 | 3000 | 3100 | 3200 | 3300 | 3400 | 3500 |
Python - Jupyter notebook for execution
Output sample file
| Territory | Product | Date | #Sales | Month | Year | |
| 0 | Territory 1 | Product 1 | Jan'22 | 1000 | 1 | 2022 |
| 1 | Territory 1 | Product 2 | Jan'22 | 2000 | 1 | 2022 |
| 2 | Territory 1 | Product 3 | Jan'22 | 3000 | 1 | 2022 |
| 3 | Territory 1 | Product 1 | Feb'22 | 1100 | 2 | 2022 |
| 4 | Territory 1 | Product 2 | Feb'22 | 2100 | 2 | 2022 |
| 5 | Territory 1 | Product 3 | Feb'22 | 3100 | 2 | 2022 |
| 6 | Territory 1 | Product 1 | Mar'23 | 1200 | 3 | 2023 |
| 7 | Territory 1 | Product 2 | Mar'23 | 2200 | 3 | 2023 |
| 8 | Territory 1 | Product 3 | Mar'23 | 3200 | 3 | 2023 |
| 9 | Territory 1 | Product 1 | Apr'22 | 1300 | 4 | 2022 |
| .. | … | … | … | … | … | … |
Juypter Notebook Installation Reference
Pandas Melt function
https://pandas.pydata.org/docs/reference/api/pandas.melt.html
Pandas Data frames
https://pandas.pydata.org/docs/reference/api/pandas.DataFrame.html

