

Managing a production database is a constant balancing act between two conflicting forces: Security and Performance. At the center of this battle lies a seemingly harmless event: the login. Knowing who is connecting to your server, from where, and at what time is the foundation of any security audit or infrastructure troubleshooting. If you don't know who is connecting to your server, you lack one of the most basic controls required for security auditing and troubleshooting.
However, how you choose to capture this data can mean the difference between a healthy server and a 3:00 AM emergency call because no one can connect to the system. If you are currently relying on default instance-level logging, SQL Server Audit, or worse, a Logon Trigger, you might want to reconsider.
Let's explore where these traditional solutions fit and where they can become problematic, and look at the modern, ultra-lightweight alternative you should be using instead, with links to downloadable material for the creation process and querying at the end.
Note: Extended Events are not a replacement for every auditing requirement. If your organization requires tamper-resistant audit trails for regulatory compliance, SQL Server Audit remains the preferred solution because audit files can be protected from administrative modification. Similarly, if you must actively block connections based on business rules, a carefully designed logon trigger may still be necessary.
The Illusion of Instance-Level Settings: The Giant Error Log
The fastest (and worst) path a junior DBA often takes is navigating to Instance Properties -> Security and checking the Login auditing box for "Both failed and successful logins." It seems easy, but it's a performance trap.
Why it fails:
- Error Log Bloat: Every time an application opens a successful connection, SQL Server writes a line of plain text to its error log. In a high-throughput production environment with hundreds of connections per minute, your error log file will balloon by gigabytes in a matter of days.
- Burying Critical Data: Because of the massive file size, you will be forced to recycle the error log constantly. When you need to find a critical system error, it will be buried under millions of lines saying, "Login succeeded for user...".
- Terrible Query-ability: Trying to parse plain text using sp_readerrorlog for reporting or pattern analysis is slow, inefficient, and spikes CPU usage.
The only place I would enable it is in a very low activity instance, i.e. development or test.
SQL Server Audit: Close, But Lacks Operational Finesse
Introduced to satisfy standardized compliance frameworks (like PCI-DSS or HIPAA), SQL Server Audit is a robust tool. You create the server audit object, define a specification using the SUCCESSFUL_LOGIN_GROUP, and point it to a file destination. It’s great for making external compliance auditors smile, but it’s a headache for daily operations.
Why it falls short:
- Connection Pooling Noise: Modern web applications don't constantly open and close real physical connections; they use connection pools. Depending on the application's connection behavior and pooling implementation, SQL Server Audit can generate a large volume of login-related events that may provide limited operational value.
- Lack of Granular Filtering: While SQL Server Audit runs on top of the Extended Events engine under the hood, its interface restricts complex predicates at the server specification level. You cannot easily tell it: "Ignore logins coming from this specific pool, but only if they aren't recovering a broken session." It is all or nothing.
I generally reserve SQL Server Audit for compliance-driven environments, also when the SA should not be able to delete the audit logs, but not before trying other options first.
Logon Triggers: The Hero That Lived Long Enough to Become the Villain
When DBAs realize that the previous options generate too much noise or unreadable text, they often turn to custom code: the Logon Trigger. A logon trigger allows you to execute procedural T-SQL in the exact millisecond a user authenticates. You can query dynamic management views (DMVs), like sys.dm_exec_sessions, check if the incoming SPID is greater than the MIN(session_id) for that user to flag concurrent sessions, and log a clean record into a relational table.
It sounds brilliant on paper. In practice, it is a potential self-inflicted Denial of Service (DDoS) attack waiting to happen. The main issue is the Danger of Synchronous Design. Logon Triggers run synchronously within the login transaction. If your trigger cannot finish its execution, the connection is aborted.
Let's design a simple trigger named "RiskyLogonTrigger", but make sure to read the advice below the code to understand the real danger:
- ON ALL SERVER: means it is server-scoped
- FOR LOGON: fires after the authentication phase but before the session is established
- sys.dm_exec_sessions: server-scoped view that returns one row per authenticated session
-- The kind of code that seems like a good idea, until it locks up production
CREATE TRIGGER [RiskyLogonTrigger] ON ALL SERVER FOR LOGON
AS
BEGIN
    -- If this DMV query slows down due to metadata contention...
    IF (SELECT COUNT(*) FROM sys.dm_exec_sessions WHERE login_name = ORIGINAL_LOGIN()) > 10
        ROLLBACK; -- Nobody else gets into the server!
END;
Why they break production:
- The Bottleneck Effect: If your internal query suffers from read contention (for example, performing a heavy string-based JOIN against system views without statistics), the login process can jump from 2 milliseconds to 8 seconds. Application connections will immediately begin to experience Connection Timeouts in highly concurrent workloads, preventing the login.
- Total Lockout: If you make a syntax error, if the audit log table runs out of disk space, or if metadata locks occur, the trigger fails and rolls back the connection. The result? In the worst case, a faulty logon trigger can prevent normal administrative access and require emergency recovery procedures.
In my environment, I typically use logon triggers only on servers with low login concurrency because they are easy to integrate and because I can enforce connection policies for service accounts.
Server Trace: The Tactical Cybersecurity Weapon
While we often focus on avoiding performance pitfalls, sometimes you need surgical precision during an active security incident. Although SQL Trace is a deprecated technology, it can still be useful as a temporary forensic tool during incident response. A server trace has a great advantage: it captures the IP where a connection attempt is being made.
I have enabled it for cybersecurity threat hunting, because the host name wasn’t enough to discover where the adversary was coming from, and once blocked I got back to traditional means. While modern events might require extra configuration to reliably pull client IPs, Server Traces log this natively, providing immediate, actionable intelligence to feed into your firewall configurations or SIEM dashboards. Think of it not as a permanent monitoring solution, but as an emergency diagnostic instrument.
The Modern Solution: Asynchronous Extended Events (XEvents)
If instance logs bloat your disk, SQL Server Audit lacks the filtering flexibility you need, and triggers risk locking down your server, what is left?
For most operational monitoring scenarios, a carefully designed Extended Events session provides the best balance between visibility and performance. By configuring an XEvent session specifically for the sqlserver.login event, you leverage SQL Server's modern architecture: it is asynchronous (it does not block the user's connection thread), runs on a highly efficient background thread, and consumes a strictly controlled memory buffer.
In a production environment averaging 20,000 login events per day, the session generated less than 5 MB of XEL data daily while maintaining no observable increase in login latency.
The real power of Extended Events lies in its Predicates (Smart Filters). When creating the session, you can filter out events before they ever hit the disk:
- WHERE is_cached = 0: In many environments this eliminates the vast majority of connection pooling noise, capturing only brand-new physical connections.
- WHERE is_recovered = 0: Prevents logging transparent automatic reconnections caused by minor network drops.
The data is saved natively into a highly efficient binary .xel file. When you need to run complex auditing or timeline metrics (such as tracking concurrent sessions over time), you simply run an external T-SQL query to parse the XML. Performance is preserved, and production is never disrupted.
Choosing the right tool
Let's make a comparison of all methods described earlier: their performance impact, queryability, operational risk and best use case, based solely in my experience with them.
| Method | Performance impact | Queryability | Operational risk | Best use case |
| Error Log | Medium-High | Poor | Low | Temporary troubleshooting |
| SQL Audit | Low | Good | Low | Compliance |
| Logon Trigger | Variable | Excellent | High | Controlled environments |
| Server Trace | Medium | Good | Medium | Incident response |
| Extended Events | Low | Excellent | Low | Operational monitoring |
If you consider Extended Events is the right choice for your monitoring of successful logins, there are two ways to create it. At the end of the article, you can find a link to the script to automate the creation. Below I describe how it can be created through SSMS if preferred.
Step by step creation of an Extended Event session in SSMS
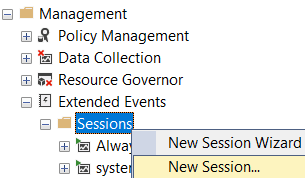
Go to Management --> Extended Events --> Sessions --> New session. Make sure you don’t select the wizard because it doesn’t allow you to filter the actions.
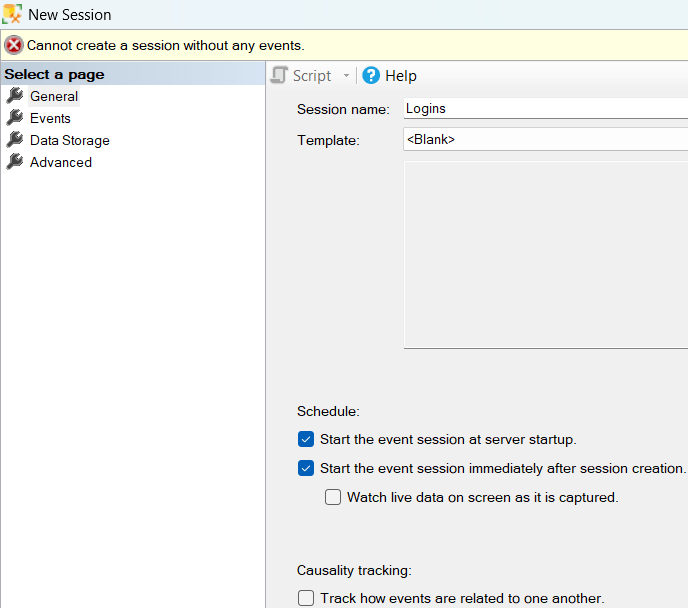
Enter a session name, select to start the event session at server startup so you don't have to start it manually after the service restarts for any reason, and select to start the event session immediately.
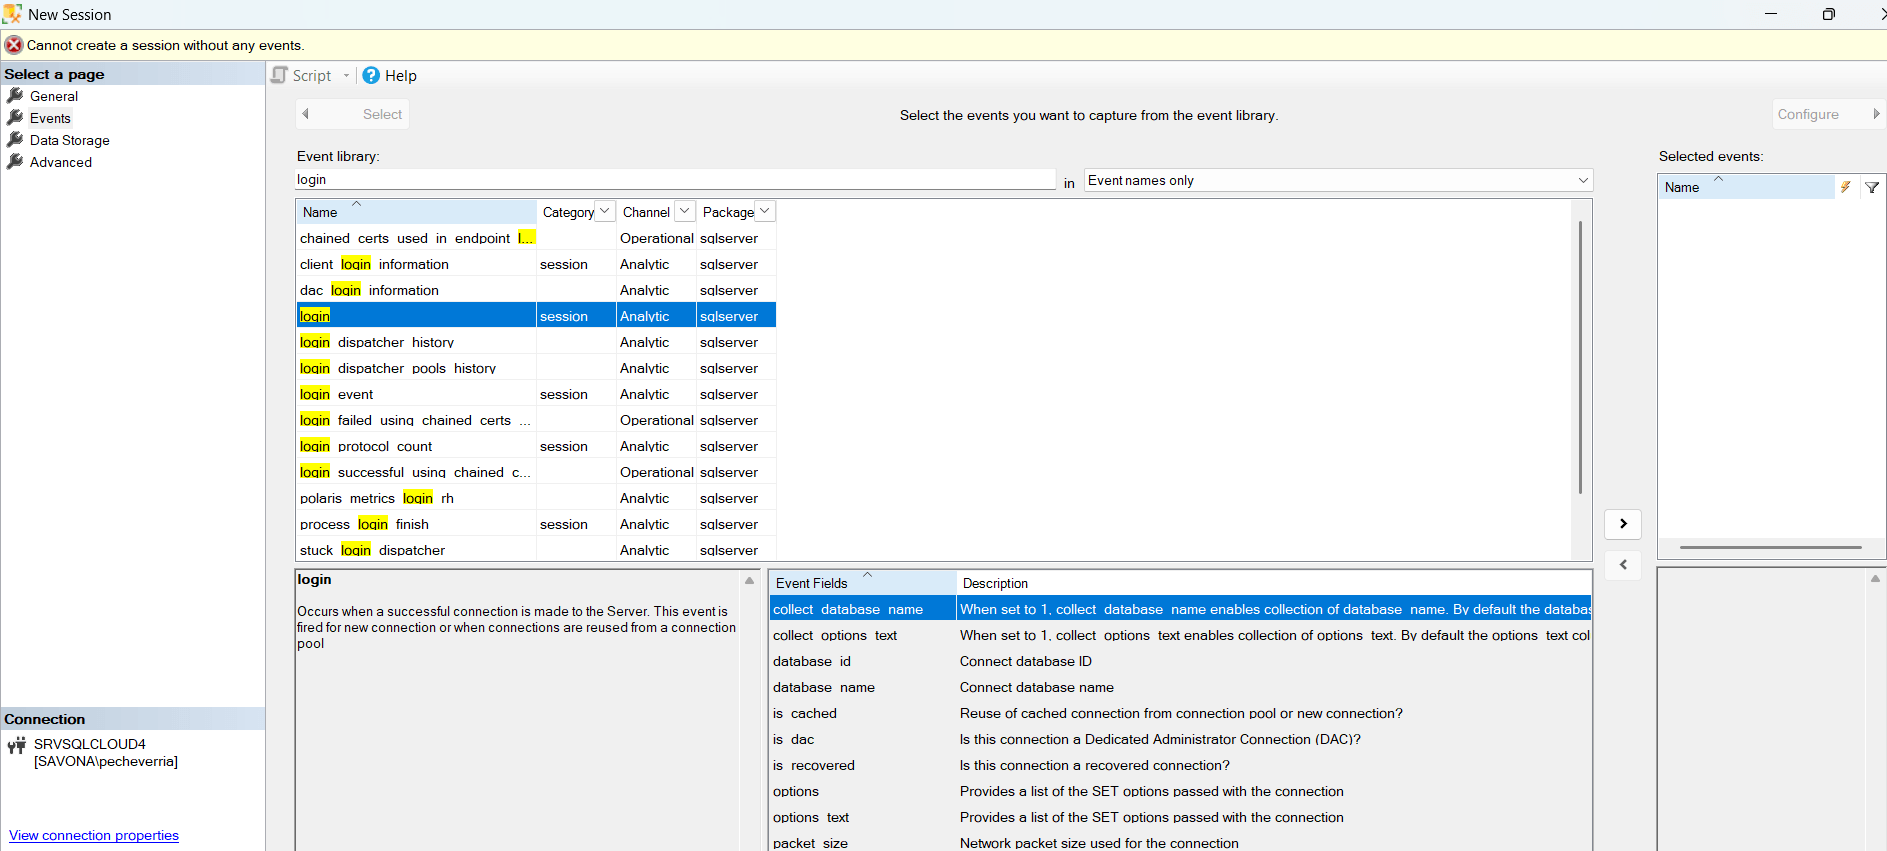
Go to Events, type “login” and select that event.
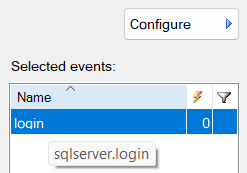
In the right pane, select it and click the upper right button “Configure”.
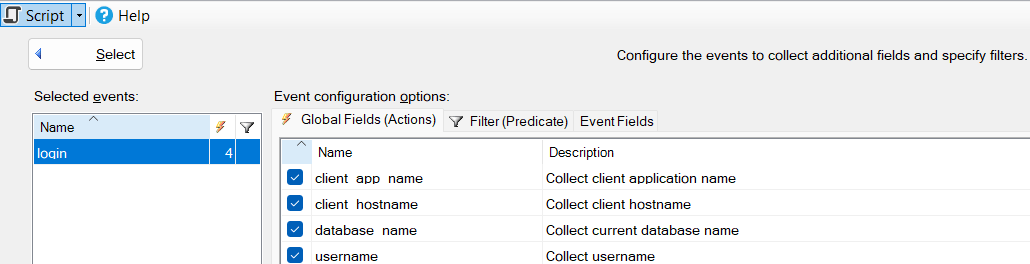
Choose the actions: client_app_name, client_hostname, database_name and username. The client app name helps you determine if service accounts are being misused, the client hostname helps you determine if users are connecting from their personal computers or from servers, and the database name helps you determine if they're trying to connect to a database they shouldn't.
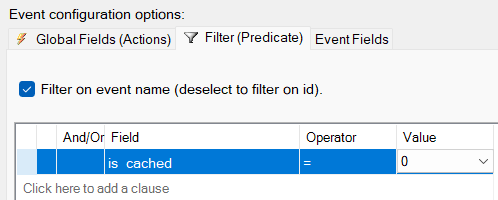
Select the next tab “Filter”, select the field “is_cached”, select the operator “=” and set the value “0”. This will remove around 90% of session reconnects, which will make your log smaller because just the original connection contains all information we're interested in.
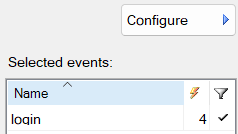
Click on the upper left button “Select” and make sure it shows the actions and filter.
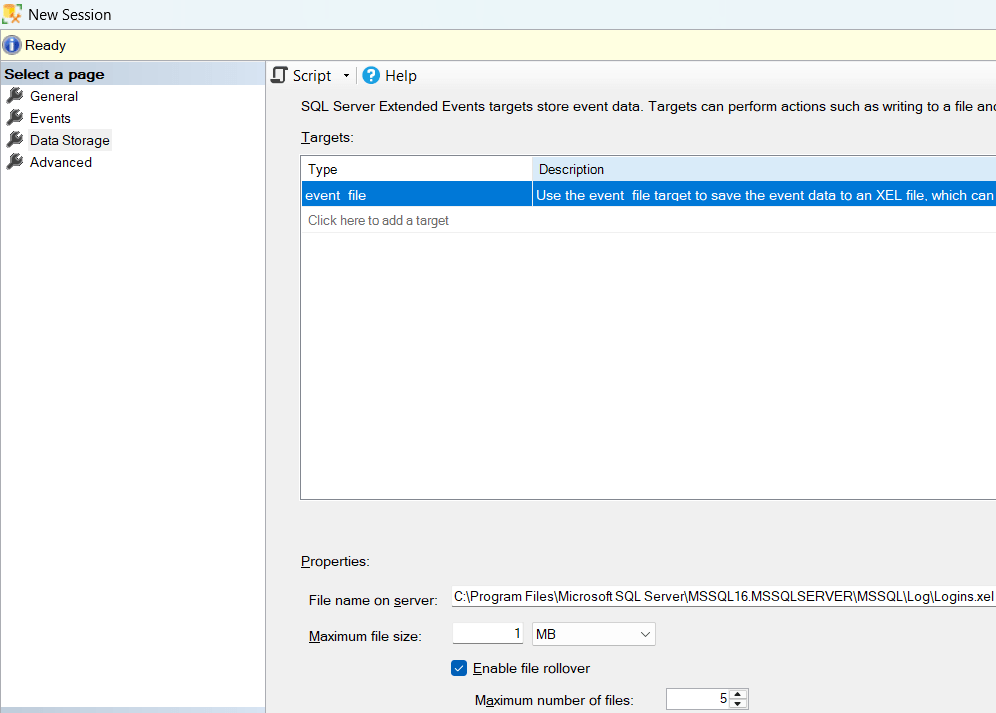
Select on the left pane “Data Storage”, select the type “event file”, enter the full path and name, select maximum file size 1 MB, and choose to enable file rollover with a maximum of 5 files. These are the values I use in an extremely busy server, because it is big enough thanks to the filter we applied, and its memory footprint will use a minimum amount of CPU without affecting the production processes. (Tip: You can see where the default trace is being saved to use a similar path with this query: SELECT path FROM sys.traces WHERE is_default = 1;).
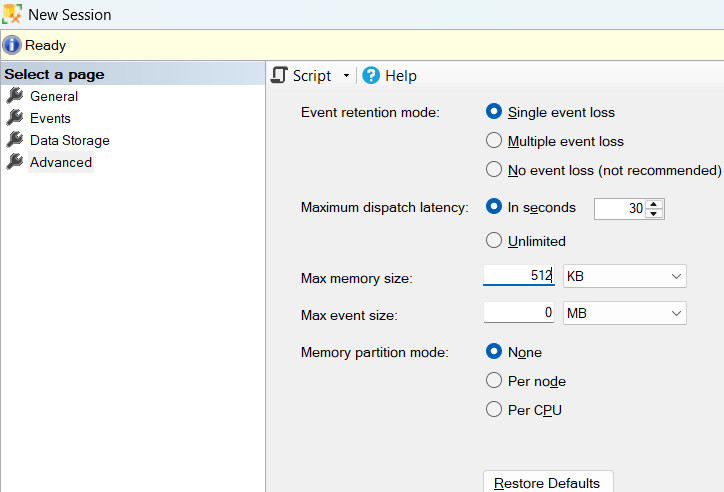
Select in the left pane “Advanced”, select single event loss, enter maximum dispatch latency 30 seconds, enter max memory size 512 KB, enter max event size 0 MB, and select memory partition mode none. Single event loss minimizes both performance impact and data loss at the same time. A maximum dispatch latency of 30 seconds reduces I/O to disk, grouping a single write with all records captured during those 30 seconds. A max event size of 0 MB allows the engine to manage the events within the 512 KB memory block defined earlier. The memory partition mode set to none creates a single global memory buffer for the whole server, reducing the performance impact on the server.
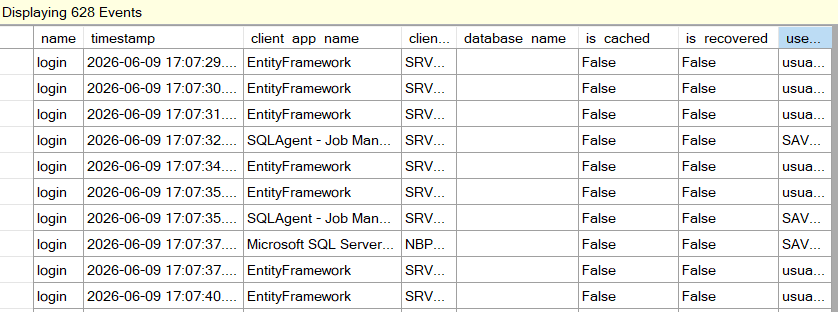
Now, if you right click the event session and choose “Watch live data”, you will start seeing these pure, unfiltered events:
Conclusion
The goal of login monitoring is not simply to collect data, but to collect actionable data without introducing new operational risks. In production environments, the best auditing solution is not necessarily the one that captures the most data—it is the one that captures the right data with the least operational impact. Monitoring database logins shouldn't threaten your server's uptime. The legacy mindset of intercepting active connections with heavy synchronous code or enabling massive text logs belongs in the past. By shifting your auditing strategy to Extended Events, you get the best of both worlds: the clean, structured data your business security requires, with the near-zero performance footprint your production infrastructure demands.
Before enabling successful login auditing in production, take a moment to evaluate whether you're collecting meaningful data—or simply generating overhead.
Want to see the code in action? I’ve uploaded the complete scripts to deploy this lightweight Extended Events session to my GitHub repository: https://github.com/pabechevb/SQLServer/blob/main/Logins_Extended_Events_Session_Create.sql
I’ve also published an optimized T-SQL query to parse the data without hurting performance, which can be integrated into any of your monitoring solutions: https://github.com/pabechevb/SQLServer/blob/main/Logins_Extended_Events_Query.sql
Below are sample results from the query in the link above. You can see how they're grouped to show only two columns: DateTime and Message, containing all relevant data in a format similar to what Microsoft logs. This allows to be easily integrated in your existing monitoring solutions.


