I find Power BI to be a neat way to visualize data, one that allows interactivity to help analyze the results in a report. I decided to use Power BI last year to share some data with the kids I coach and worked on a way to help them understand some statistics we capture. It took awhile, and it was an interesting process where I learned how to store data, update it, and publish a report anyone can view, even outside of your organization.
This post looks at part of what I learned, how I linked data in a Google Sheets spreadsheet to a Power BI report and made this available publicly. The idea here is that you can do the following:
- Store data in Google Sheets
- Link a Power BI report to this data
- Publish this report into Powerbi.com
- Let anyone view this without an account
The journey to do this wasn't hard, but it wasn't intuitive. Hopefully, this post will help you experiment with Power BI and publish your own reports for fun.
For this example, I'm going to use a small data set based on my participation in the American Cancer January Rowing Challenge. I've been tracking my work each day and built a report to see how I compare with my goal.
Google Sheet Data
While I could use a database, it's expensive. Some of my needs are low volumes of data, low frequency of updates, and the need to present raw data to others. For someone that wanted to share some data with friends, I need something simpler than a database to do that. Google Sheets fits a simple need for making a data set available publicly.
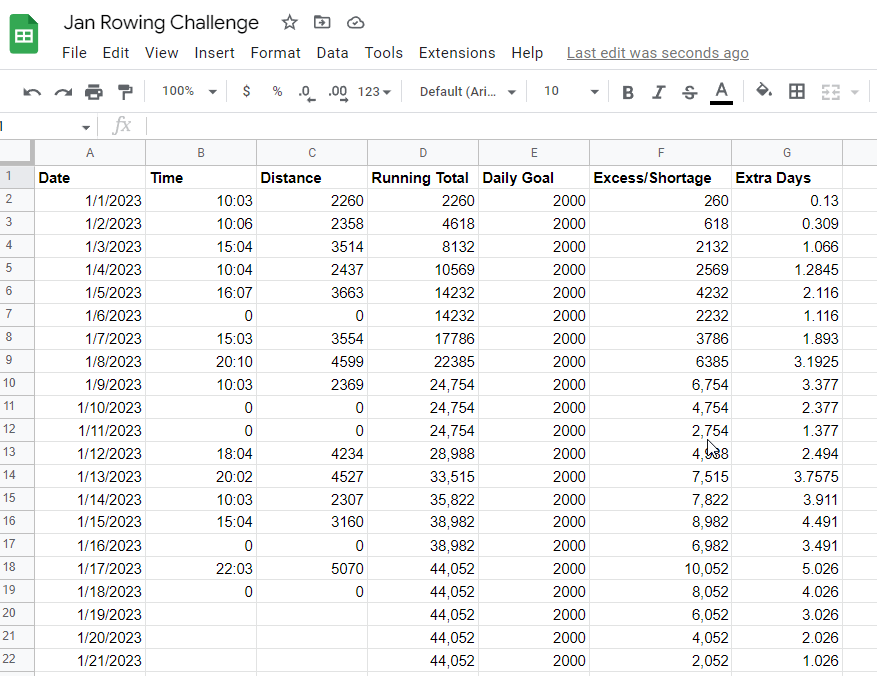
My sheet is shown below and is fairly simple. I enter some data in the B and C columns. The E, F, and G columns calculate some values based on that data.
To add this to my Power BI report, I needed the URL for this sheet, which I got by clicking the "Share" button in the upper right. This gave me a dialog like the one shown below. I set the bottom portion of this dialog to allow anyone with the link to view the data, which is what Power BI will do:

This gets my data available, now on to Power BI.
A Power BI Desktop Report
I like working in Power BI Desktop. I can muck around with data and experiment with visuals without the limitations of a web interface. I can save off my .pbix files and work with them offline. There might be a better way to make simple reports, but I prefer this application.
When I start a new report, I use the Get Data option. In here, I can enter "Sheet" in the search and find the Google Sheets option. I pick this and click Connect.
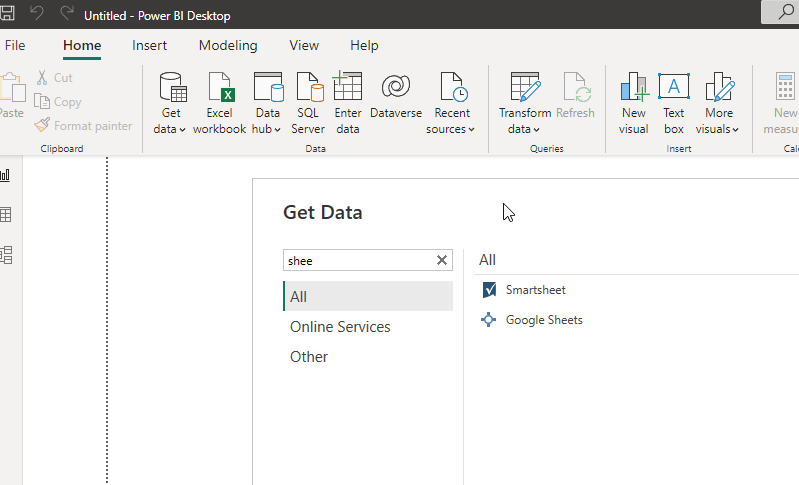
Once I do this, I get a new dialog where I enter my URL.

This will connect and I can preview my data. There is a little work to get data ready, but I'll cover that in another article. For now, get data into Power BI.
Once my data is loaded, I can build a report, which I've done. I'll also cover how I set up this report in another article. Here's what I see in Power BI:
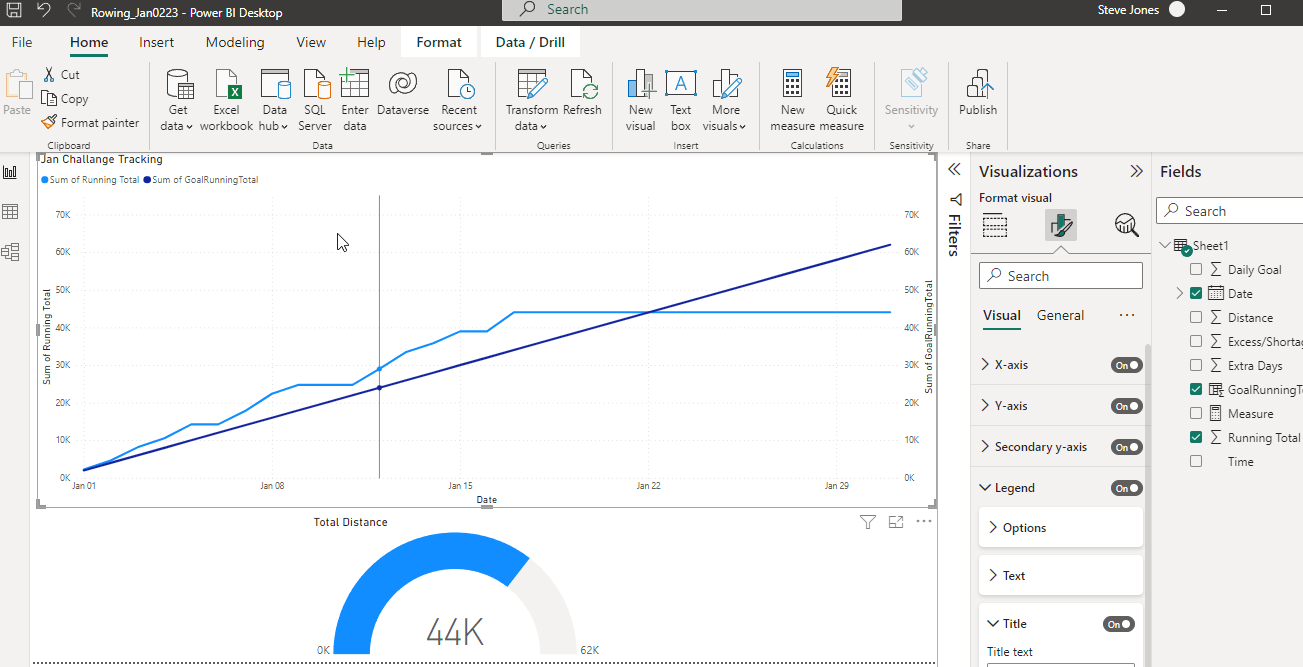
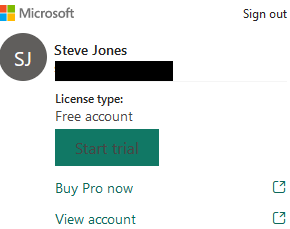
The details of the report aren't important. What is important is that I've logged into PowerBI.com, which you can see because I have an account in the upper right with my name. I created a free account with my personal email, so this isn't associated with any organization. If I log into powerbi.com, I can see the details of my account, which I've shown here:
Since I've done this, I can click the "Publish" button in Power BI and send this report to my account. This brings up the Publish dialog. I didn't know what to do here, but accept the default "My workspace" and click Select.
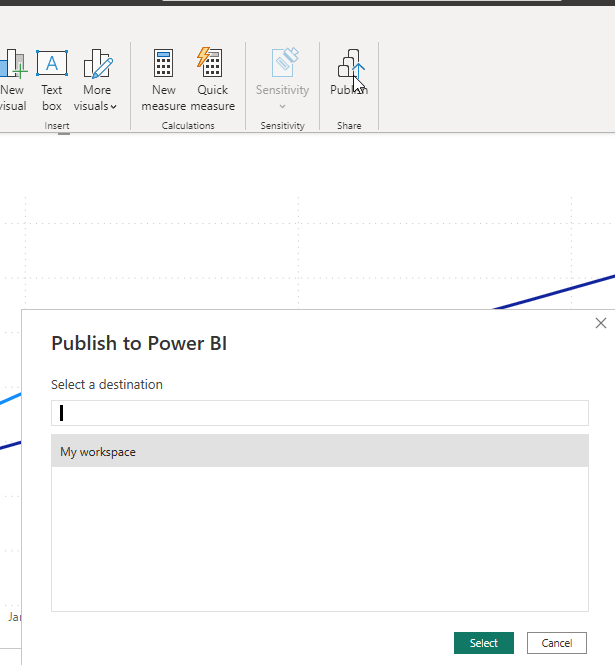
This appeared to work as I saw the publish process start.
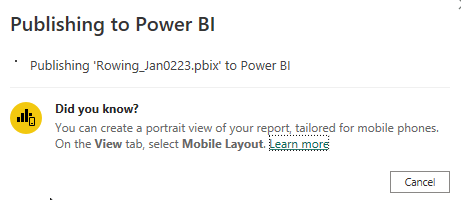
Once that's done, I can go to the Web.
Publish to Web
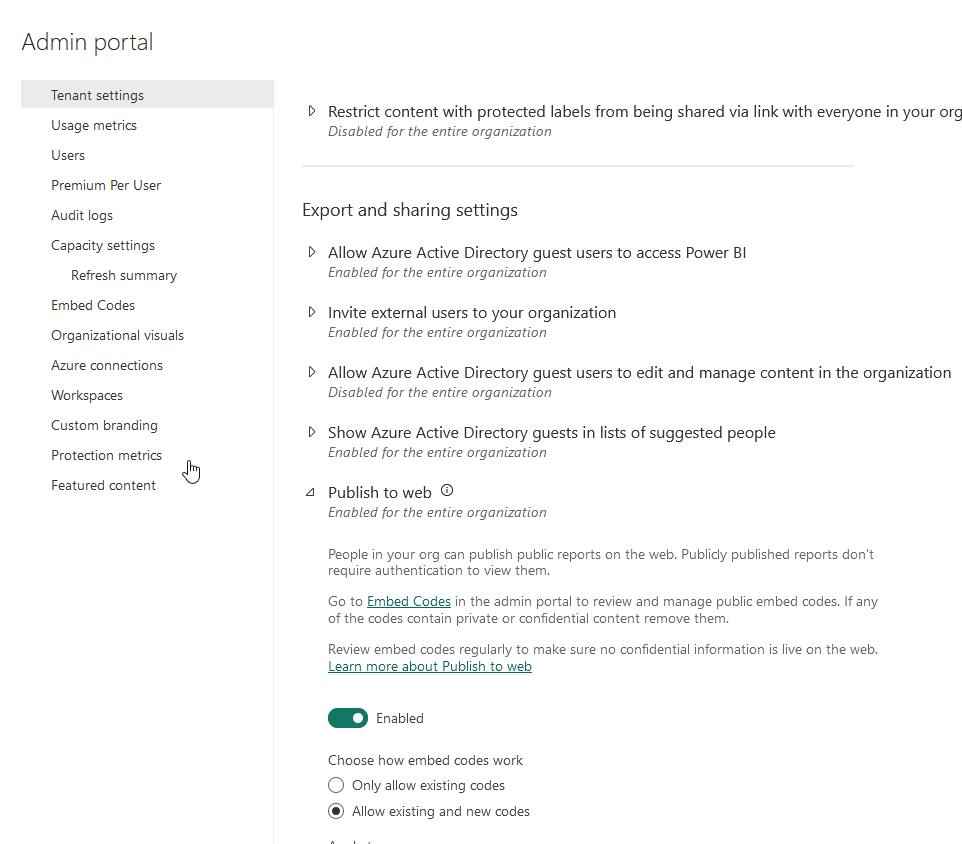
I found references to Publish to Web, but it didn't work at first for me. I had errors in my powerbi.com workspace. For me, this is an app.powerbi.com/admin-portal URL where I can see my report. Once the publish from Power BI Desktop completed, I went here and saw my report, but couldn't publish to web. I found that I needed to go into the tenant settings and enable this feature. When you get the Tenant Settings, scroll down a bit to find this and click Enabled:
At this point, I coudl go to my workspace and find my report. Clicking this opened the report, which looked a lot like Power BI Desktop embedded in a browser. There was a File menu, and under that was the "Embed report" option, with a "Publish to web" submenu.
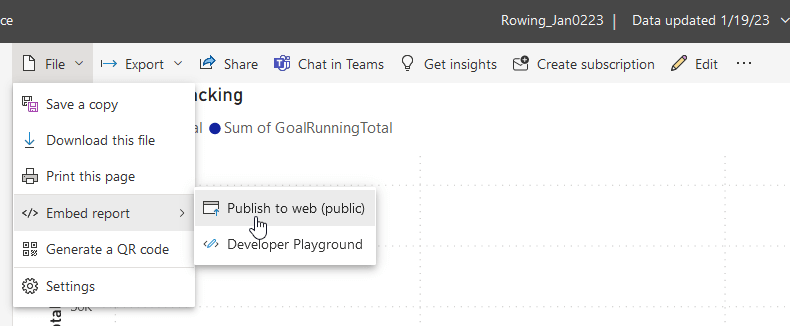
Once I click this, I got the message to create an embed code. Since I'd enabled this in my settings, this worked. I clicked Create (shown below).
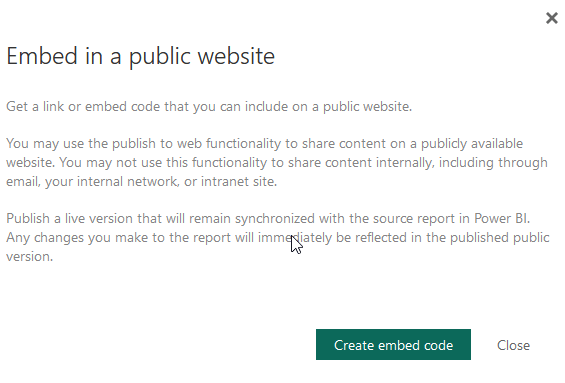
This ran quickly and I got a success message. In this, there was a URL I could hope (or HTML code). I clicked Copy and then opened a private browser window.
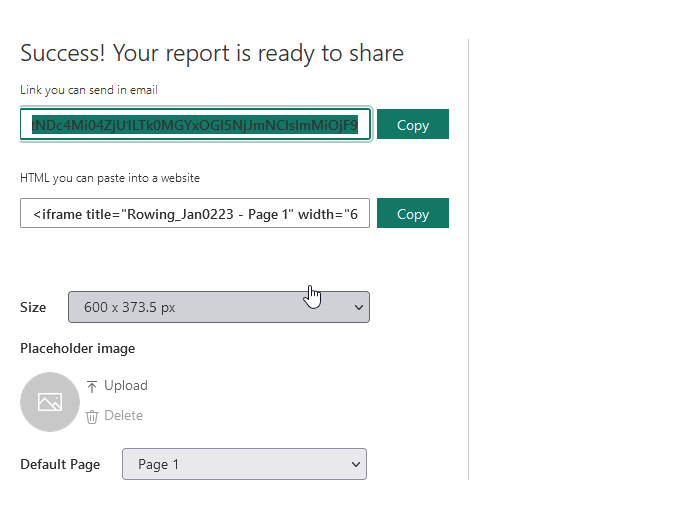
When I go to the URL, I can see my report. It is shown below, or you can click the link and see the interactive report that allows you to see the data at any day.
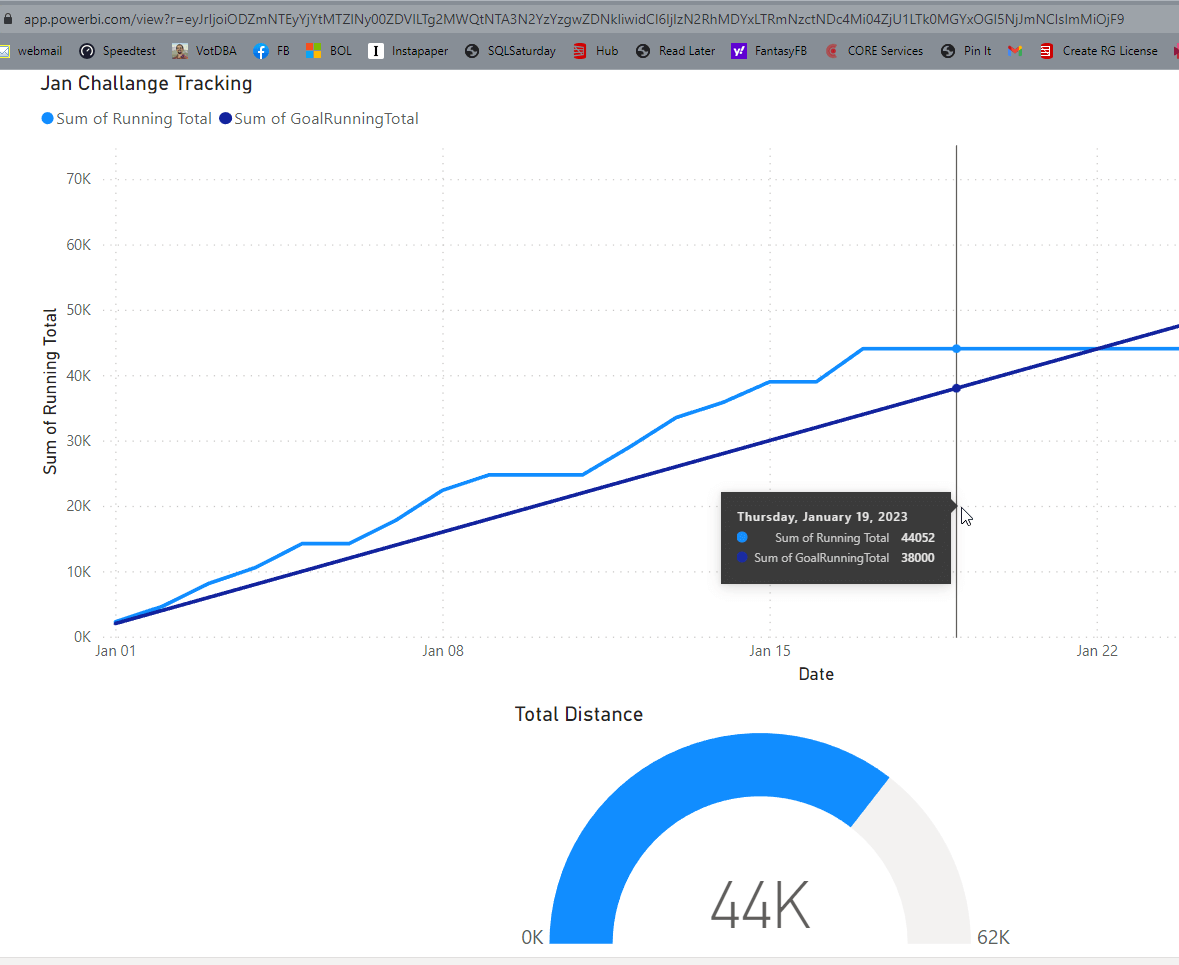
The image shows me mousing over Jan 18, which is the day I'm finishing this article. So far I'm ahead of the pace by about 6,000m, or 3 days worth of rowing. A good thing since I'm taking today off.
Summary
I skipped over some details of the report and data, but if you create your own data and report, you'll be able to share data on the web with others. That was the point of this article.
Using a public source, and then enabling the publish to web option, you can deploy a report to PowerBi.com and send the URL to others. Now I need to update the report a bit with a title and some other information.


