

Introduction
Power BI is a collection of software services, apps, and connectors working together. It helps to connect different data sources and get visually immersive and interactive insights from the data. Power BI creates powerful reports to be shared with others, as required. Data may be connected from different sources including files, databases, Azure services, Power Platform, etc.
If you need an introduction to Power BI, read Analyze Azure Cosmos DB data using Synapse Link and Power BI – SQLServerCentral. This has general information and a detailed case study on one of the components, named Power BI Desktop.
In this article, I will discuss the Power BI service. I will explain the step-by-step process for creating a Power BI service and using it to generate a report from an Excel spreadsheet data source.
Power BI Service
Microsoft's Power BI service is a SaaS (Software-as-a-Service) component of Power BI. It is known as Power BI Online as well. Power BI has five major building blocks: dashboards, reports, workbooks, datasets, and dataflows. These items are organized into workspaces, and they are created based on capacities. I will discuss each of the concepts below.
Capacity
Capacity represents a set of resources (storage, processor, and memory) used to host and deliver Power BI content. A shared capacity is shared with other Microsoft customers. A dedicated capacity is fully committed to a single customer. By default, workspaces are created on a shared capacity.
Workspace
A Workspace is a container for different items, like dashboards, reports, workbooks, datasets, and dataflows. There are two types of workspaces in Power BI.
- My workspace: This is my personal workspace. Dashboards and reports can be shared from this workspace.
- Workspaces: This workspace is used to collaborate and share the content among the people of my organization (having email ids in the same organization domain).
Dataset
A Dataset is a collection of data imported from a source. A single dataset can be used to create many different reports. A dataset can be part of one or more workspaces. Any visualization generated from a dataset can be displayed on multiple dashboards.
Dashboard
Dashboard is a single canvas that contains zero or more tiles. There are different ways to add tiles in one dashboard. A dashboard can be part of a single workspace. It can be shared with people in different ways. A dashboard can display visualizations from many different datasets and reports.
Report
A report is one or more pages of visualizations or visuals. All of the visuals come from a single dataset. One report may be associated with multiple dashboards within an workspace.
Workbook
A workbook is a special type of dataset. When I use an Excel file as a data source, there are two options to load the data in Power BI. I may import or upload the Excel file. If I go for the upload option, then a workbook is created. For the import option, a dataset and dashboard are created.
The workbook works like an Excel document in Power BI. It is possible to select a subset of the sheet and pin it to a dashboard.
Dataflow
A Dataflow helps to create reusable transformation logic on the source data that can be shared by many datasets and reports inside Power BI. Underlying data elements are reusable. So, Power BI Desktop and the Power BI Service may use the data and the business logic from the dataflow multiple times for creating datasets, reports, and dashboards.
Dataflows are only created and managed in workspaces , not in 'My workspace'. Dataflows are stored as entities in the Common Data Model (CDM) in Azure Data Lake Storage Gen2.
Implementation
I will first create a Power BI account. After logging into the Power BI service, I will connect to an Excel data source and generate reports from the data source. Also, I will discuss the different features of Power BI service. I will create a report in Power BI Desktop and then will publish that report to the Power BI service.
To create a Power BI account, I need an email address provided by the organization I am working with. The email address created in a specific organization domain, is known as an organizational email id. Microsoft Power BI is designed to be used by people within a company. So, all the users having the email addresses created in the same domain of a company may be visible to each other and the users can share the work with their colleagues working in the same company. Email addresses created from free services, like outlook.com, are known as personal email ids. Personal email ids cannot be used to create a Power BI account.
Power BI Home Page
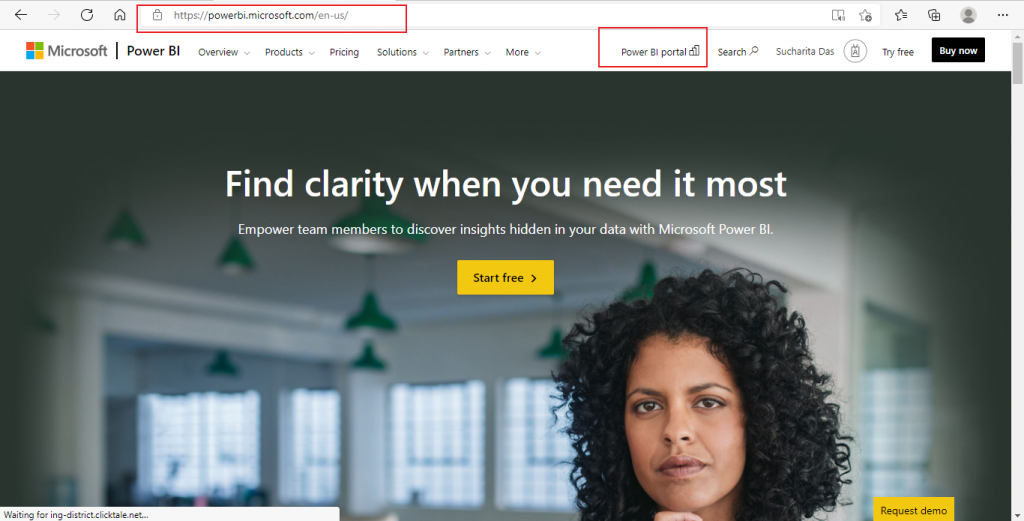
I go to the Power BI home page, Data Visualization | Microsoft Power BI. I create a new free account by pressing the 'Start free' button. I use my organizational email id to create the account.
Once logged in, I press the link for the Power BI portal on the top bar of the web page.
My workspace
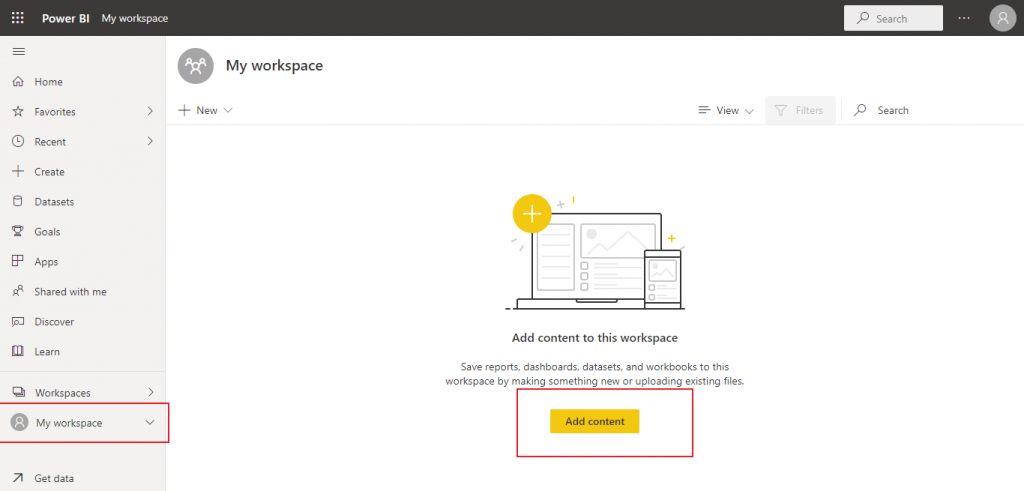
I click on the My workspace link on the left panel. Here, I need to add a new content to start working. I press on the Add Content button in My workspace.
Get data from file
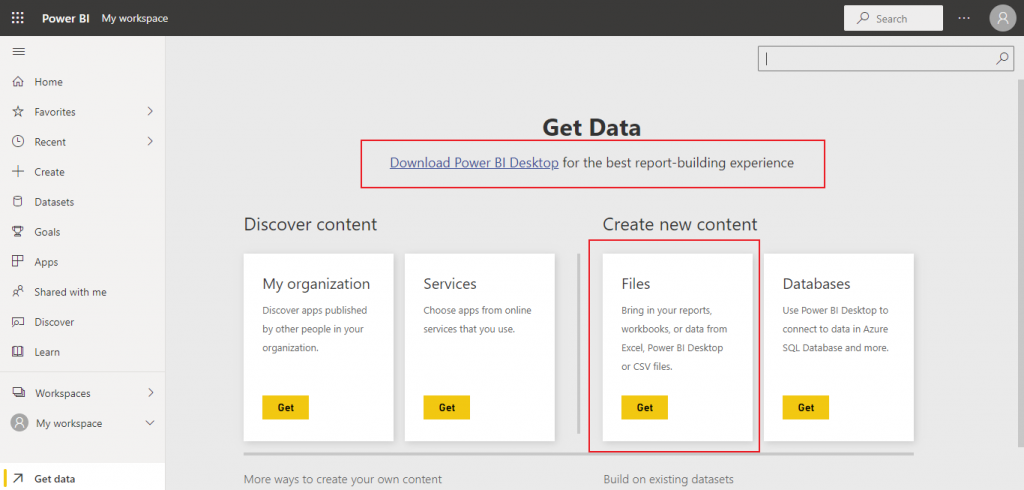
In the next screen, there are a few options available to get data. I may create new content from the existing files and databases. Also, I have an option to get data from the content already published by other people within the same organization. I press the Get button for Files.
Note: In the Get Data page, there is a link given for downloading the Power BI Desktop to my local machine.
File location
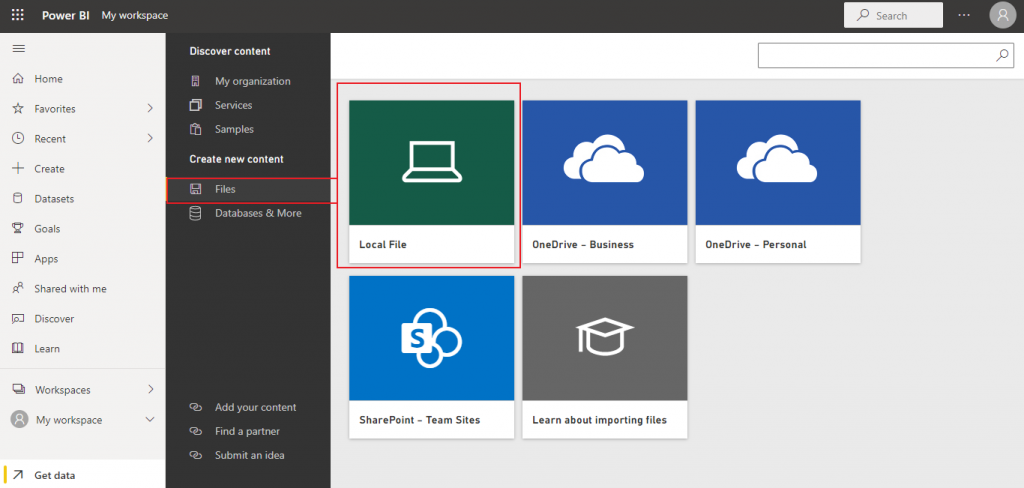
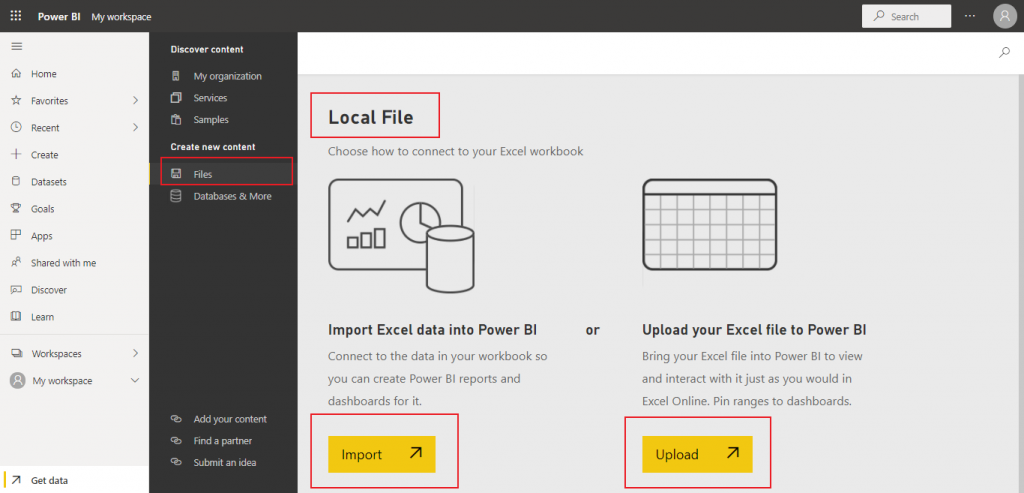
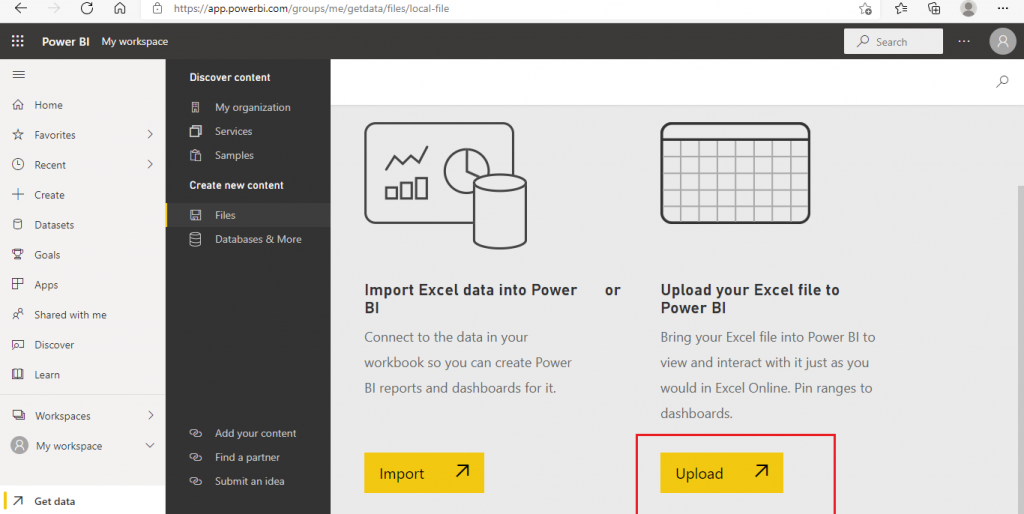
In the next screen, I need to choose the source for the data file. I may select the file from my machine, OneDrive, or SharePoint. I click on the Local File icon and select an Excel document from my local folder.
Connect to Excel workbook
After selecting the Excel file, I have two choices. I may import the file to create a dataset or upload the file as an workbook.
For now, I click on the Import button.
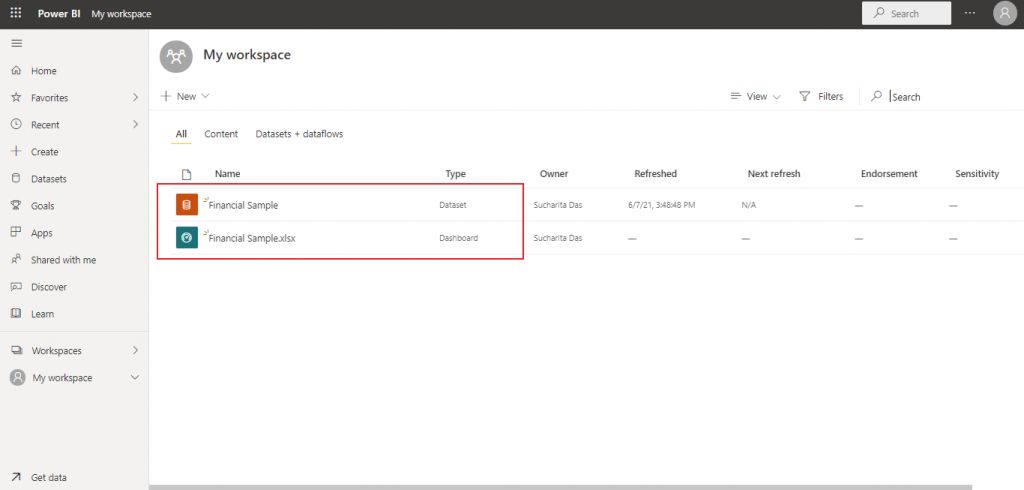
Dataset and Dashboard
I am back to My workspace. Here, one dataset and one dashboard are created for the imported Excel document.
I click on the dataset.
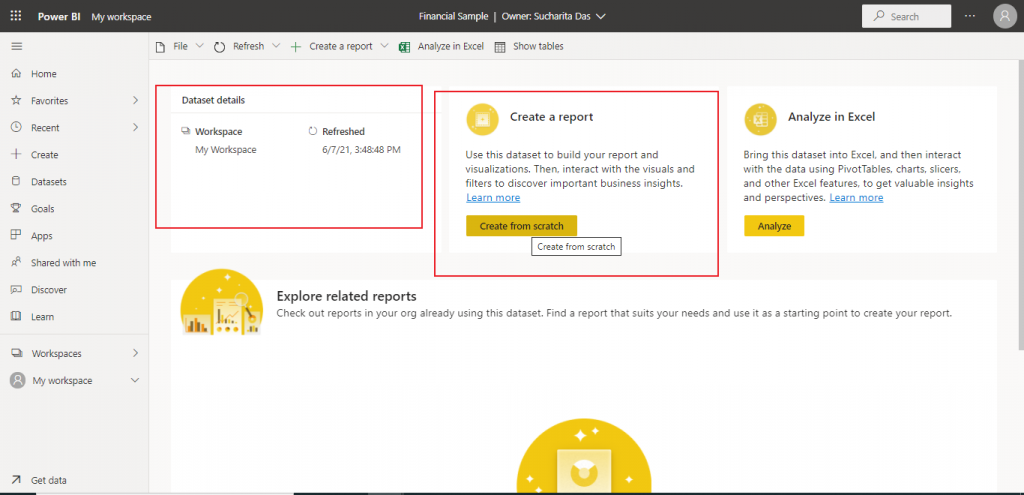
Operations on the dataset
I have two options to work on the dataset. I may create a report or analyze the data in an Excel file. I press the button for creating a report from the dataset.
Create a report
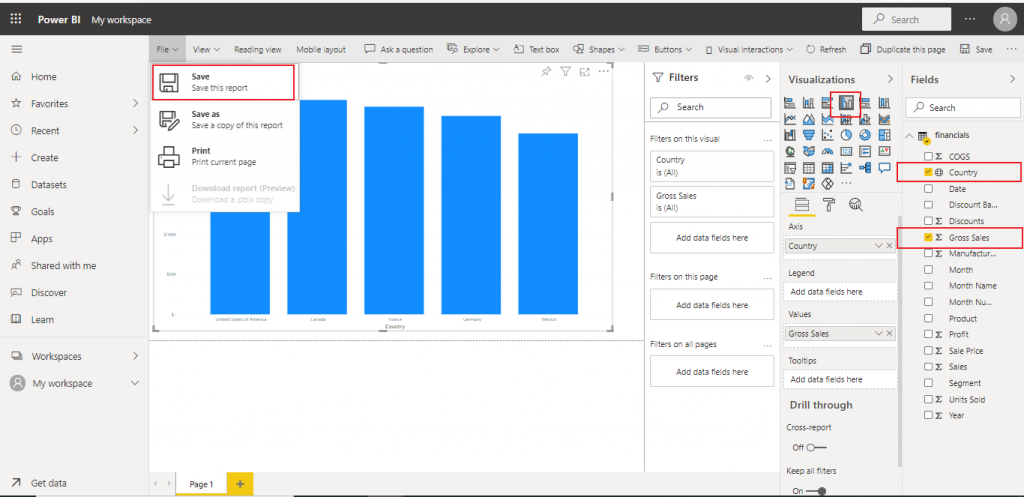
I am in the Report Editor window now. There are many different choices to create a report.
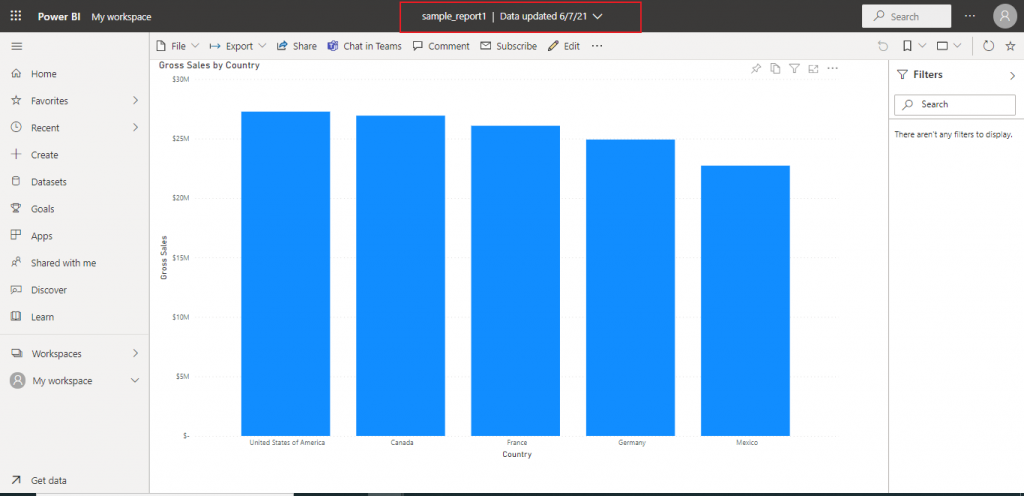
I select Country and summation of Gross Sales from the Fields window and select the clustered column chart from the Visualization window. I may filter some records of the dataset in the Filters window. The column chart is now drawn where each column contains the total Gross Sales value for each country as available in the dataset. From the File menu, I save the report.
Open the report
The report is now available in My workspace. I open the report from there. I may pin the report to a new or existing dashboard. Also, I may share the report with others in different ways.
Operations on Dashboard
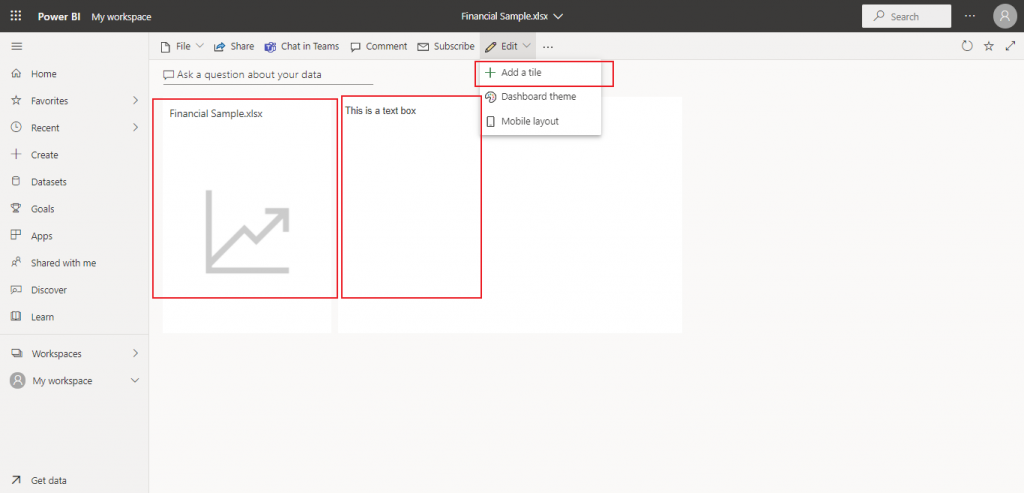
I go the Dashboard created for the imported Excel document. There is a tile present for the Excel document. If I click on this, the report editor opens where I may create report from the underlying dataset.
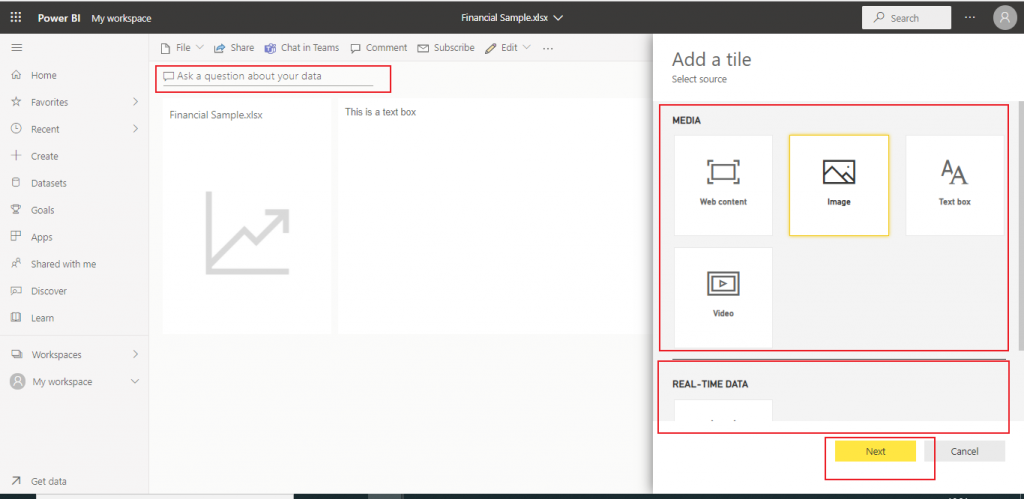
I click on 'Add a tile' menu item. A pop-up window opens with four types of tiles to be created: Web content, image, text box, and video. I click on Text box and add some text. Now, the text box tile is also added to the dashboard beside the Excel tile.
Q & A and tiles in the Dashboard
At the top of the Dashboard, there is a Q&A section. Here, it is written 'Ask a question about your data'. Power BI Q&A is free and available to all users. It allows the users to ask natural language questions about the dataset and get answers in the form of visuals.
I click on the Q&A button.
Q & A result data
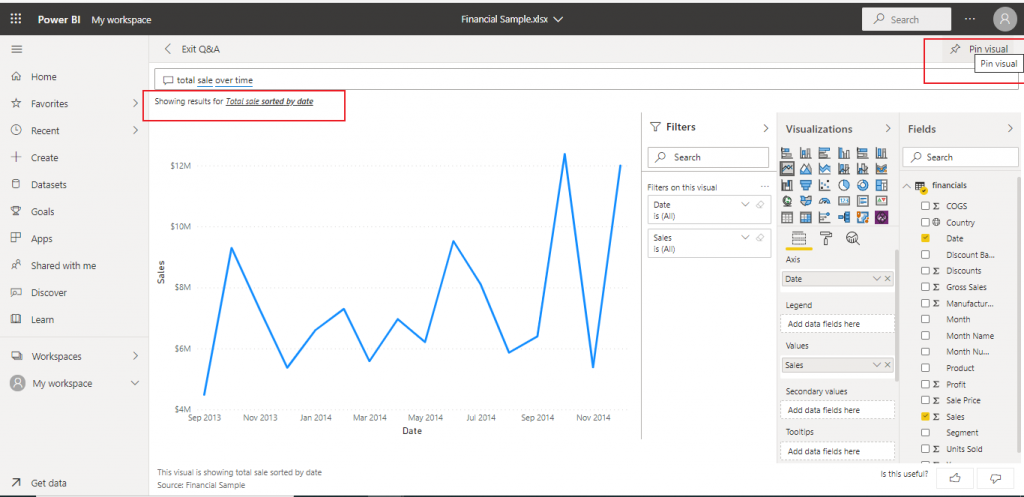
I may write a question here or select a question from the suggestions given. I select a suggested question: total sales over time. The result is generated in the form of a visual where the total sales value is plotted against the timeline.
I click on the 'Pin visual' link.
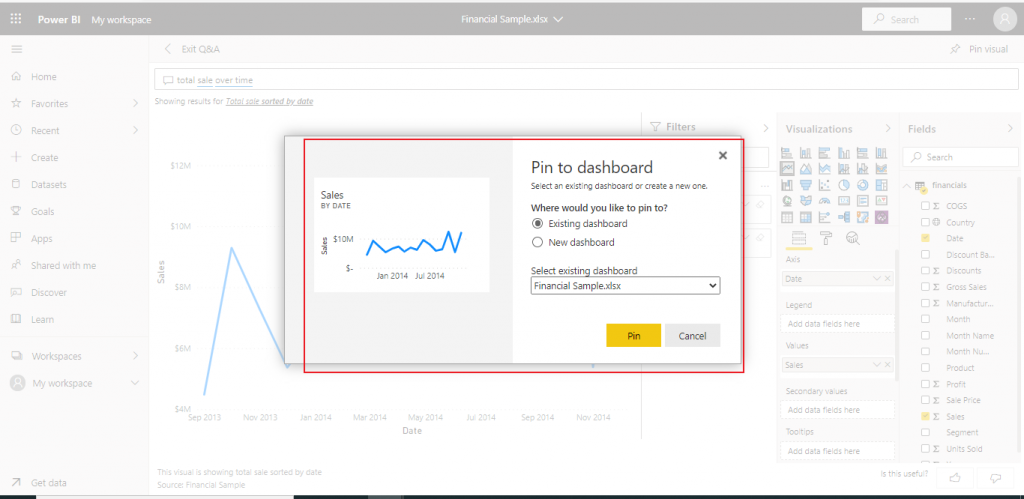
Pin to Dashboard
A pop-up window opens where I may select a new Dashboard or an exiting one to pin the visual. I pin the report to an existing Dashboard.
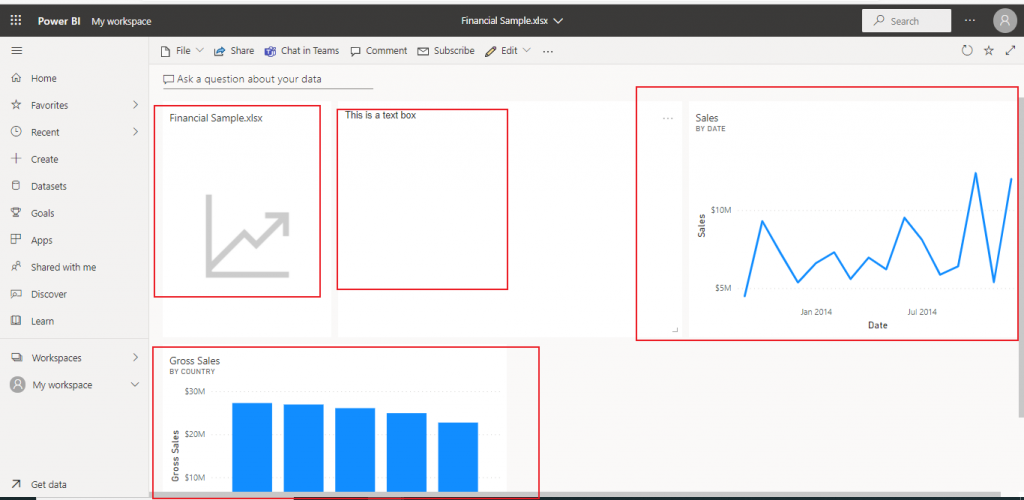
The Dashboard
I return to the Dashboard again. The report created from the dataset earlier and the report generated through Q&A both are pinned to this Dashboard now.
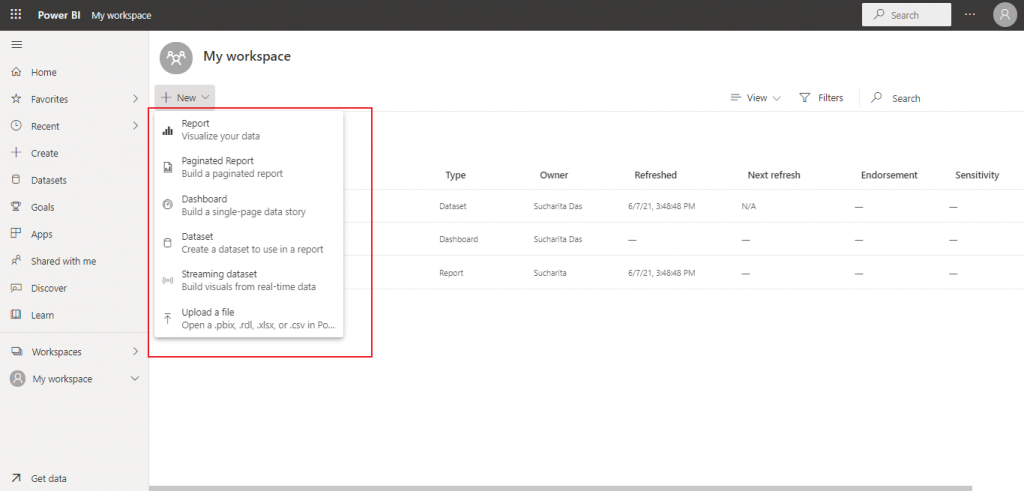
Menu items in My workspace
In My workspace, I click on the New button. A pop-up window opens with a few options. I may start creating report, dashboard, dataset, etc. from here. If I click on Paginated Report, I will be redirected to Power BI Report Builder where the paginated report may be created and later may be shared with Power BI service.
I click on the 'Upload a file' option.
Upload a file
I select an Excel file from my local drive and click on the Upload button. If I choose any file other than Excel workbook (for example, CSV file), then I can only import the file to Power BI. The Upload option is available only for Excel workbooks.
Workbook
The workbook is created and available in My workspace. I click on it.
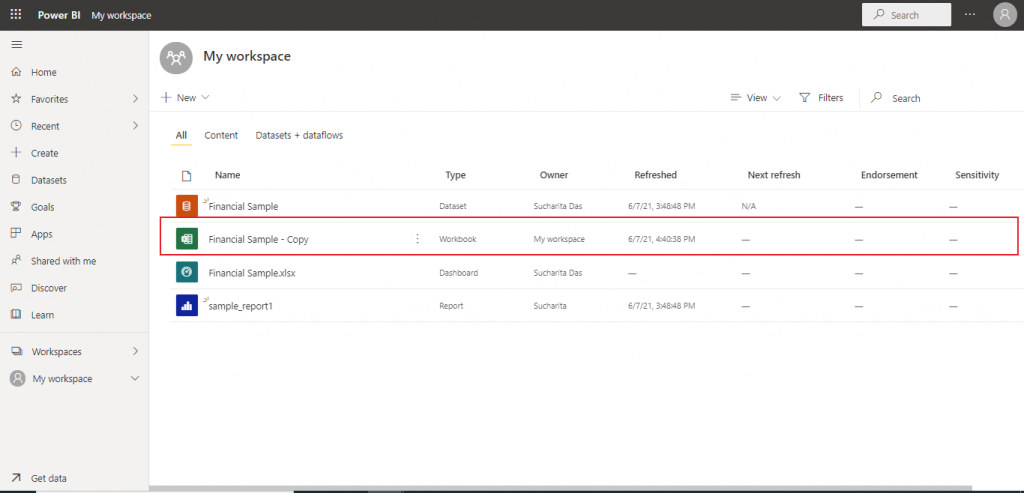
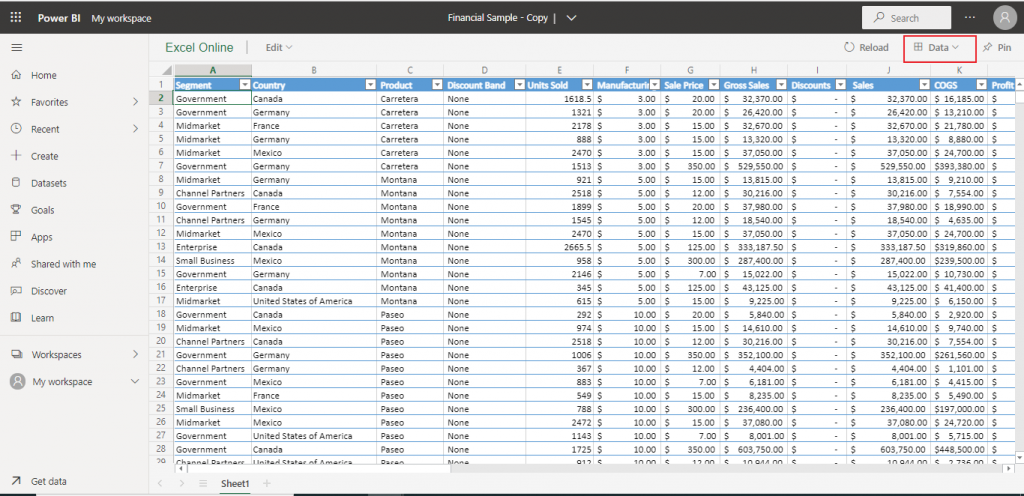
Details of workbook
The workbook data is shown in Excel Online. I may pin the entire data or some filtered data to any Dashboard from here. Also, there is an option to reload the data from the source as and when required.
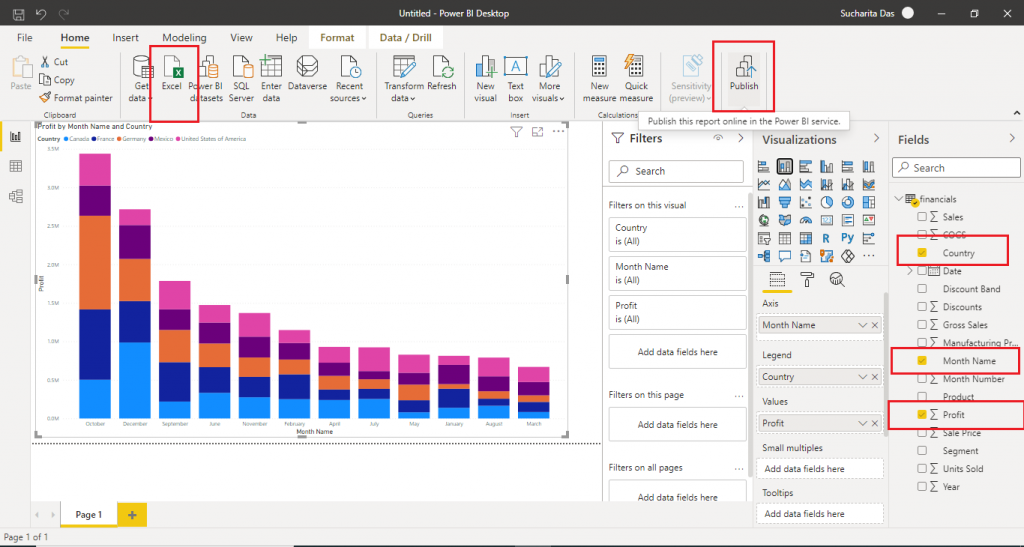
Items from Power BI Desktop
Now I open Power BI Desktop from my local machine. I create a report from an Excel file present in my local drive. Then, I press the Publish button to publish the report online to the Power BI Service.
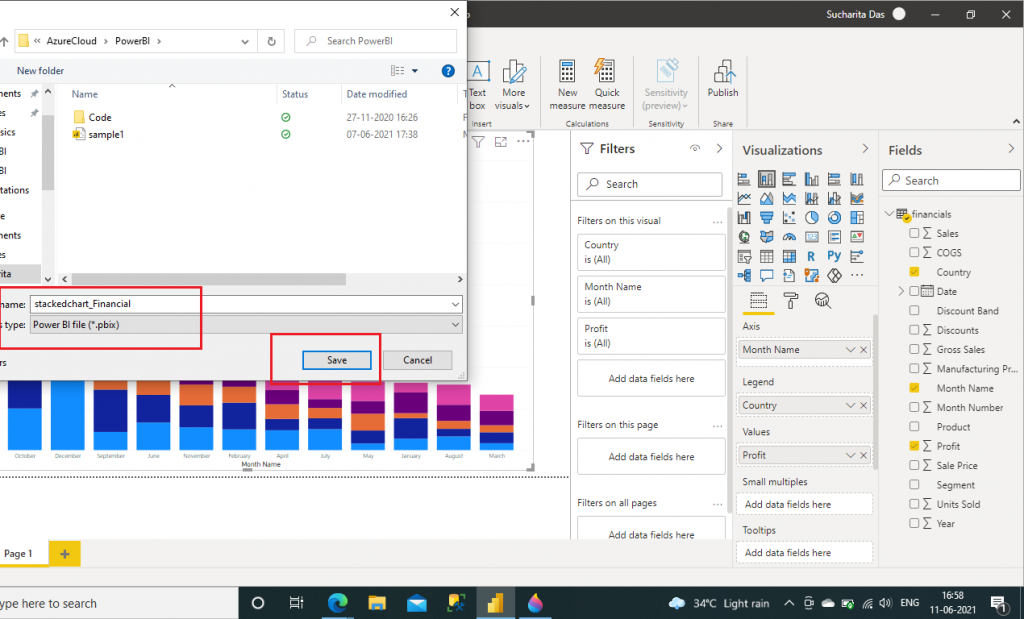
Save the file
Once I press the Publish button, I need to first save the file. I give a name and the extension for the Power BI file is .pbx.
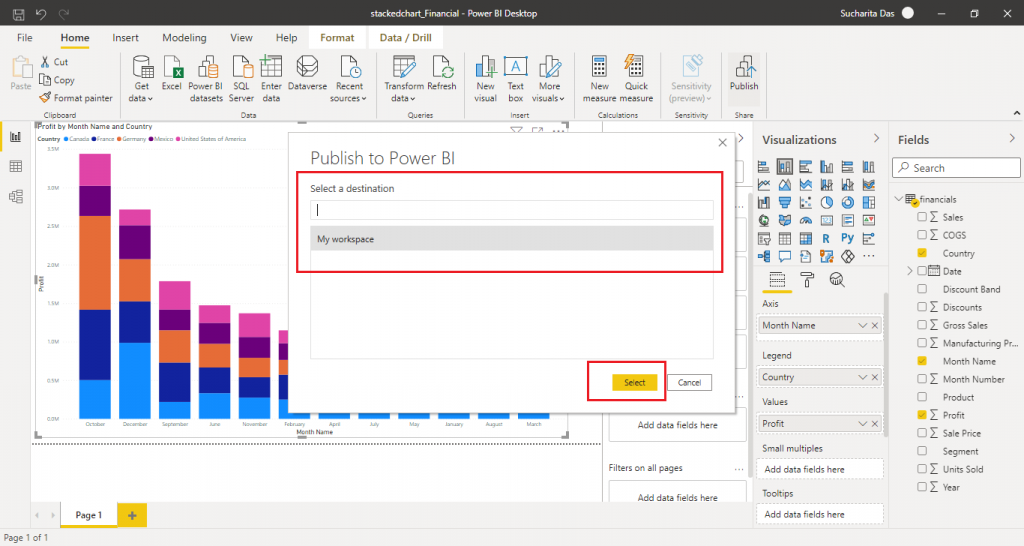
Select destination
I need to select a destination for publishing the report to Power BI service. I double-click on My workspace as listed below. Publish to Power BI is successful.
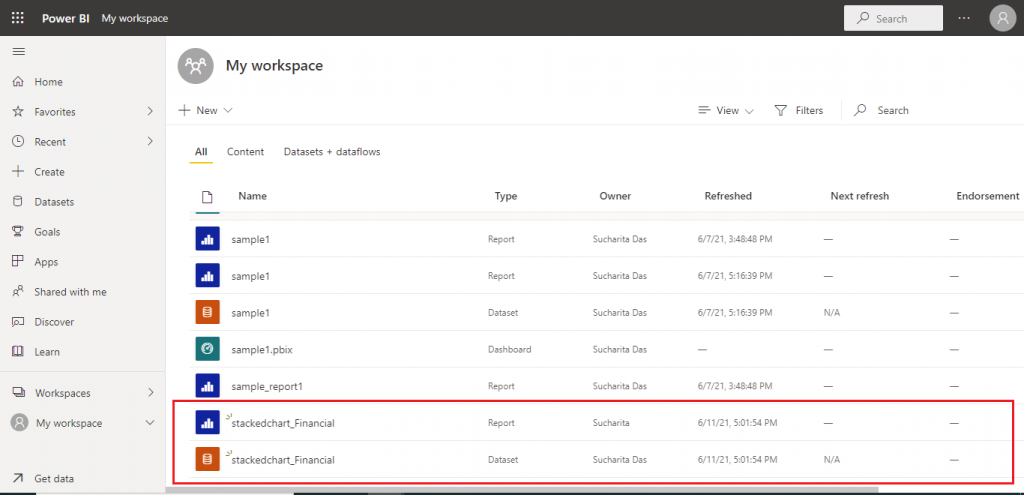
Report and dataset in My workspace
The report and the related dataset from Power BI Desktop, once published, are now available in My workspace. I may work on these items or may share with others, as required.
Conclusion
Power BI service is a very easy-to-use and powerful tool to generate valuable insights from data taken from various sources. Employees in the same organization may work and share the content with their colleagues through workspaces. It is possible to create report in Power BI Desktop and Power BI Report Builder and then publish the reports to the Power BI Service so that the report can be shared with the required people.
