

Introduction
In my last article, Using Azure Synapse Link for Azure Cosmos DB , I discussed creating the Synapse Link to query data present in Azure Cosmos DB from my Synapse workspace. Here, I will create a new database in the serverless SQL pool and create views based on the Cosmos DB JSON files. Then, I will build a Power BI model over that view and generate visual reports on the data.
Steps for generating Power BI reports from the views
First, we need a database and view. I go to the Develop tab in Synapse Studio and create a new SQL script named cosmos_powerbi1.sql. I connect to the built-in SQL Server and create a new database named Test.
CREATE DATABASE Test1
GO
I create a view named ecdc1 to retrieve data from the JSON items in the ecdcCases container.
IF OBJECT_ID('ecdc1','V') IS NOT NULL
    DROP VIEW ecdc1


CREATE VIEW ecdc1
AS
SELECT Countries_and_territories,Date_rep, Cases, Deaths,Year,Month, Day
FROM OPENROWSET('CosmosDB',
                'Account=cosmos1sd;Database=testdb1;Key=<key value>',
                ecdcCases) AS ecdcCases

SELECT Countries_and_territories,Date_rep, Cases, Deaths,Year,Month, Day
FROM ecdc1
I create another view on the items in cord19 container. I write a SQL query to retrieve data by joining the two views as well.
IF OBJECT_ID('cord1','V') IS NOT NULL
    DROP VIEW cord1

CREATE VIEW cord1
AS
SELECT
    author_first_name = first,
    author_last_name = last,
    author_affiliation_location_country = JSON_VALUE(affiliation, '$.location.country')
FROM OPENROWSET(
    'CosmosDB',
    'Account=cosmos1sd;Database=testdb1;Key=<key value',
    cord19)
    WITH ( authors varchar(max) '$.metadata.authors' ) AS docs
    CROSS APPLY OPENJSON ( authors )
                  WITH (
                       first varchar(50),
                       middle varchar(50),
                       last varchar(50),
                       suffix varchar(50),
                       affiliation nvarchar(max) as json,
                       email varchar(50)

                  ) AS a

SELECT author_first_name,author_last_name, author_affiliation_location_country FROM cord1

SELECT
author_first_name,
author_last_name,
author_affiliation_location_country,
Countries_and_territories,
Date_rep,
Cases,
Deaths,
Year,
Month,
Day
FROM ecdc1 AS e
INNER JOIN cord1 as c ON c.author_affiliation_location_country = e.Countries_and_territories
Power BI Desktop
Power BI is a collection of software services, apps and connectors that work together to generate visual and interactive insights from different unrelated sources of data. There are various elements of Power BI, including:
- Power BI Desktop : Windows desktop application
- Power BI service: online SaaS service
- Power BI mobile apps: for Windows, iOS, and Android devices
- Power BI Report Builder: for creating paginated reports to share in the Power BI service
- Power BI Report Server: on-premises report server where to publish Power BI reports
A data source is connected in Power BI Desktop and a report is built. Then the report is published from Power BI Desktop to the Power BI service. If I share the report, business users can view and interact with the report in Power BI service and Power BI mobile apps.
In this article I will use only Power BI Desktop to generate report from the Azure Cosmos DB data.
Power BI Desktop
This is a free application to be installed on local computer. I may connect to different data sources and combine them into a data model. Data can be transformed and visual reports are generated from this data. Some common uses for Power BI Desktop are:
- Connect to data source
- Transform and clean data
- Provide visual representations of the data
- Create reports that are collections of visuals
- Share reports with others by using the Power BI service
Installation
Power BI Desktop can be installed in two possible ways:
- Install as an app from the Microsoft Store.
- Download directly, as an executable and install on computer.
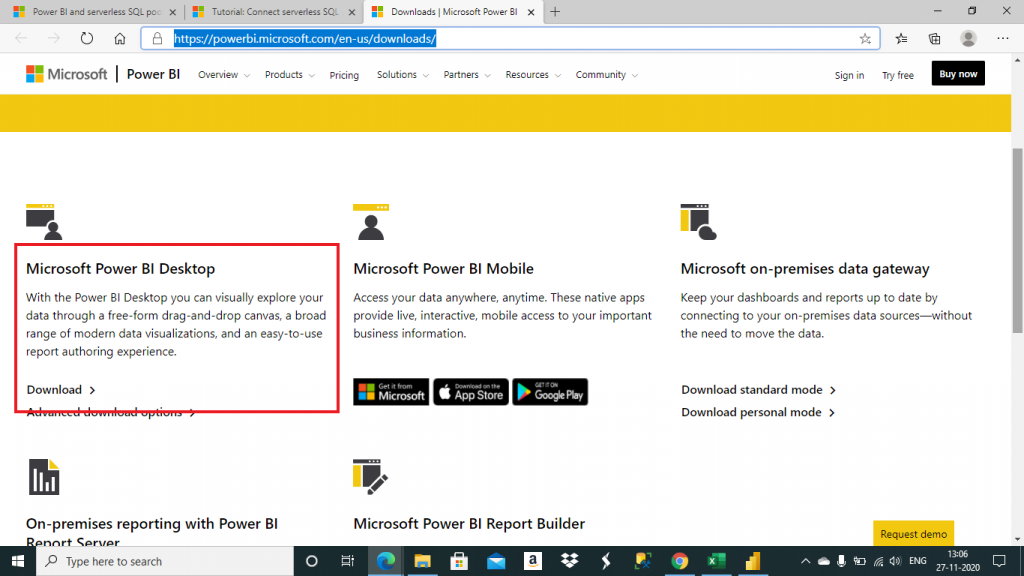
I follow the second way. To install Power BI desktop in the local machine, I go to the download page at https://powerbi.microsoft.com/en-us/downloads/. I select the Microsoft Power BI Desktop item and press the Download button.
I then run the download to install the program. Once the installation is complete, I open Power BI Desktop from the machine. In the first page, three views are available in the left side of the canvas.
- Report: reports and visuals are created here. This is the default view.
- Data: tables, measures, and other data used in the data model associated with the report are shown here. Data transformation is also done here.
- Model: relationships among tables in the data model are managed here.
The Power BI Connection to Azure Synapse Analytics
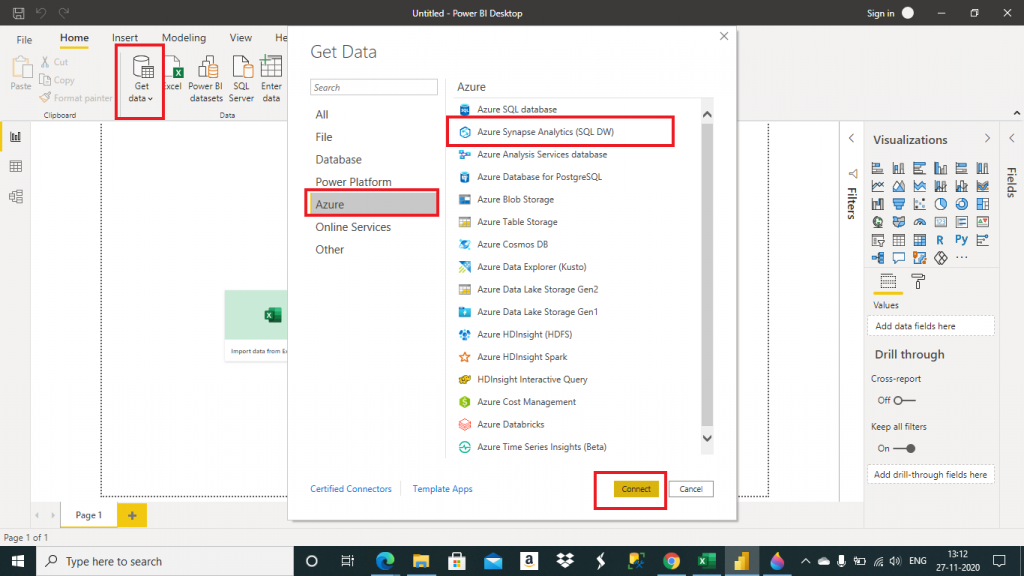
I click on the Get data tab item and select Azure Synapse Analytics from the drop-down list. I press the Connect button.
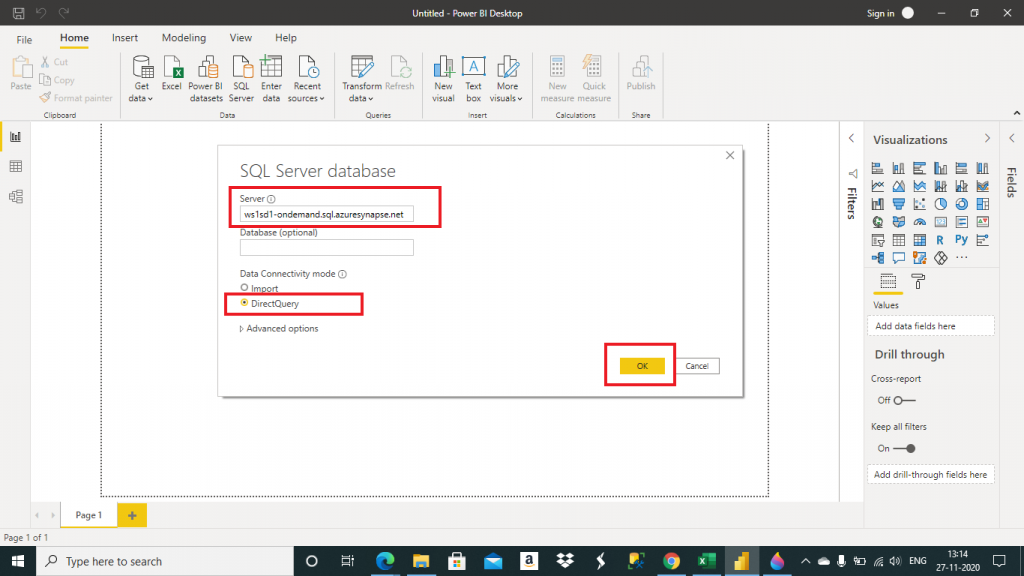
After pressing the Connect button, a pop-up window opens where I need to provide the SQL Server details and also need to mention the Data Connectivity mode. I provide the SQL Server name and select DirectQuery as the data connectivity mode. Then, I press the OK button.
The Data Connectivity mode decides how the data will be connected with Power BI Desktop for report generation. There are two choices:
- Import: Data should be imported to Power BI wherever possible. This option helps to take advantage of the high performance query engine of Power BI, and provides a highly interactive and fully featured experience.
- DirectQuery: For frequently changing data and reports with latest data requirement, DirectQuery should be used. Using DirectQuery is only feasible when the data source can handle the query load and can provide interactive queries within a defined timeline. There are other limitations as well for DirectQuery.
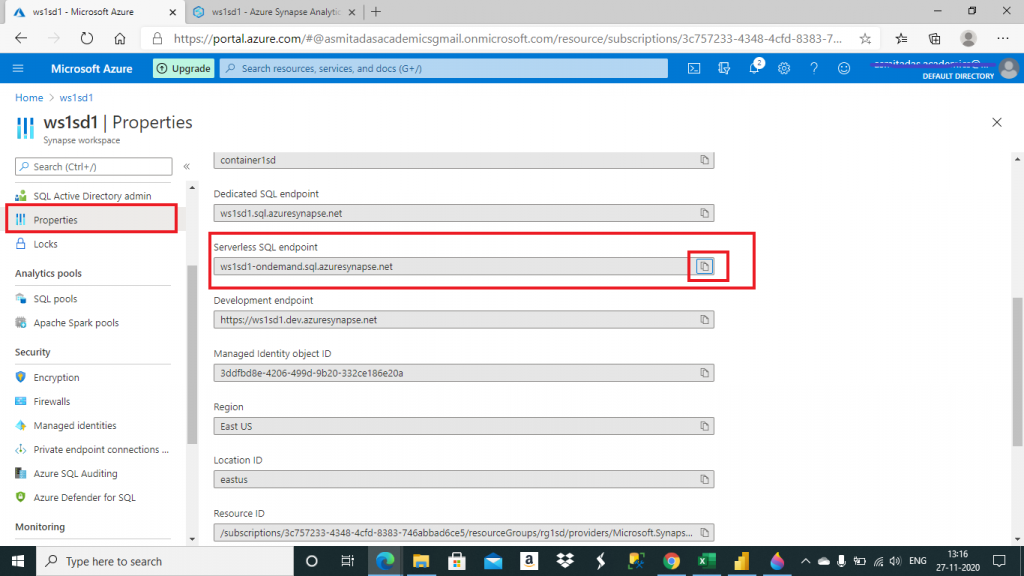
I copied the SQL Server name from the Serverless SQL endpoint as mentioned in the Properties tab of the Synapse Workspace.
Access data in Power BI desktop
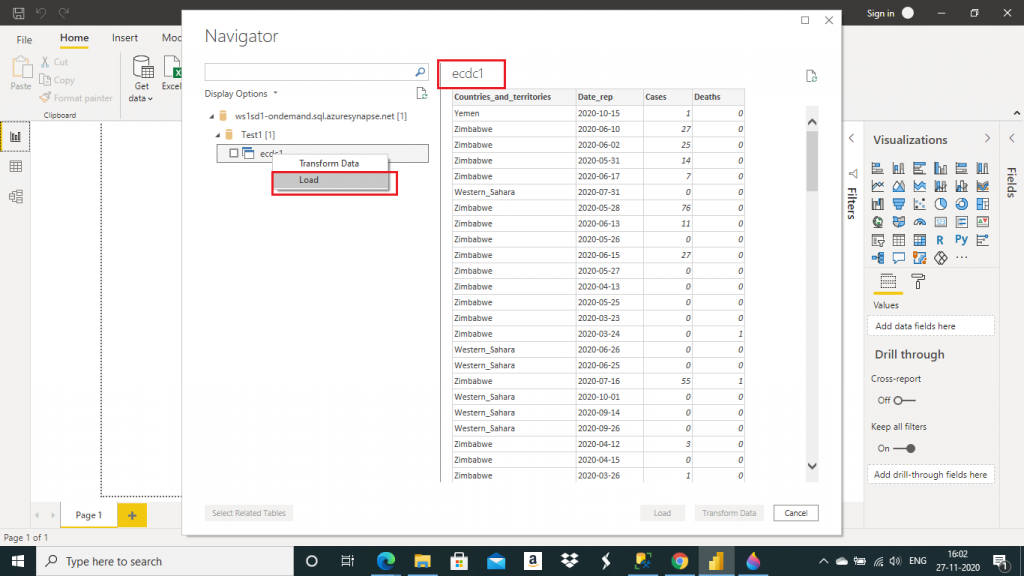
A pop-up window named Navigator opens. In the left pane, the serverless SQL pool is available. I select the Test database and the ecdc1 view under that. Data is available in table format. I press the Load button under ecdc1 view.
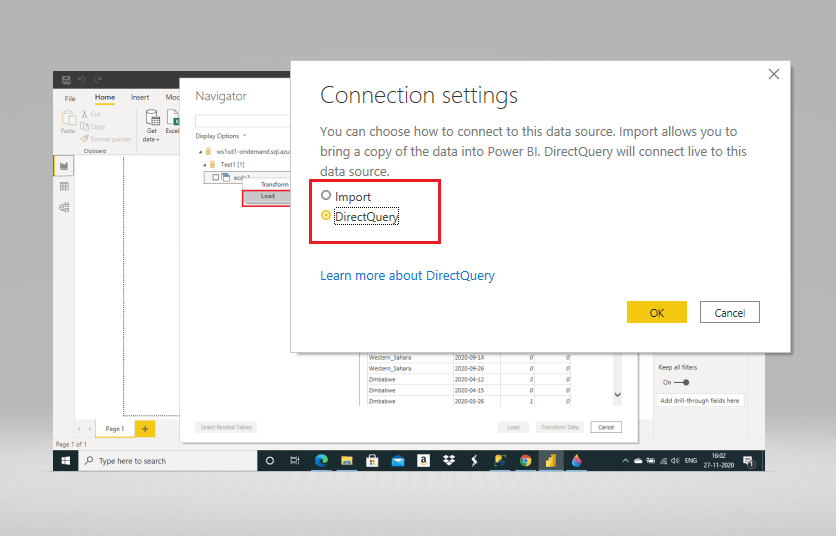
In the next pop-up window, I have the choice on how to connect to the data source. I select DirectQuery and press the OK button.
Visualization of data
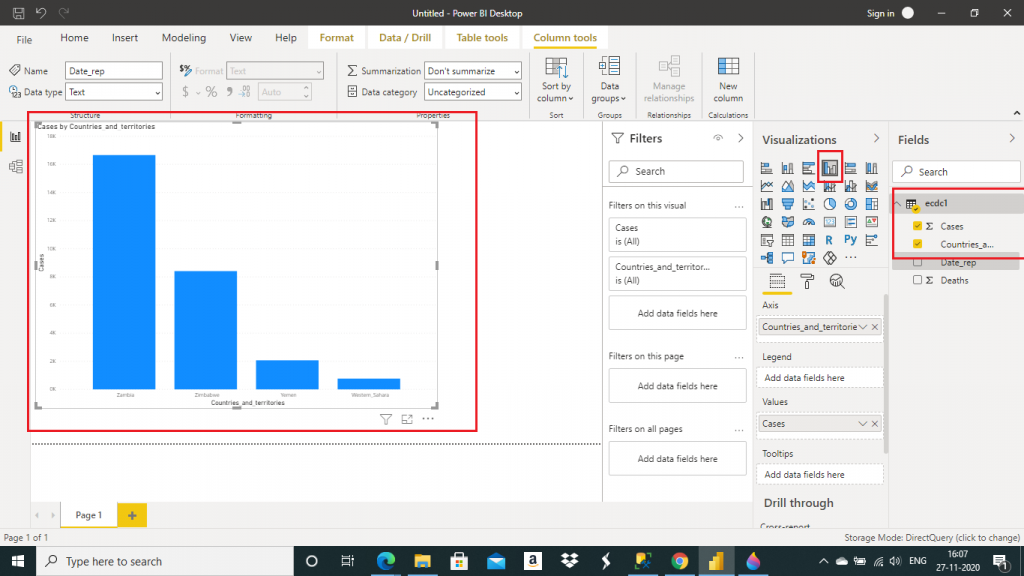
In the next screen, the ecdc1 data is available in the right-most window. I can select different summarizations and graphs are generated accordingly.
I selected total number of cases based on the value of Countries and territories value. In the Visualization pane, I selected Clustered column chart. The graph is generated accordingly in the canvas area in the middle. I can generate different types of visuals based on the selection of fields and the visualizations and get detailed insight about the data through visual representation.
I can use the Fields pane to filter data visualizations to be shown on the canvas. It is possible to create different visualizations in different pages of the report or we may combine several fields into one visualization.
These reports may be shared in different ways. We may upload the report .pbix file from the Power BI service or can publish directly from Power BI Desktop to the Power BI service. Power BI account should be created first to publish or upload reports to Power BI service.
Conclusion
This article is the continuation of my last article, Using Azure Synapse Link for Azure Cosmos DB. Here, I used the Cosmos DB data linked from Synapse Analytics Workspace and generated a report in Power BI Desktop. Once Cosmos DB data is available in Synapse Workspace through Synapse link, we may create Power BI reports which may actually help to get a lot of insights about the data and useful reports may be generated. Here, I have generated a very basic visual from the Cosmos data. I will discuss about the creation of different visuals and reports in separate articles.