

Introduction
Period-over-period is an analysis technique in business that measures some value in the present and compares it to the same measurement in a comparable period of time in the past. The goal is to adjust the slice of the past you are viewing, so the same amount of time has passed in the two periods you are comparing. This article will visualize the analysis using Power BI.
It can be used to answer questions like:
- Has my customer conversion rate improved since this time last quarter?
- What is my annual sales growth as compared to last year?
Solution
In this example, I'll take the fictitious WideWorldImportersDW database (provided by Microsoft) to analyze the data in a month-over-month fashion. The data from the warehouse is imported into Power BI using the Direct Query method.
For the sake of this example, I have imported only two tables from the warehouse database:
- Fact.Sale: This table contains all the sales information for the fictitious database. The [Total Including Tax] column is used to fetch the total sales amount.
- Dimension.Date: This is the date dimension table that contains all the calendar-related fields. In this example, I have used the [Calendar Year] and [Short Month] fields in the report.
In order to be able to calculate this, we need to prepare the data in such a way that we can visualize the Sales Amount for the current month and the previous month for each of the months available in the database. Once we have this, the next step is to calculate the difference between these two values. Finally, in order to calculate the change in percentage, we need to divide the difference by the previous month's value. The formula is:
MoM Formula: (This month – Previous month) x 100 / Previous Month= Percentage Growth
The field that is already available in the database for the Sales Amount is "Total Including Tax". For illustration purposes, I'll rename this to "This Month Sales".
I need to create three Measures in the data model to calculate the growth percentage, which are as follows:
- Previous Month Sales: This field will store the previous month's sales values for any given month.
- Sales Difference: To calculate the difference in sales amount from the previous month.
- Sales Growth %: To calculate the difference in percentage.
Let's see this in action in the Power BI report. I have provided the DAX script for all the three measures below.
Previous Month Sales =

    CALCULATE(

        SUM('Fact Sale'[Total Including Tax])

        ,PREVIOUSMONTH(

            'Dimension Date'[Date]

        )

    )


Sales Difference =

    VAR CurrentMonthSales = SUM('Fact Sale'[Total Including Tax])

    VAR PreviousMonthSales = 'Fact Sale'[Previous Month Sales]


    VAR Result = CurrentMonthSales - PreviousMonthSales


    RETURN

        Result


Sales Growth % =

    DIVIDE(

        [Sales Difference],

        'Fact Sale'[Previous Month Sales]

    )
Power BI Report
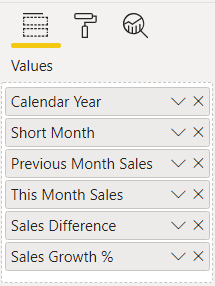
In order to use the measures that we just created in the previous step, I'll create a table in the Power BI report by including the fields as below. Here is the values for this visual.
Here is the table visual.
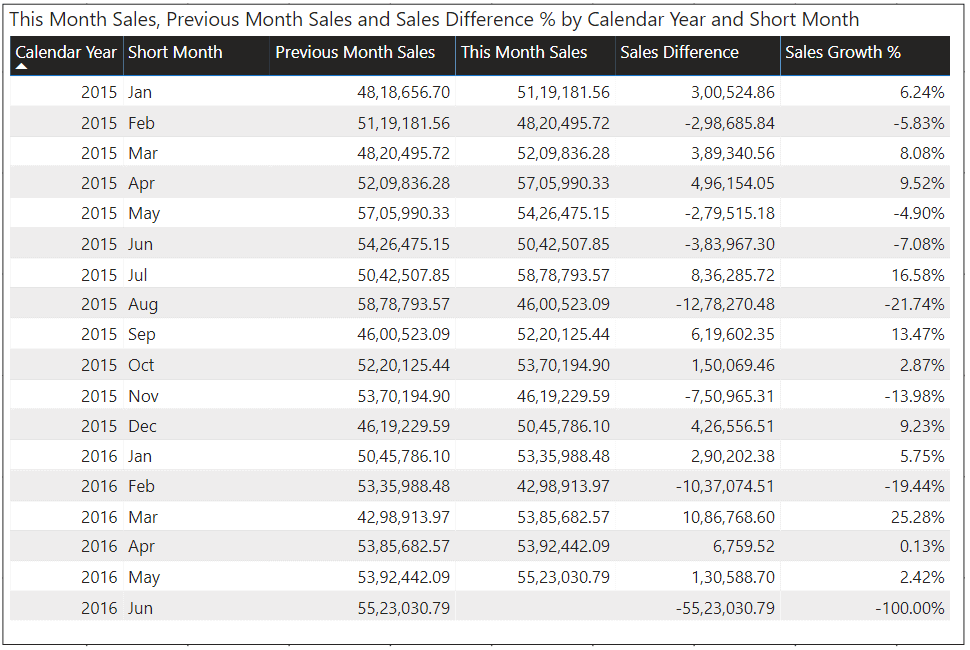 Month Over Month Analysis (Table)
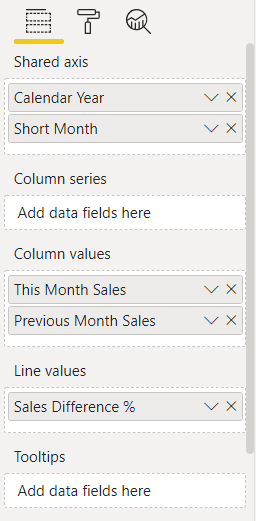
The above tabular information can also be plotted in a bar chart, that'll compare both the current and previous month's sales and the change in percentage can be depicted by a line chart. Here are the settings for the line chart:
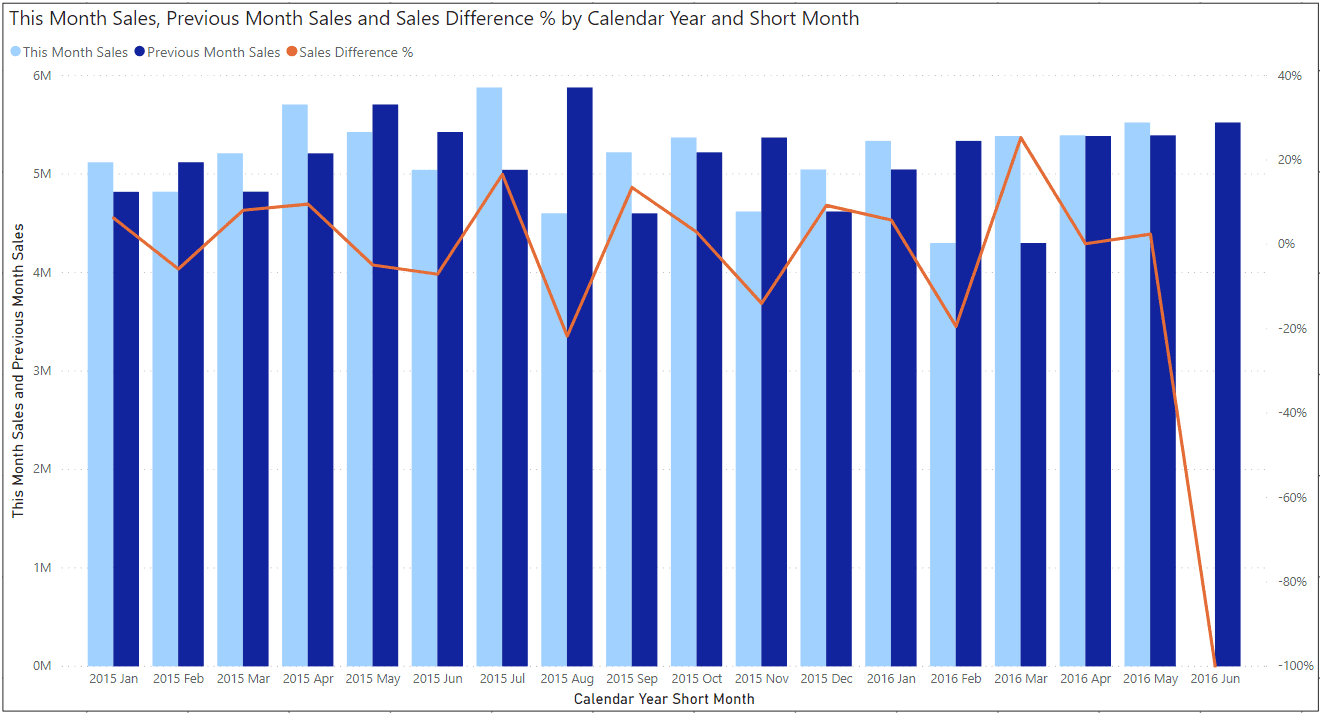
And here is the chart.
The Power BI report is attached here and is available for free use.
Takeaway
In this article, I have outlined what is a period over period analysis and how can it be implemented in a Power BI report.
References
To learn more about DAX queries, please refer to the DAX.guide. See more information about Time Intelligence Functions in DAX here.
