

Introduction
A Pivot table is a technique to summarize a large amount of data that can be visualized into rows and columns. It is also referred to as the magnifying glasses of your data. It allows the users to transform rows into columns. In addition to this, it also allows the user to group the data based on any column available in the dataset.
A Pivot table is most commonly used in scenarios where data needs to be aggregated, and sliced and diced for analysis. It is particularly useful when the user is looking to calculate and summarize data in order to make comparisons.
Let me illustrate this with a simple diagram.
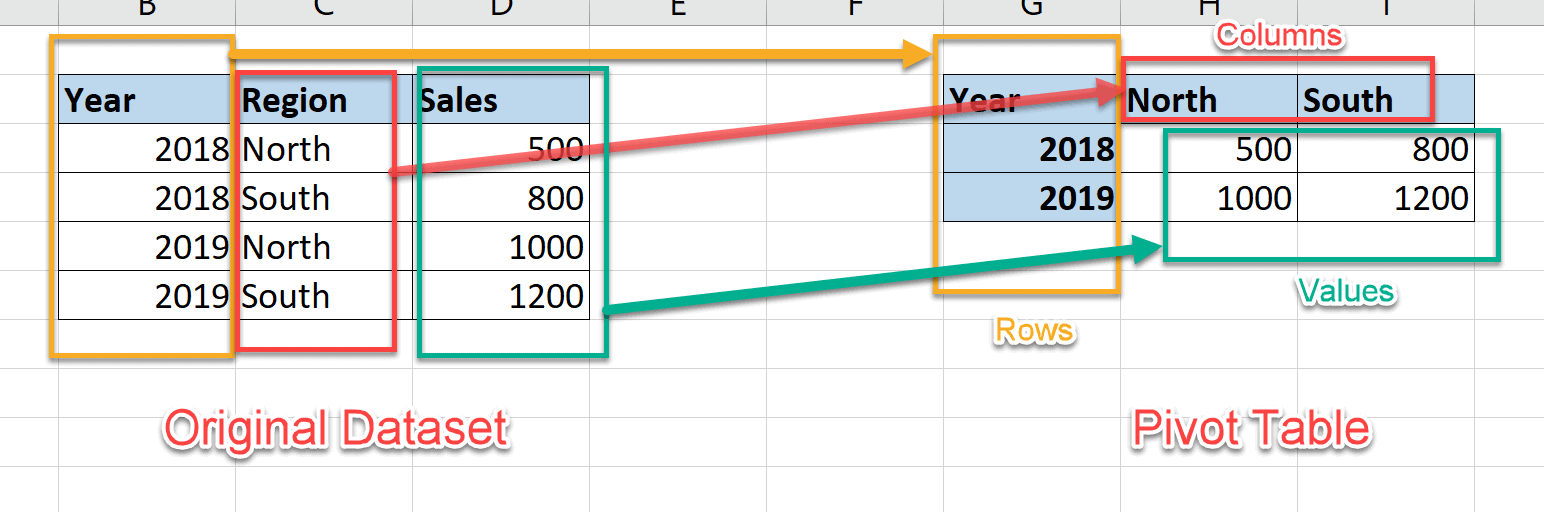
In this diagram, as you can see, on the left-hand side is the original dataset that contains three columns - Year, Region and Sales. On the right-hand side, it is the pivot table that is created by converting the Region (rows) into North and South (columns). Once the rows are converted into columns, the Sales values are aggregated for each of the intersections between the rows and columns of the pivot table.
Example
In this article, we will look at how to convert a simple dataset into a pivot table using T-SQL. For the sake of this tutorial, I'll be using the AdventureWorksDW2017 database and use the following tables to convert it to a pivot table.
- FactInternetSales
- DimSalesTerritory
- DimDate
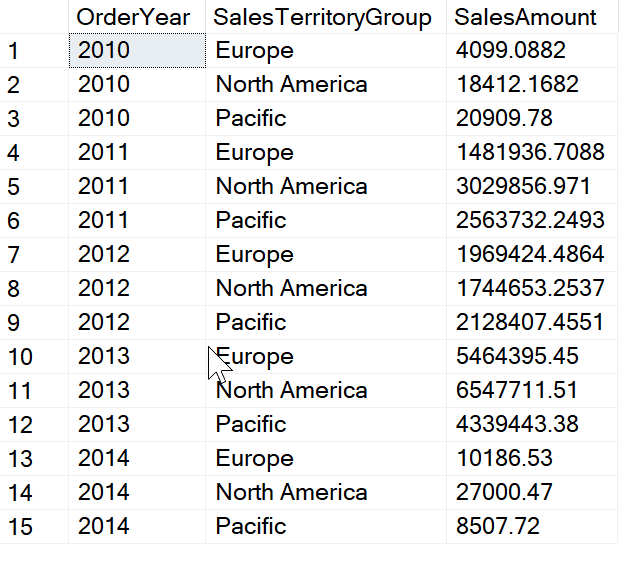
Let us run the following script that will fetch the SalesAmount by OrderYear and SalesTerritoryGroup.
SELECT
[dd].[CalendarYear]AS [OrderYear]
,[dst].[SalesTerritoryGroup]AS [SalesTerritoryGroup]
,SUM(SalesAmount) [SalesAmount]
FROM [dbo].[FactInternetSales] fs
INNER JOIN [dbo].[DimDate] dd ON dd.DateKey = fs.OrderDateKey
INNER JOIN [dbo].[DimSalesTerritory] dst ON dst.SalesTerritoryKey = fs.SalesTerritoryKey
GROUP BY
[dd].[CalendarYear]
,[dst].[SalesTerritoryGroup]
ORDER BY
[dd].[CalendarYear]
,[dst].[SalesTerritoryGroup]
The resultset is as below.
Applying Pivot in SQL
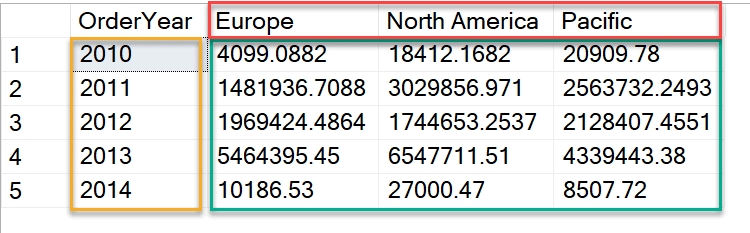
Since we have our dataset ready, we can now consider pivoting this original dataset, such that the rows from the SalesTerritoryGroup can be converted into columns. As there are only 3 distinct values for SalesTerrritoryGroup, our pivot table will also consist of three columns - "Europe", "North America" and "Pacific". The OrderYear will be in the rows and the SalesAmount will fill up the values in the pivot table. The Pivot table that we are trying to obtain is shown in the next diagram.
Now, let's learn how to obtain this pivot table. In SQL, there is a PIVOT operator available which is helpful in creating such pivot tables. The way the PIVOT operator works is by rotating a table-valued expression. It turns all the distinct values from one column into multiple columns in the output and performs aggregated calculations on the remaining column values.
The main steps to write a query using the PIVOT operator is as follows:
- Select the base dataset that you want to pivot.
- Create a temporary resultset, using a derived table or by using a Common Table Expression.
- Apply the PIVOT operator. The PIVOT operator, in turn, has three parts:
- The value that is being aggregated.
- FOR followed by specified values from the column being replaced that will become new columns.
- IN followed by the column that’s being replaced by two or more columns.
It is mandatory that all the values to become new columns are specified. If a value exists in the base dataset that isn’t specified, it will not be included in the PIVOT query results.
Now, let's apply the above steps and obtain the final output gradually.
Step 1 - Select the base dataset that you want to pivot.
Let us first select the base dataset. For this, we can use the original query that we used to retrieve data from the AdventureWorksDW database originally.
SELECT
[dd].[CalendarYear]AS [OrderYear]
,[dst].[SalesTerritoryGroup]AS [SalesTerritoryGroup]
,SUM(SalesAmount) [SalesAmount]
FROM [dbo].[FactInternetSales] fs
INNER JOIN [dbo].[DimDate] dd ON dd.DateKey = fs.OrderDateKey
INNER JOIN [dbo].[DimSalesTerritory] dst ON dst.SalesTerritoryKey = fs.SalesTerritoryKey
GROUP BY
[dd].[CalendarYear]
,[dst].[SalesTerritoryGroup]
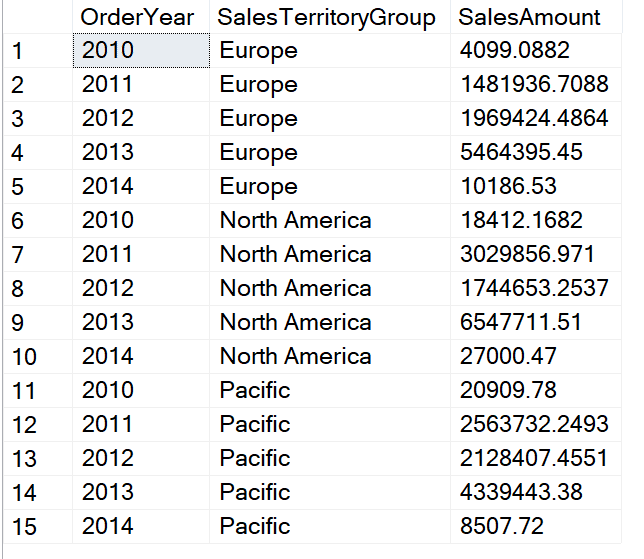
The resultset obtained by the above query is as below.
Step 2 - Create a temporary resultset, using a derived table or by using a Common Table Expression
The second steps is to create a temporary resultset by using a derived table or a CTE. In this example, I'll use a derived table to create a temporary resultset.
SELECT * FROM (
SELECT
[dd].[CalendarYear]AS [OrderYear]
,[dst].[SalesTerritoryGroup]AS [SalesTerritoryGroup]
,SUM(SalesAmount) [SalesAmount]
FROM [dbo].[FactInternetSales] fs
INNER JOIN [dbo].[DimDate] dd ON dd.DateKey = fs.OrderDateKey
INNER JOIN [dbo].[DimSalesTerritory] dst ON dst.SalesTerritoryKey = fs.SalesTerritoryKey
GROUP BY
[dd].[CalendarYear]
,[dst].[SalesTerritoryGroup]
) AS [SalesByTerritoryAndYear]
The resultset obtained in this step is the same as that of Step 1. This is because we did not modify anything in the original dataset. We just wrapped the original query in a derived table SalesByTerritoryAndYear.
The resultset is as below.

Step 3 - Apply the PIVOT operator
Now that our derived table is ready, we are good to use the PIVOT operator. As I have already mentioned, the PIVOT operator has three parts.
- For the aggregated values, we will use the SUM function. This will return the sum of SalesAmount in the pivot table.
- Since we want the values from SalesTerritoryGroup to be displayed as the new columns, we will use this in the FOR statement.
- The third part is to specify which column values from SalesTerritoryGroup need to be included in the column list. We will specify all the distinct values in the IN statement.
Altogether, the query looks like this.
SELECT * FROM (
SELECT
[dd].[CalendarYear]AS [OrderYear]
,[dst].[SalesTerritoryGroup]AS [SalesTerritoryGroup]
,SUM(SalesAmount) [SalesAmount]
FROM [dbo].[FactInternetSales] fs
INNER JOIN [dbo].[DimDate] dd ON dd.DateKey = fs.OrderDateKey
INNER JOIN [dbo].[DimSalesTerritory] dst ON dst.SalesTerritoryKey = fs.SalesTerritoryKey
GROUP BY
[dd].[CalendarYear]
,[dst].[SalesTerritoryGroup]
) AS [SalesByTerritoryAndYear]
PIVOT (
SUM([SalesAmount])
FOR [SalesTerritoryGroup]
IN (
[Europe]
,[North America]
,[Pacific]
)
) AS [PivotSalesByTerritoryAndYear]
Now, when we execute this query, the resultset obtained is a table that has OrderYear in the rows, SalesTerritoryGroup in the columns and SalesAmount as the cell values.

This is the final table that we wanted to obtain.
Takeaway
In this article, I have described what is a Pivot table and how to obtain this in SQL in a step-by-step manner.
To learn more, please follow the official documentation from Microsoft.