

Introduction
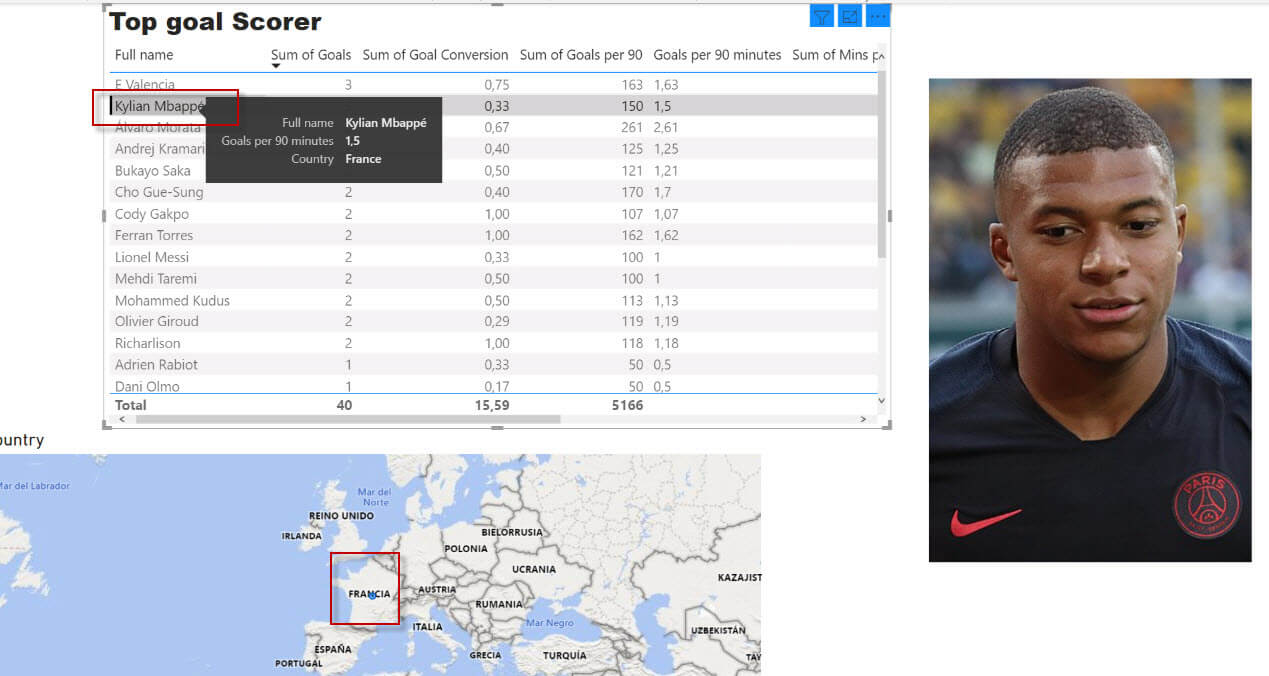
Sometimes, we need to work with images in Power BI. This tip will be about the FIFA 2022 World Cup. We will create a nice report about the World Cup’s best players. The report will have the name of the players with some statistics (goals, accuracy, etc.). If I select a player, the country will be displayed in the report and also the image in Power BI.

If I select another the player’s picture and country should be displayed.
In this article, we will learn the following things:
- First, we will import data from the BBC website into Power BI.
- Secondly, we will modify the column names, and remove some extra columns.
- Thirdly, we will modify and convert some data which was not imported successfully.
- Create a Table with data.
- Also, we will add a map to show the country on it.
- Finally, we will visualize images in Power BI with a new visual.
Requirements
- First, you need to have Power BI Desktop installed.
- Finally, you need Internet access.
Import data from the BBC website
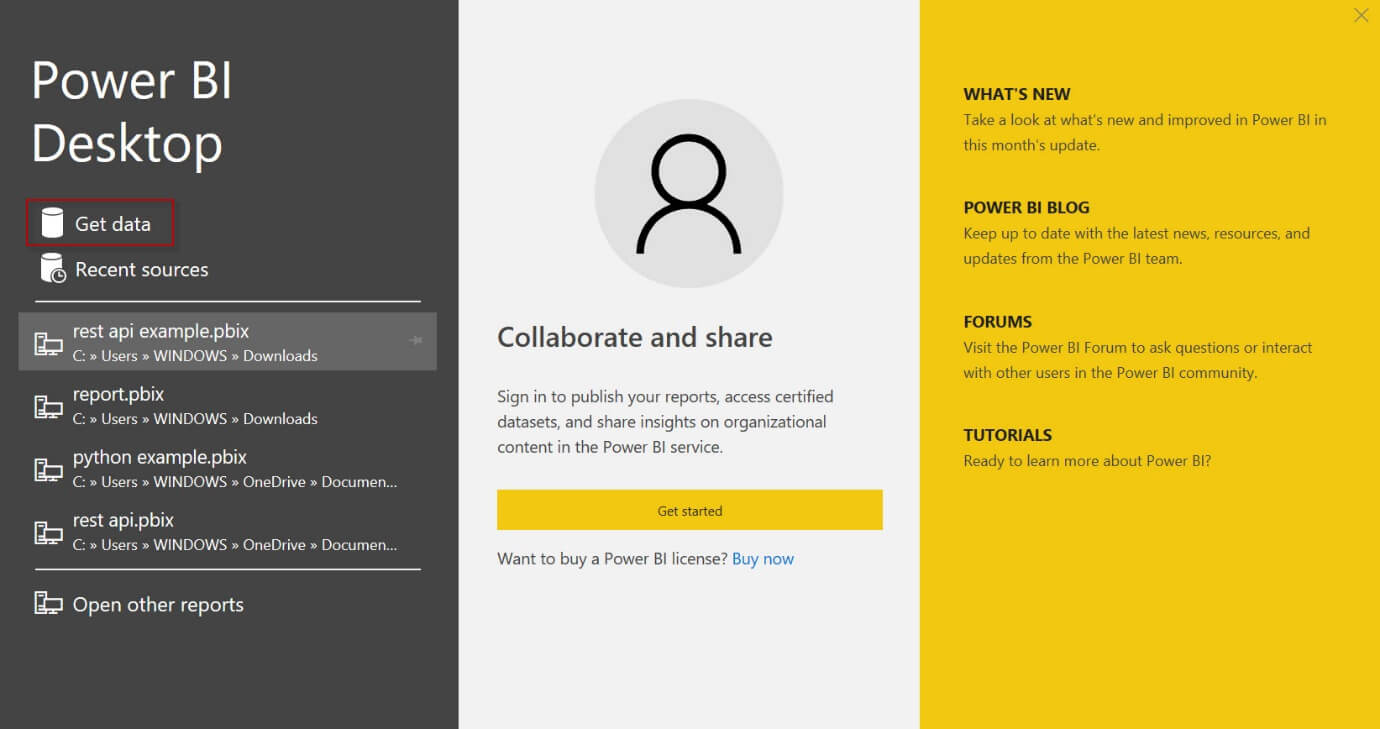
First, in Power BI select the Get data option.
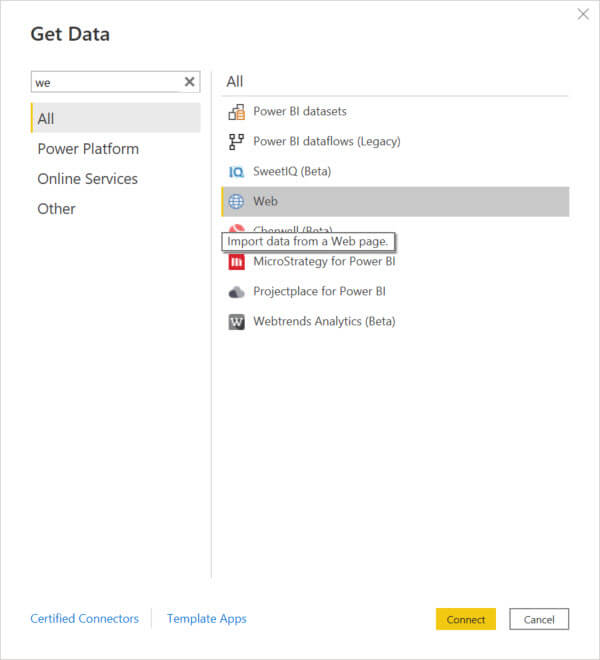
Secondly, in the Get Data window, write web in the search text and select the web option and press the Connect button.
In the URL, write the following URL and press OK.
https://www.bbc.com/sport/football/world-cup/top-scorers
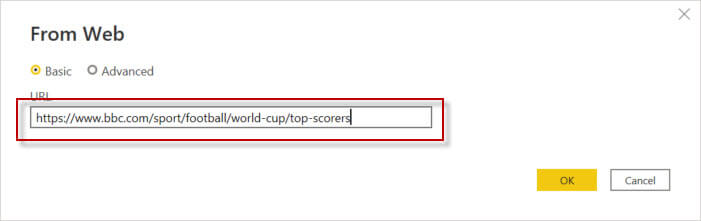
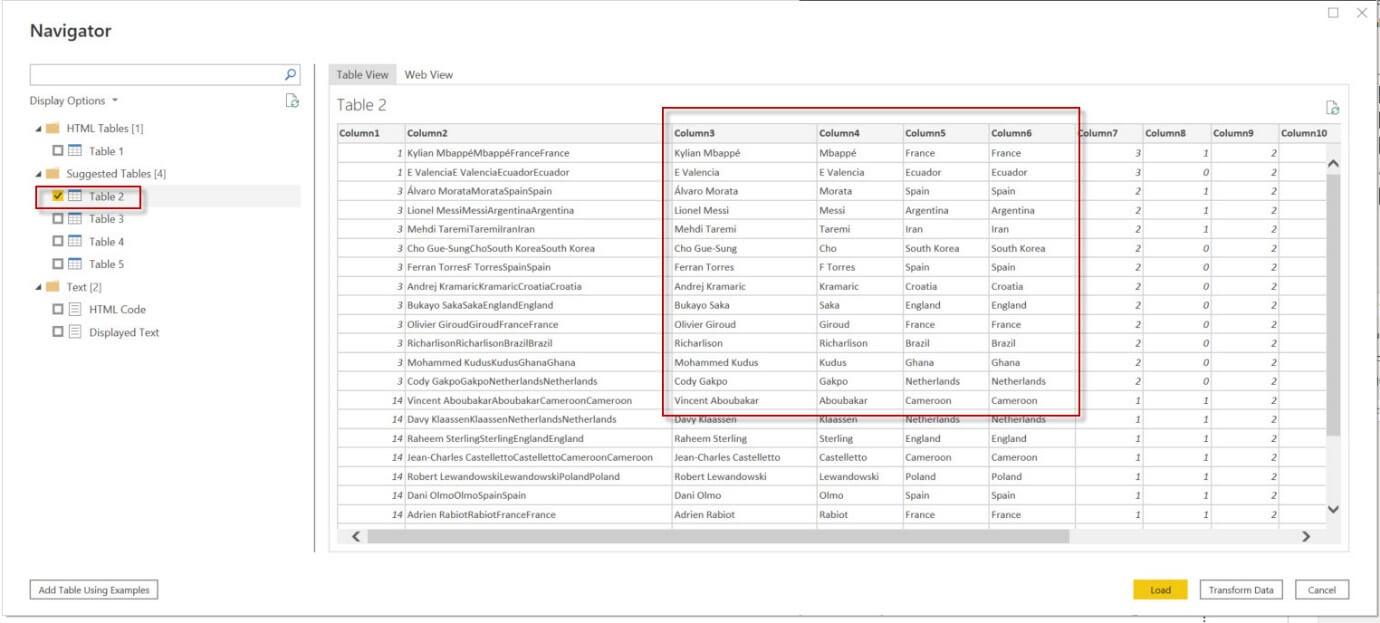
Table 1 shows the data imported. However, you will notice that the name, and country have some problems and you may need to split the data.
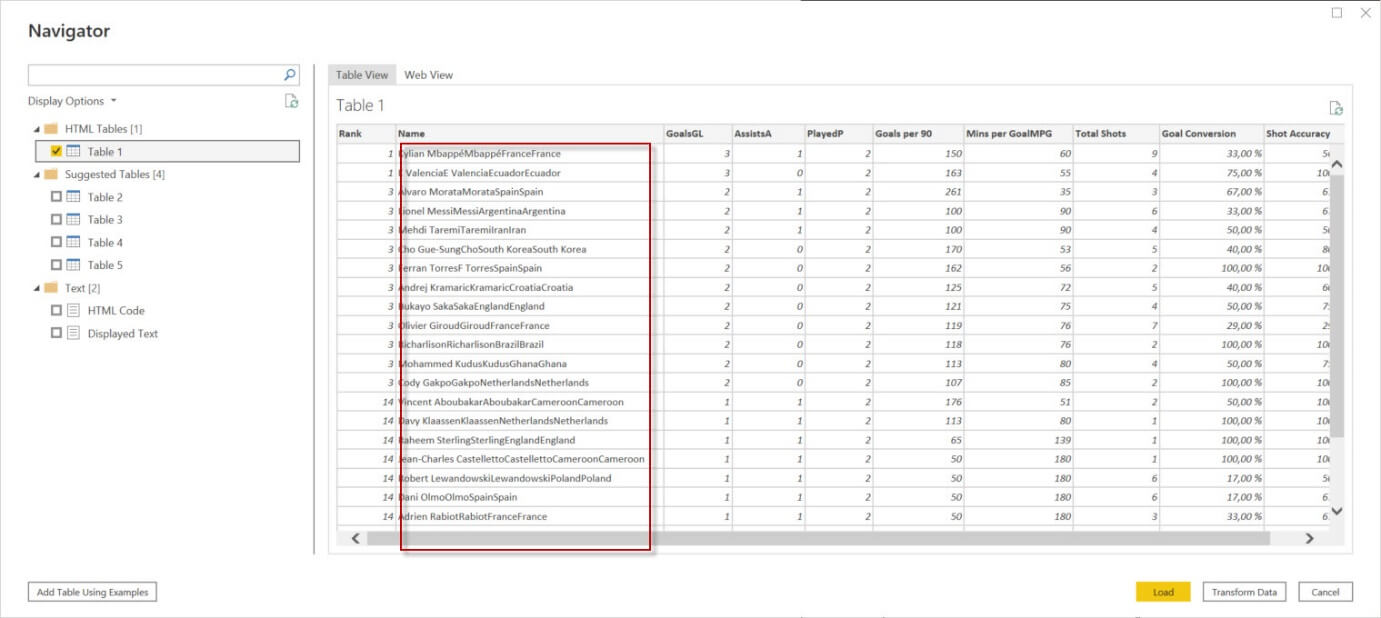
However, there are some suggested tables that are easier to work with:
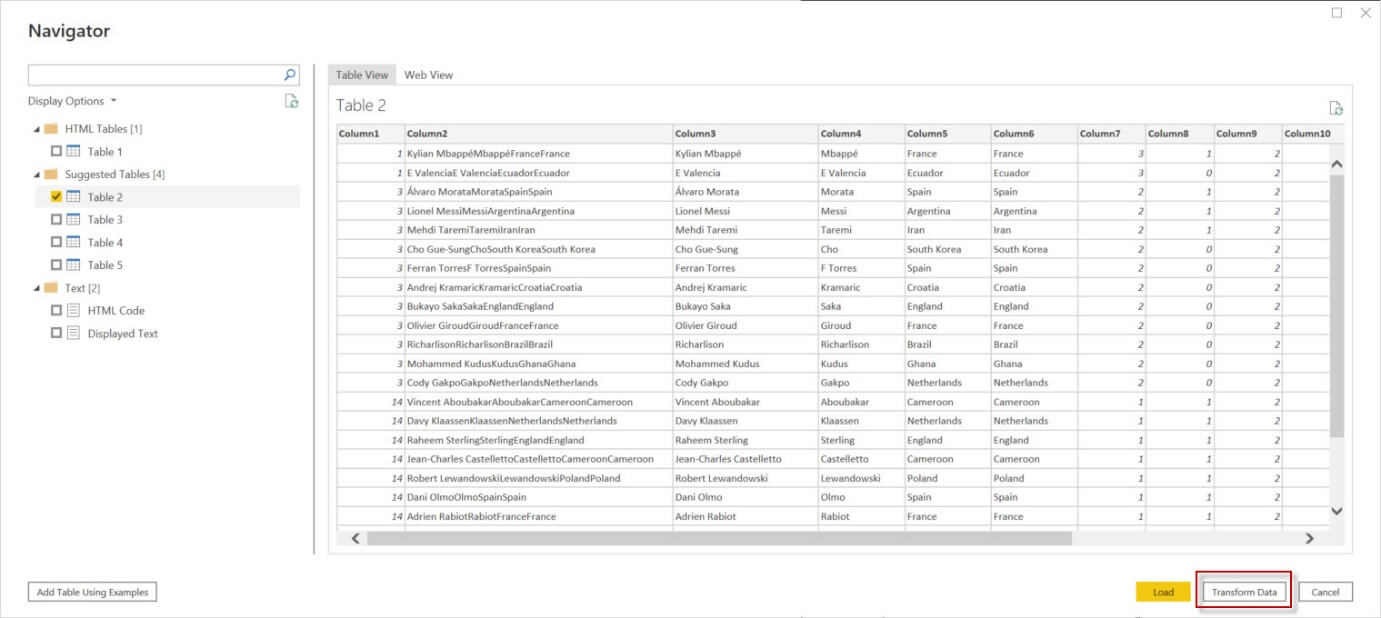
We will select Table 2 and press the Transform Data button to modify it.
Modify the column names, and remove some extra columns
First, we will remove columns with duplicated data. There are 2 columns with the players’ full names. We will remove that column using the right-click and selecting the Remove option.
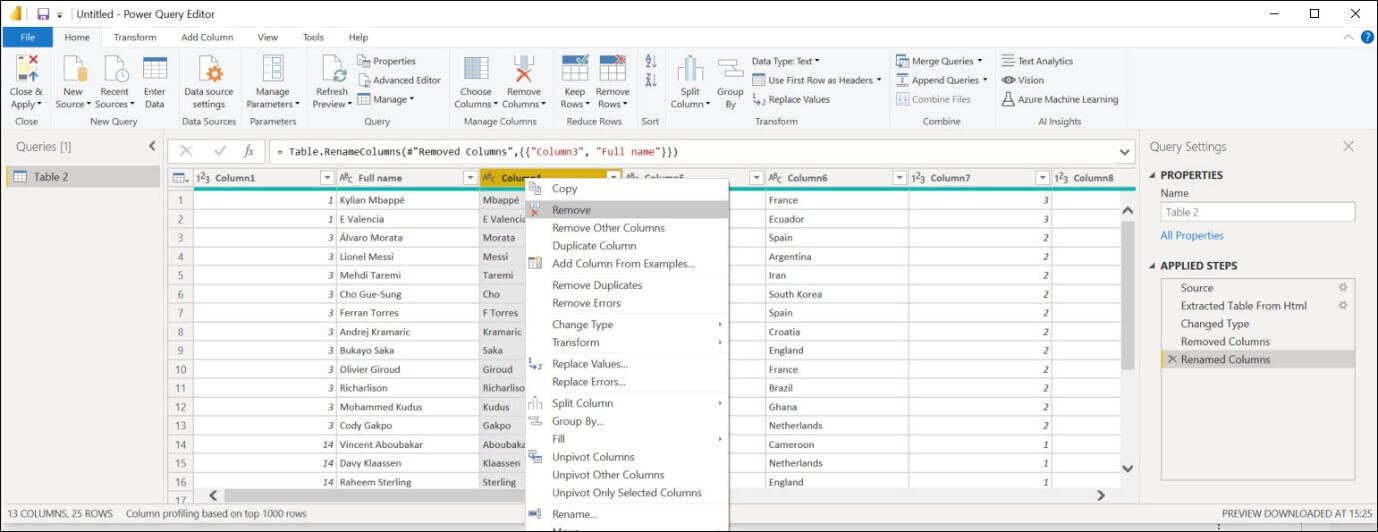
Also, we have the country name twice. Right-click in the column and select the remove option to remove the duplicated column.
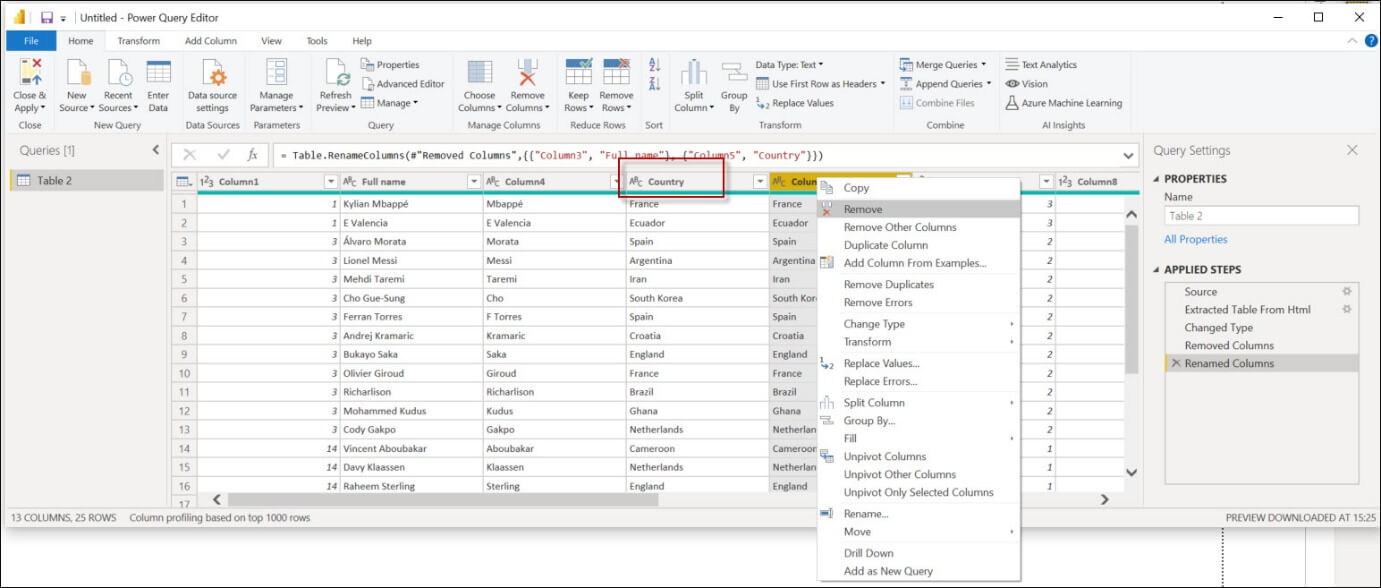
In addition, note that the column names are column3, column4, column5, etc.
If you go to the website, you will notice that the column names are different. Double-click the column header and write the correct column header.
Rename the column headers in Power BI according to the data in the previous image.

Modify and convert some data which was not imported successfully
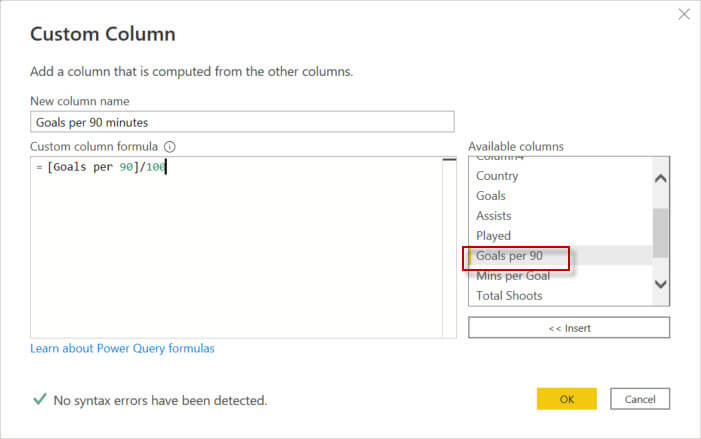
Note that the Goals per 90 minutes removed the decimals when the data was imported into Power BI.
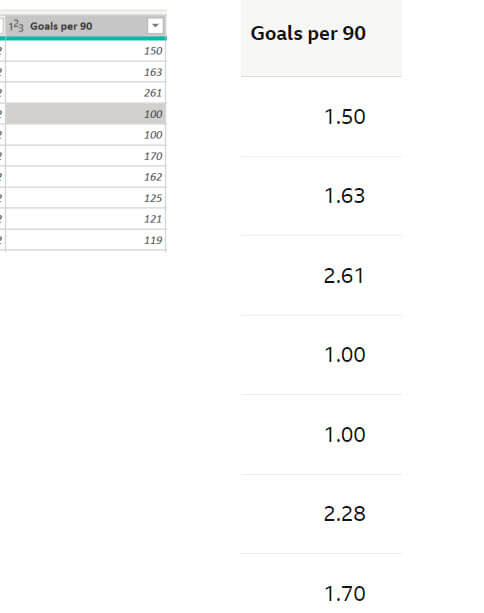
If you have a similar problem, you need to divide the column values by 100. To do that we follow these steps:
First, select the Add Column option in the menu and then the Custom column icon.
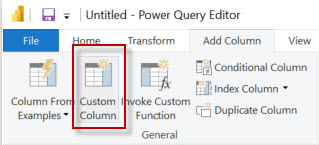
Secondly add a name for your new column and select the Goals per 90 column from the Available columns section and divide it by 100 and press OK.
Finally, close and apply your changes.
Create a table with data
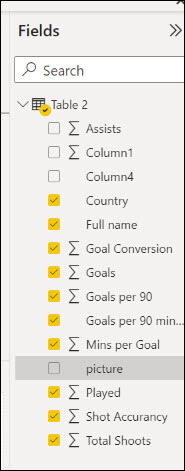
First, in the Fields pane, check the country, full name, goals, goals per 90, mins per goal, Played, shot accuracy, and total Shoots columns.
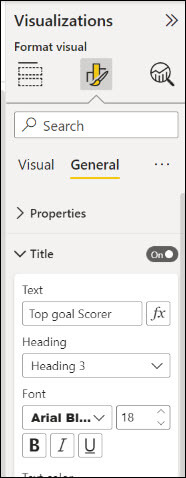
To add a title to the table, select the Format your visual icon and go to Title. Add a title to your table and make it bold and use a font size of 18.
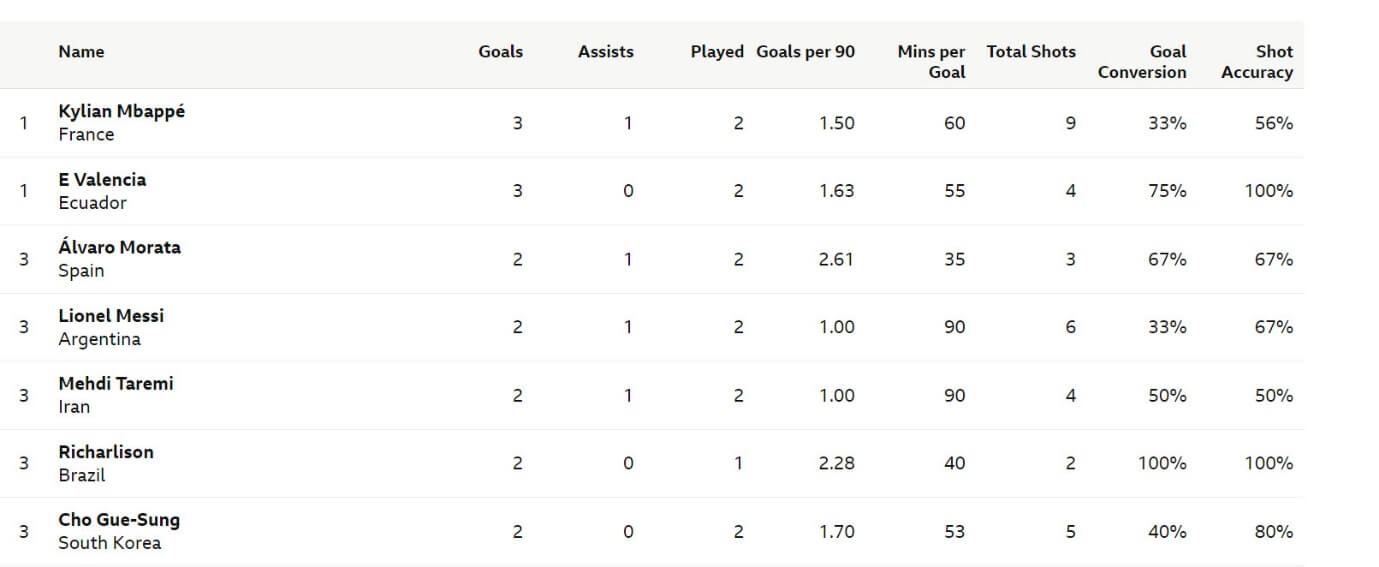
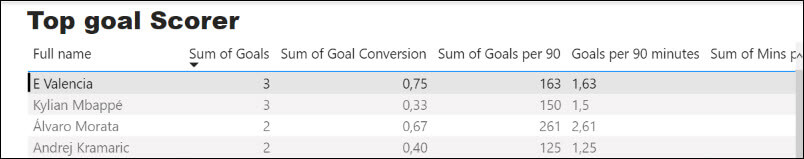
Finally, take a look at the table. It will look like this one:
Add a map to show the country on it
In order to add a Map with the nationality, follow these steps:
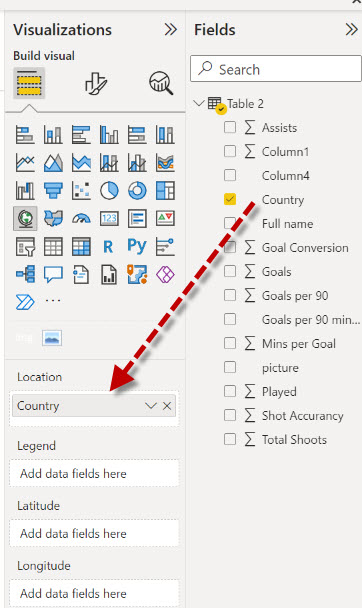
First, in Power BI click outside the table and select the map visual.
Secondly, drag and drop the Country field in the Location.
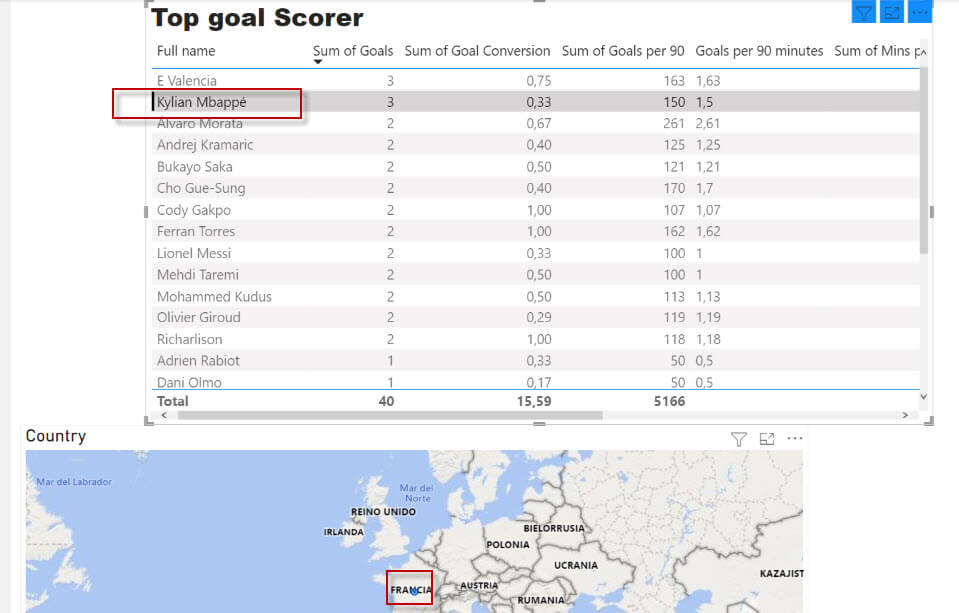
If everything is fine, if you select the player Kylian Mbappé (a French player), France will be displayed on the map.
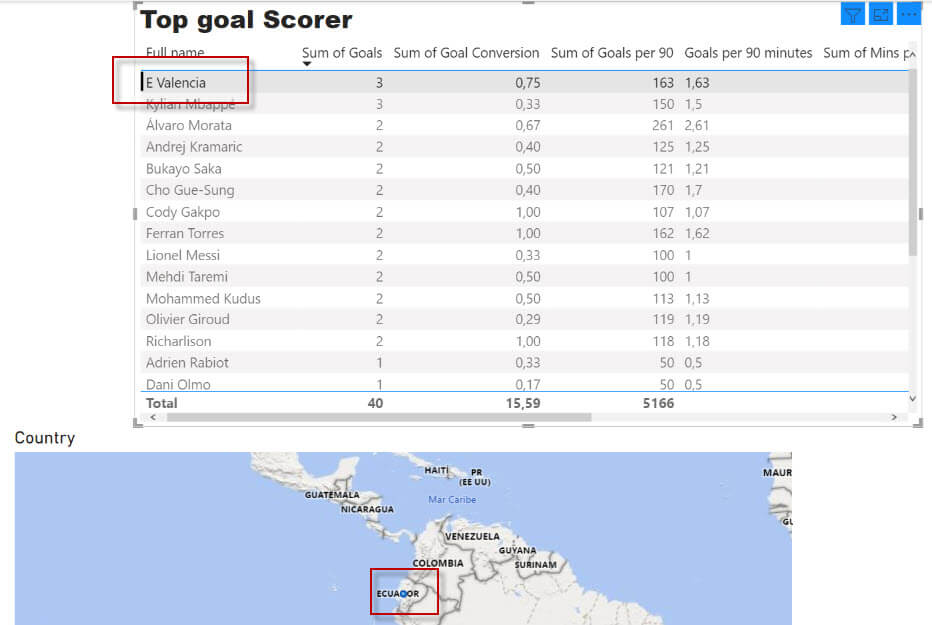
On the other hand, if you select the player Valencia (from Ecuador), Ecuador will be displayed.
Visualize images in Power BI with a new visual
We want to see the players’ photos. To do that, follow these steps:
First, go to the Data icon.
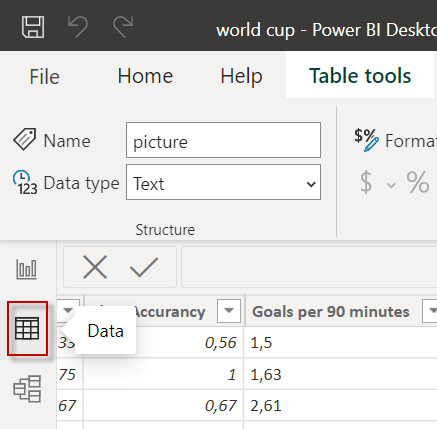
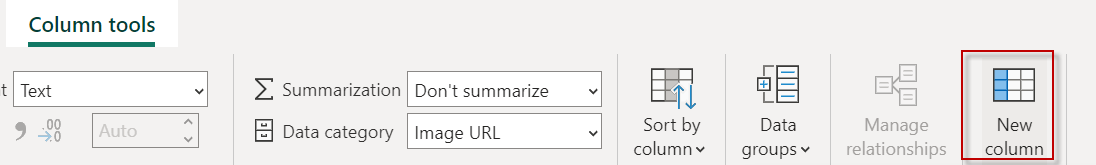
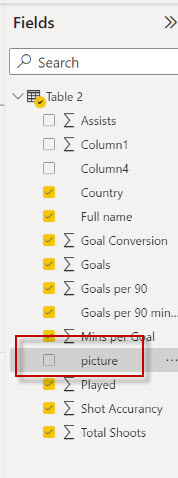
Secondly, create a New column.
Also, add a column named picture. This column contains the URL of an image in the player on the internet.
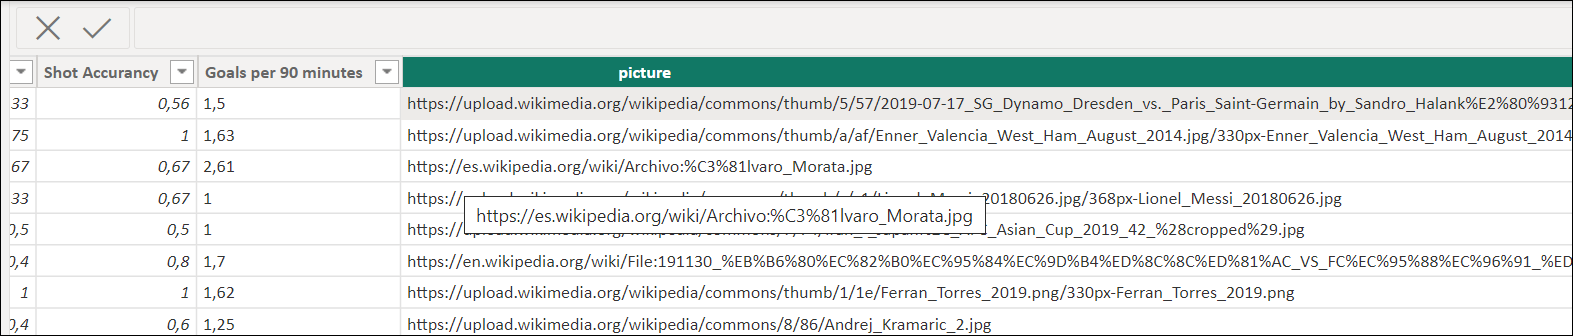
For example, for URL for Kilian Mbappé is the following:
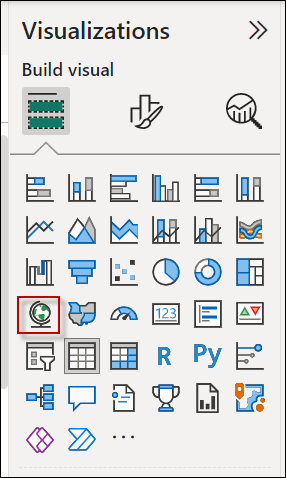
In addition, we will need to Get more visuals to get a visual to view images.
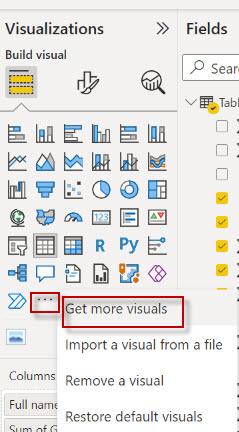
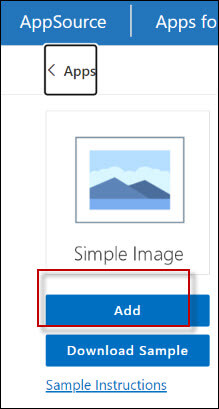
In the text box search for the word simple. Select the Simple Image visual.
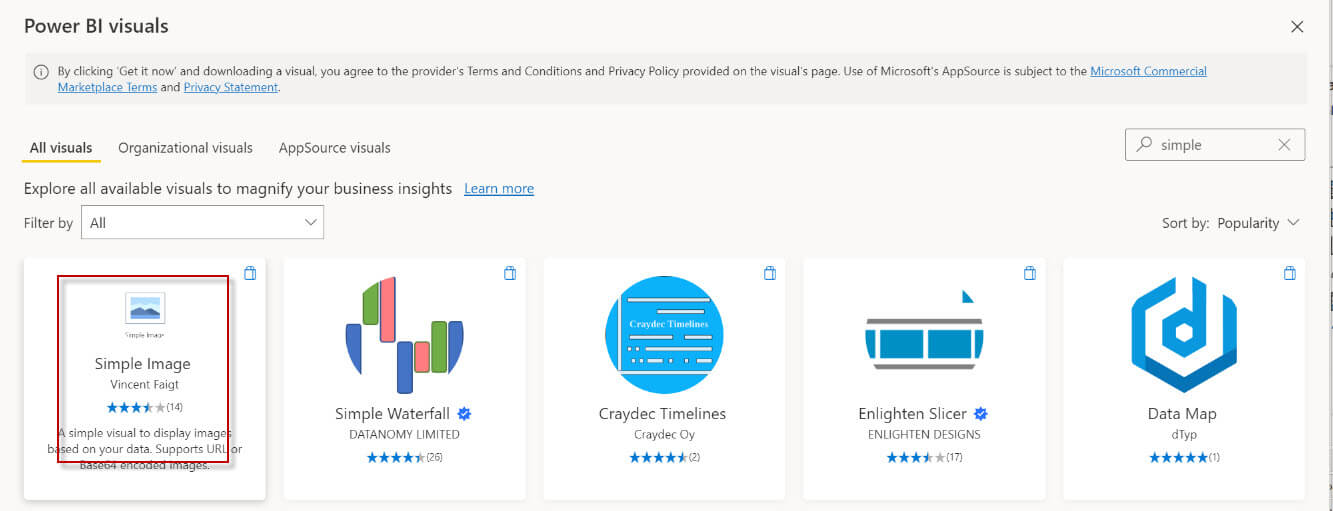
Also, press the add button to add the visual.
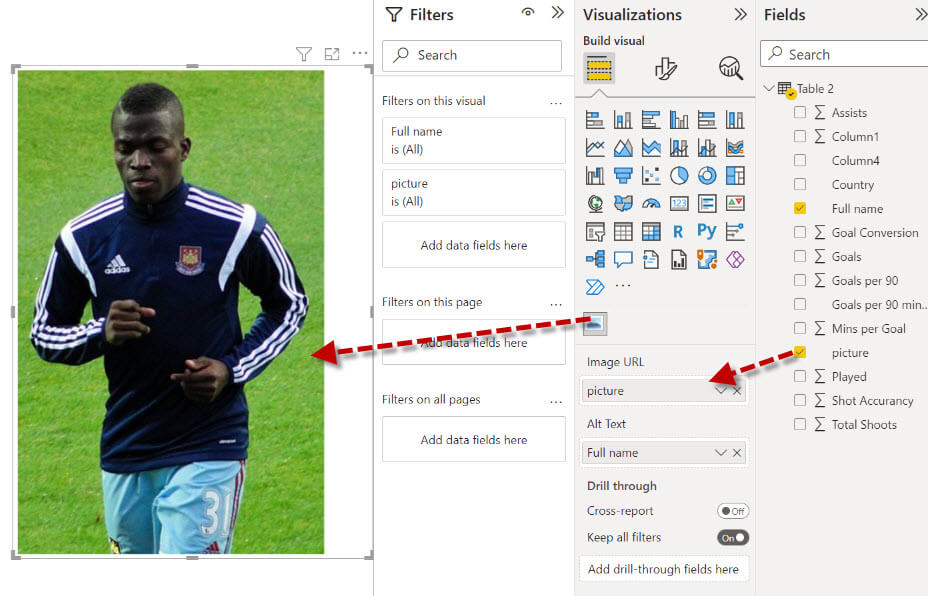
Add the simple image in the report and check the picture field.
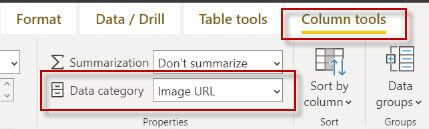
Go to column tools and make sure that the picture is in the Image URL category.
Finally, add the picture in the image URL
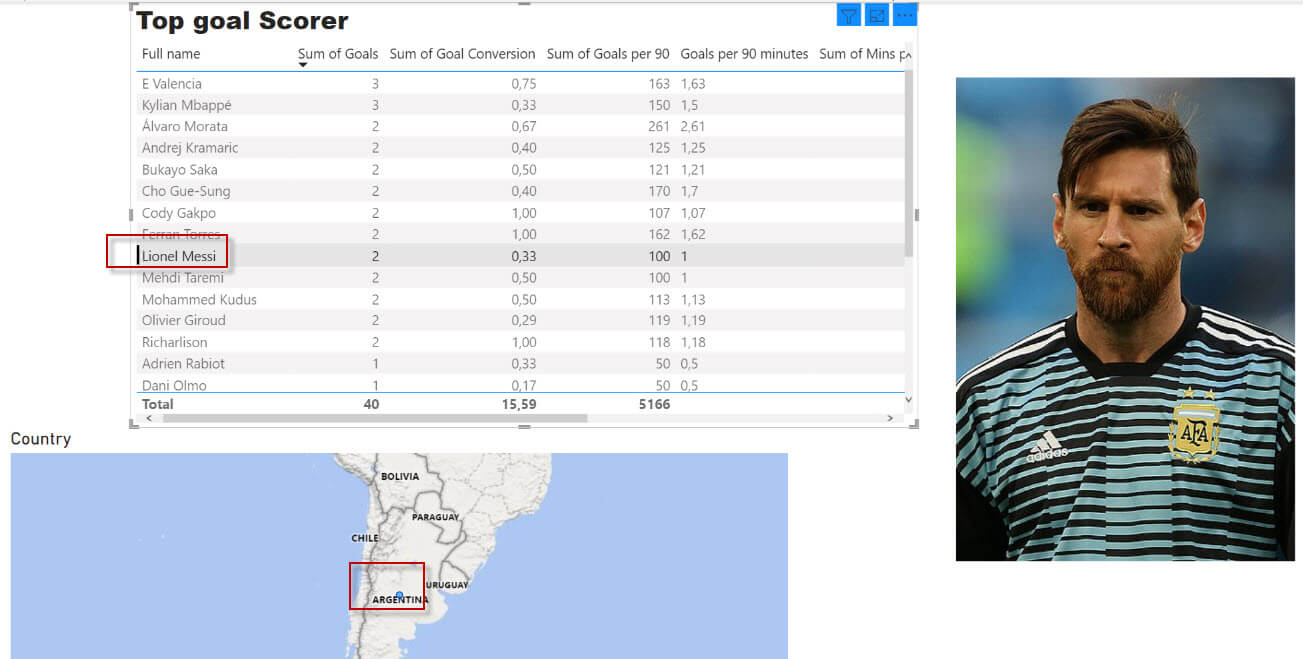
If everything is OK when I select the player Kylian Mbappé, France and his photo should be displayed.

If I select another player like Messi, Argentina should be displayed and Messi’s picture should be displayed.
Conclusion about working with maps and images in Power BI
In this article, we saw how to import data from the web. Modify the data and then we learn how to work with maps and dynamic images using a custom visual in Power BI.