

Introduction
In this article, we will learn how to import data in Power BI using R. R and Python are standard tools used in Power BI. In a previous article, we learned how to import data in Power BI using Python. This time we will learn to use R.
The article will cover the following topics:
- How to import data in Power BI using R
- Create scattered visuals from data imported in Power BI using R
- Modify data in Power BI using R
- Modify data in Power BI using R
- How to import data in Power BI using R and the read.csv function
Requirements
First, we need to have the Power BI Desktop installed.
Secondly, we need internet access.
Thirdly, we need to have R installed.
Importing data in Power BI using R
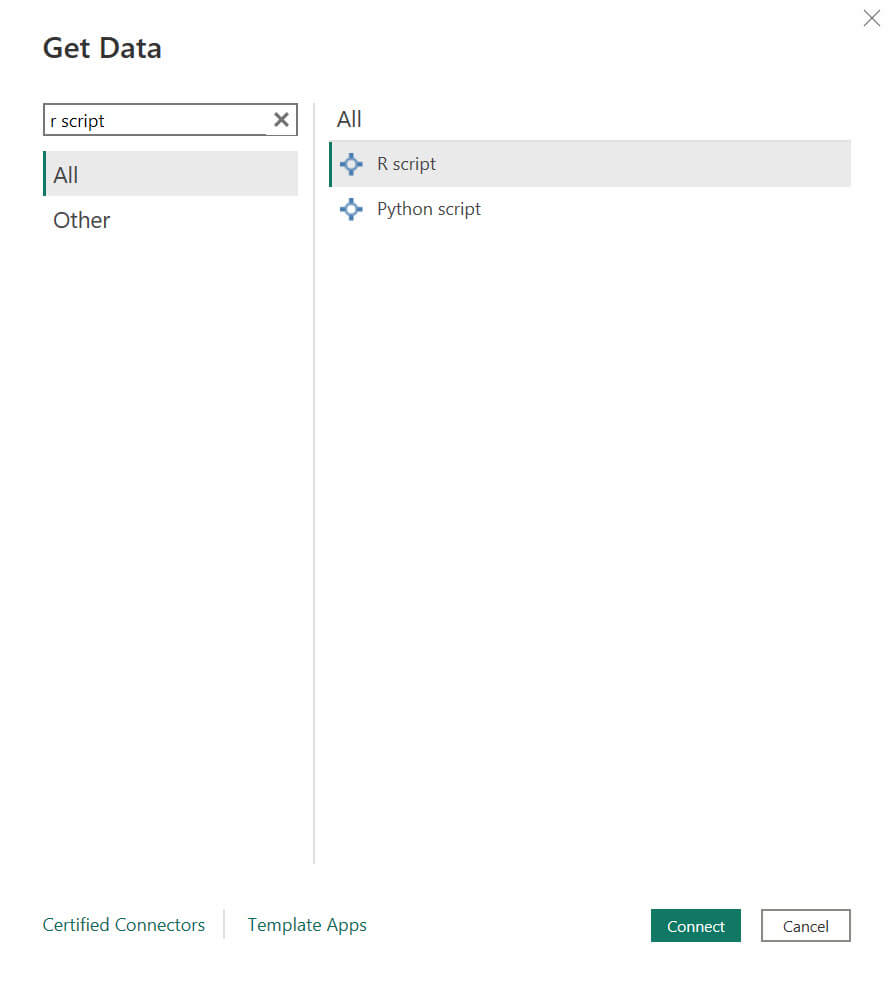
First, in Power BI Desktop, select the Get data option.

Secondly, in the search textbox, write the R script and press the Connect button.

Thirdly, in the R script window, we will get data from a well-known dataset named iris. We will use the data function for that. In addition, write the following R script to get data from the iris dataset and press OK:
Data(iris)
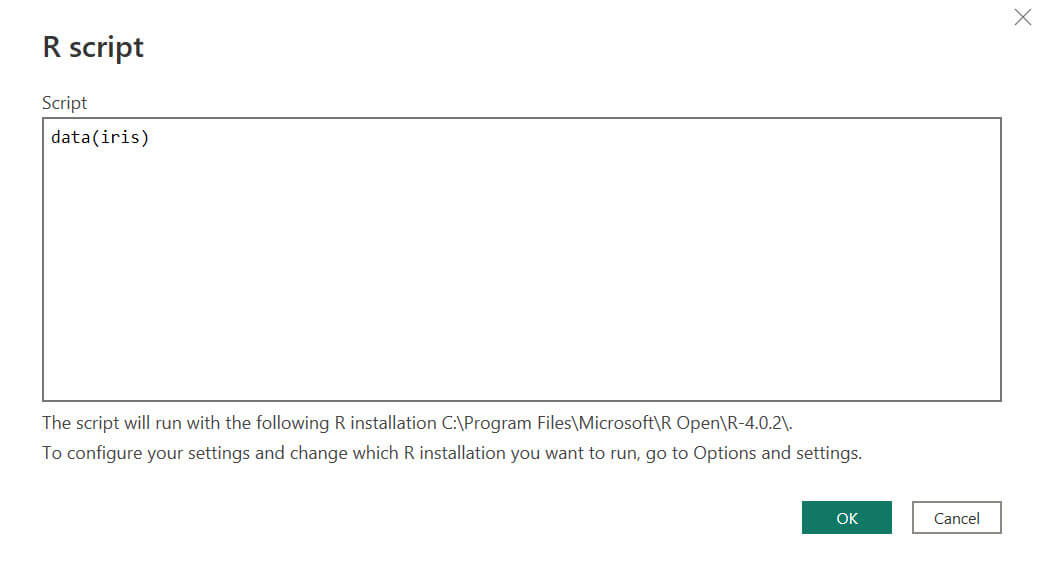
Also, check the iris table and press the Load button.

The iris table contains the Length and width of the iris’ petals and sepals.

This data set is commonly used in data science to study multivariate data. The data collects the sepal length, Sepal Width, Petal width and Petal length. 50 samples of data are collected for each species of iris: the setosa, virginica and versicolor.
For more information about the iris dataset, refer to this link: Iris flower data set.
Create scattered visuals from data imported in Power BI using R
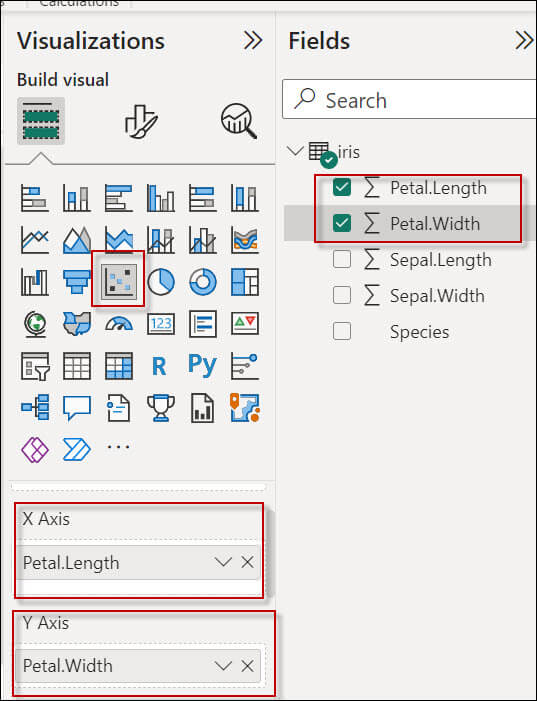
First, we imported data using R. We imported a dataset named iris. Now we are going to create some charts with the data. Check the Petal.Length and Petal.Width fields.
Secondly, select the scattered chart visual.
Thirdly in the X axis, drag and drop the Petal.Length and in the Y axis, drag and drop the Petal.Width.
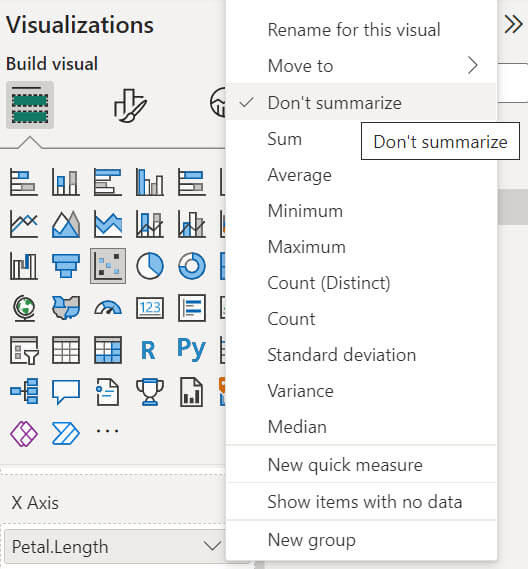
The Fields by default show the totals. We do not want the sums, but just the values.
To do that, select the X Axis and click on the Petal.Lenght. Select the Don’t summarize option.
Also, repeat the same steps for the Petal.Width, click on the Petal.Width in the Y Axis and select the Don’t summarize option.
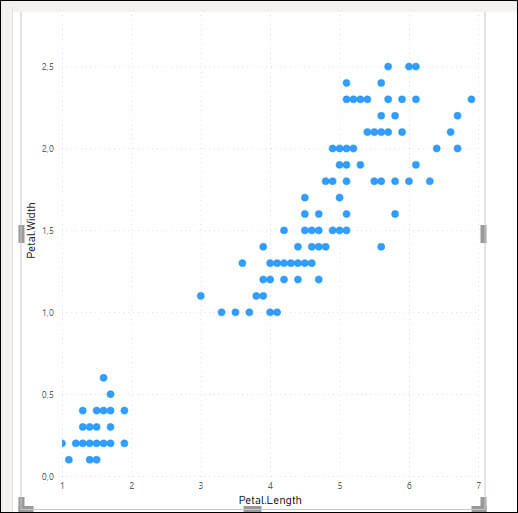
Finally, if everything is OK, the visuals will show a chart like this one.
Modify data using R
Previously, we show how to import data using the R script option. Now, we will show how to modify the data using the R script. We will use the data already imported.
First, in fields, select the iris table, right-click and select Edit query.

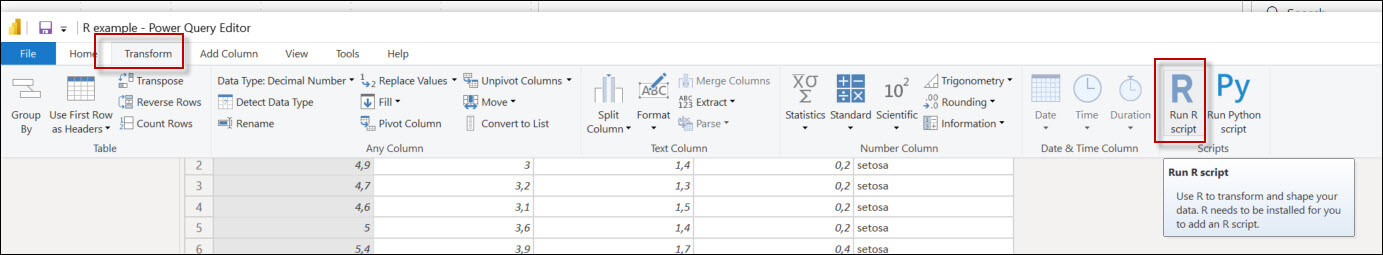
Secondly, in the new Windows select the Transformation option in the menu and select the Run R script icon.
Thirdly, in this example, we will use the head function and select the first 5 rows of the dataset. The dataset is the iris data and press OK. The output will store the information used by the head function.
output <- head(dataset,5)

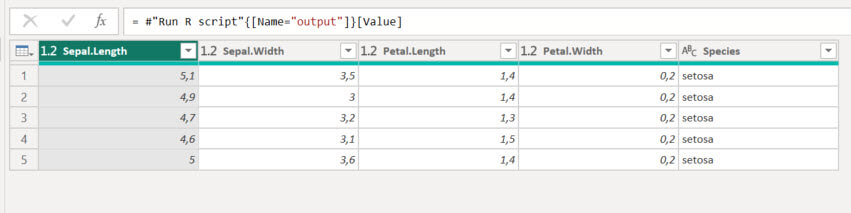
Also, if everything is OK, the function will show the first 5 rows.
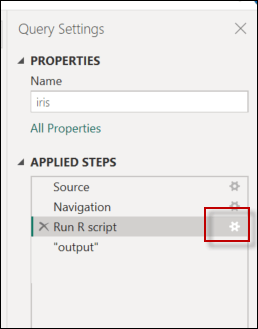
In addition, you can use the applied steps to redo and undo some steps.

To edit the script, click on the configuration of the Run R Script step.
The following code will show the last 10 rows of the dataset using the tail function.
output <- tail(dataset,10)
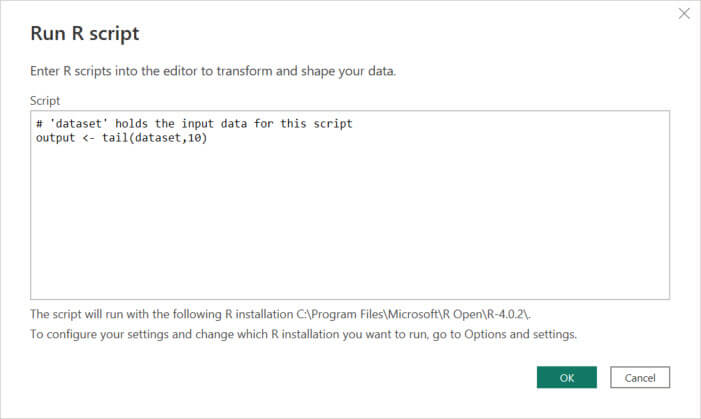
Finally, if everything is OK, you will see 10 rows:
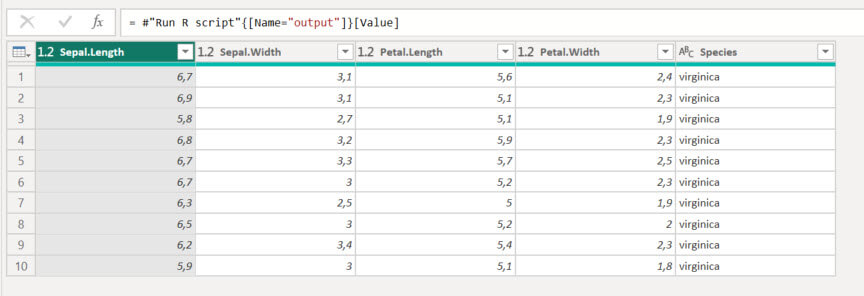
How to import data in Power BI using R and the read.csv function
Another way to import data in Power BI using R is using the read.csv function. This function reads csv files. I will include iris.csv in the resources to download. In this example, I stored the iris.csv file in the c:\data folder. To import data from a CSV file, follow these steps:
First, in Power BI press the Get data icon.

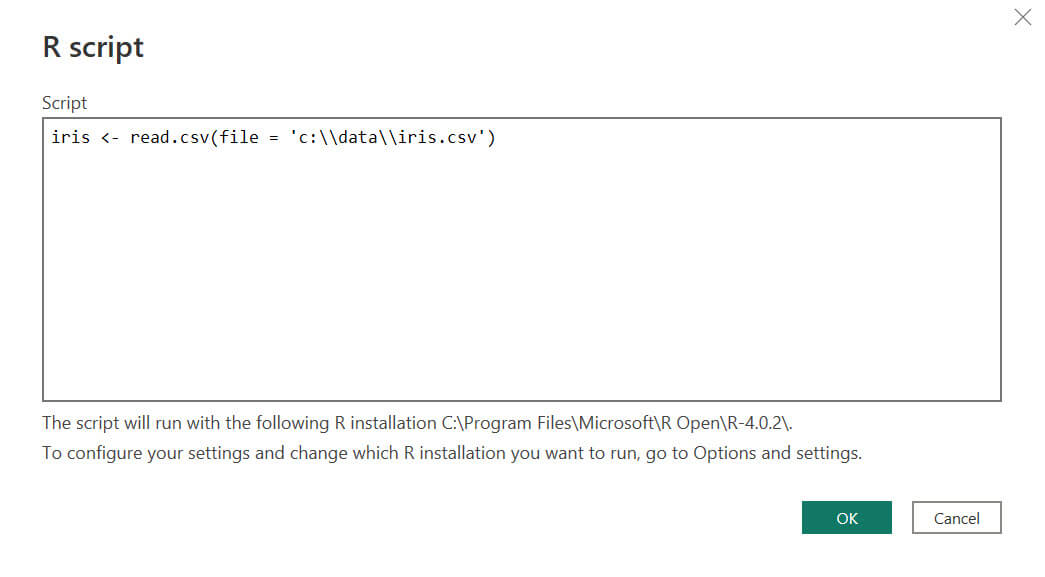
Secondly, look for the R script and press connect.
Write the following R code and press OK.
iris <- read.csv(file = 'c:\\data\\iris.csv')
Note that we need a double backslash (\\) for the paths.
Load the data and create your charts with the data imported.
Conclusion
In this article, we saw how to import data in Power BI using R. We can transform the data with R script of any dataset or import the data using R.