Introduction
In this article, we will learn how to use Python in Azure Data Studio. Azure Data Studio is a great tool to handle your data, work with your notebooks and create your code. Python is one of the most popular programming languages in the entire world and the demand is growing. As DBAs and developers, we need to include Python as part of our knowledge because the demand for this tool to handle data is growing.
In this article, we will learn the following topics.
- First, we will learn how to use Python in Azure Data Studio and install the requirements.
- Secondly, you will write your first hello world code in Python with Azure Data Studio
- Thirdly, we will learn how to ask for input in Python with Azure Data Studio
- Also, we will learn how to show a list of files and directories from a file in Python.
- In addition, we will connect to SQL Server using the pyodbc library.
- Next, we will learn how to filter columns and rows using Python in Azure Data Studio.
- Moreover, you will learn how to filter null values with Python.
- Finally, we will create charts of SQL Server data with Python in Azure Data Studio.
Requirements
First, you will need to have Azure Data Studio installed. If you do not have Azure Data Studio installed, please follow this link: Installing Azure Data Studio
Secondly, in my case I have Python installed, but I will show the option to install if you did not do it yet.
Finally, we will use the Adventureworks database. This is a SQL Server database. If you don’t have it, please follow this link and look for the Adventurework section: SQL Server Sample Databases
Using the Python 3 cluster
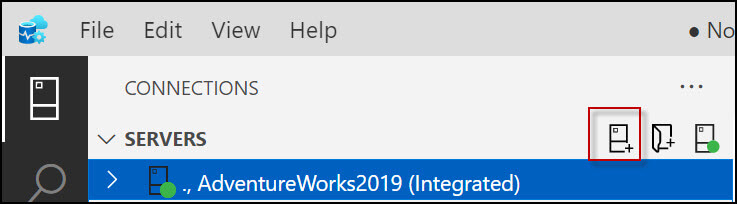
First, we need a connection. Press the New Connection icon to create a connection. In this example, connect to SQL Server.
Secondly, in connection type, select Microsoft SQL Server. Write the SQL Server name which in this case is the local host. Usually, the Windows Authentication is used. Otherwise, use your SQL login assigned. Select a Database and press connect. Windows Authentication means using your Windows Account to log in.

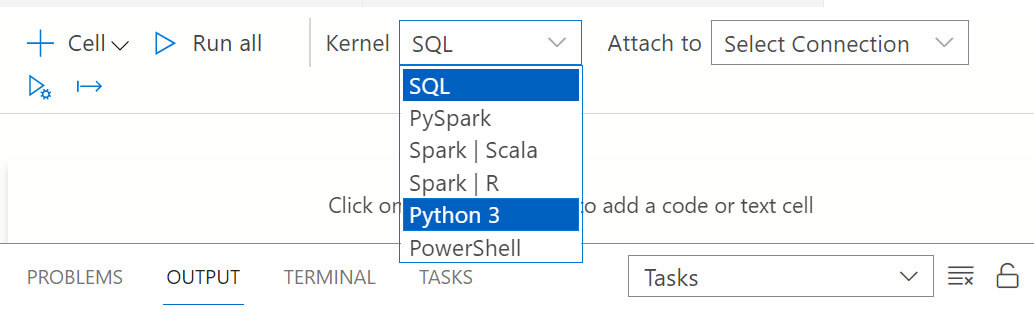
Thirdly, in Kernel, select Python 3.

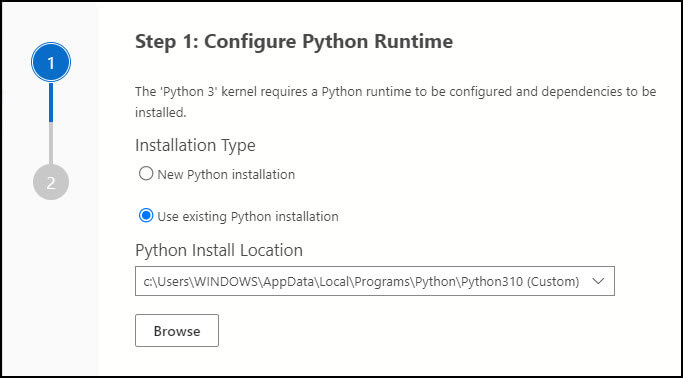
Also, if you do not have Python installed, select New Python installation to install it. Otherwise, chose the path where your Python is installed.
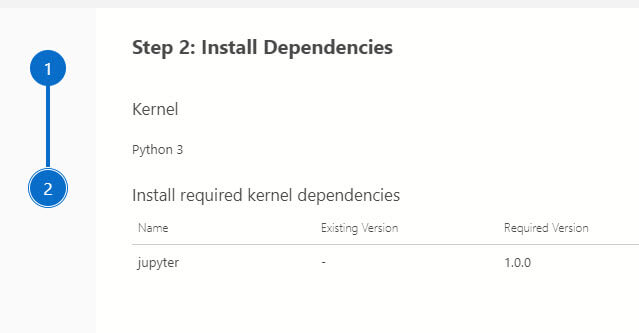
The software will ask you to install dependencies. In this case Jupyter.
Finally, you will be able to run the Python code.
Writing your first hello world code in Python with ADS
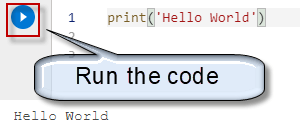
First, we will print the hello word.
print('Hello World')Finally, run the code and you have your first hello world example.
Asking for input in Python with Azure Data Studio
In this example, the code asks for the name and Azure Data Studio will answer using the input function. This example will work with variables and shows how to concatenate a message with a variable.
name = input("Enter your name: ")

print("Hello " + name)
If you run the code, Python asks your name.

Finally, Python will answer.
Hello sqlservercentral
Note that you do not need to define the data type for the name variable. Python is very simple to use and learn and requires a few lines of code. The main problem that people find is the indentation problem. Python is very sensitive to spaces and tabs.
How to list files and folders of a given path in Python with Azure Data Studio
There are several powerful libraries in Python that you can include for different purposes. In this example, we will use the os library. First, let’s take a look at the code.
import os

path = "c:/data"

listDirectories = os.listdir(path)

print(listDirectories)
This code lists the files and directories inside the data folder in the c: drive.

The code imports the os library using the import os.
import os
Also, we store the path in the path variable.
path = "c:/data"
In addition, we list the directories using listdir function and store them in the listDirectories variable. Finally, we display the data with the print function.
listDirectories = os.listdir(path)

print(listDirectories)
The os library is very powerful and you can create, delete, modify directories, list directories, and files, get process information, paths, user and group information, and more.
How to connect to SQL Server and Python with Azure Data Studio
First, in the command line, you will need to find the scripts folder of Python and install the pyodbc and the pandas libraries if they were not installed yet.
Search for the Python folder if you do not know the path of your Python installation.
In my case, the Python path is here.
C:\Users\WINDOWS\AppData\Local\Programs\Python\Python310\Scripts
Run the following commands to install the libraries.
- pip install pyodbc
- pip install pandas
Once installed, run the following code.
import pyodbc

import pandas as pd

conn = pyodbc.connect('Driver={SQL Server};'

'Server=.;'

'Database=AdventureWorks2019;'

'Trusted_Connection=yes;')

df = pd.read_sql_query('SELECT * FROM Sales.SalesPerson', conn)

print(df)
The code connects to the Sales.SalesPerson table from the AdventureWorks2019 database.
Let me explain the code.
First, we import the pyoldbc library to connect to SQL Server and pandas to handle the data.
import pyodbc

import pandas as pd

Secondly, we will connect to SQL Server. Server will store the SQL server’s name. Database is the name of the SQL Server database and trusted connection=yes means to use the Windows account to connect to SQL Server.

conn = pyodbc.connect('Driver={SQL Server};'

'Server=.;'

'Database=AdventureWorks2019;'

'Trusted_Connection=yes;')

Thirdly, we will send and show the query to the sales.salesperson table.

df = pd.read_sql_query('SELECT * FROM Sales.SalesPerson', conn)

print(df)
Finally, the results displayed are the following.

Can we filter the columns and rows in Python?
Yes, take a look at the next section.
How to filter columns and rows using Python
The next example shows how to filter the SQL Server data. We will show specific columns and only the first rows.
import pyodbc

import pandas as pd

conn = pyodbc.connect('Driver={SQL Server};'

'Server=.;'

'Database=AdventureWorks2019;'

'Trusted_Connection=yes;')

df = pd.read_sql_query('SELECT * FROM Sales.SalesPerson', conn)

df=df[["TerritoryID","SalesQuota","Bonus"]]

df=df.head(10)

print(df)
First, we have the same code as the previous example. Except for 2 lines.
df=df[["TerritoryID","SalesQuota","Bonus"]]

df=df.head(10)
The first line includes only the TerritoryID, SalesQuota, and Bonus in the dataset. The other columns are no longer included in the dataset.
Also, in the second line, we use the head function to include only the first 10 rows. The result is the following.
Finally, you can see 10 rows and only 3 columns.
How to filter null values with Python
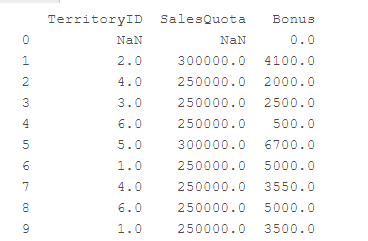
In addition, you can see in the data that there are some NULL values. In Python, NaN means Not a Number. If we want to filter the NaN values, we can use the dropna() function like this:
df=df.dropna()
The code will be the following.
import pyodbc
import pandas as pd

conn = pyodbc.connect('Driver={SQL Server};'

'Server=.;'

'Database=AdventureWorks2019;'

'Trusted_Connection=yes;')

df = pd.read_sql_query('SELECT * FROM Sales.SalesPerson', conn)

df=df[["TerritoryID","SalesQuota","Bonus"]]

df=df.head(10)

df=df.dropna()

print(df)
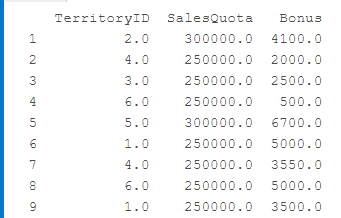
Finally, the result will show 9 rows excluding the Nan Column.
How to create Charts of SQL Server data with Python in Azure Data Studio
Something that I love about Python is the number of libraries created for charts. There are several advanced charts in Python. In this example, we will connect to SQL Server, to the sale Sales.SalesPerson table and using the same connection used in previous versions.
import pyodbc

import pandas as pd

import matplotlib.pyplot as plt

conn = pyodbc.connect('Driver={SQL Server};'

'Server=.;'

'Database=AdventureWorks2019;'

'Trusted_Connection=yes;')

df = pd.read_sql_query('SELECT * FROM Sales.SalesPerson', conn)

df=df[["TerritoryID","SalesQuota","Bonus"]]

df=df.head(10)

df.plot(kind='bar', x='SalesQuota', y='Bonus', color='red')

plt.show()
First, I am including the matplotlib.pyplot library which is very common in Python to generate plots.
The code to connect to SQL Server was already explained in previous examples, the only new lines that require an explanation are the following.
df.plot(kind='bar', x='SalesQuota', y='Bonus', color='red')

plt.show()
Secondly, we are creating a plot with bars. Also, the x-axis is the SalesQuota column from the salesperson table and the y-axis is the Bonus column from the same table. The color of the bars is red.
Here you have the plot generated.
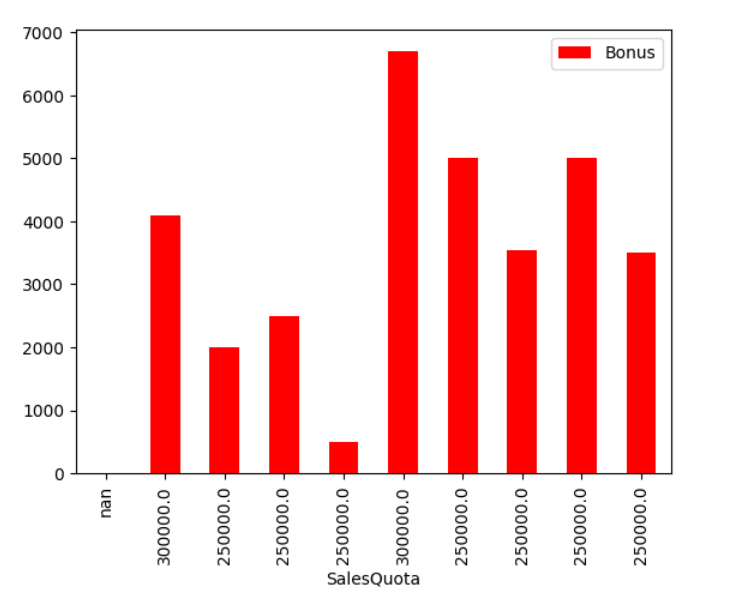
As you can see, it is a bar chart with red bars.
Conclusion
To conclude, we can say that Python is a very simple and intuitive language. Also, you can use Python to create any kind of application. In this example, we used it mainly to handle folder information, retrieve SQL Server data and create charts.