

The performance of a Power BI semantic model – formerly known as dataset - depends on a variety of factors. One of the biggest influences is the data model itself: did you put everything into one single big table (you might found out writing DAX might get complicated), did you use a star schema as the foundation or did you just import all the tables in 3rd normal form from the source system (you might found out writing DAX might get really complicated).
I’ve been advocating to use always use the star schema unless your use case dictates otherwise. Using a proper dimensional model will lead to better performance and usually DAX will be easier to write as well. You don’t have to take my word for it, but maybe the documentation and some industry-leading Power BI experts can convince you otherwise.
The focus of this article is not about dimensional modelling though, it’s about optimizing your existing data model. Assuming we have built a nice star schema, how can we optimize this further? To do this, we’re going to use an 3rd party tool called Vertipaq Analyzer (which is written by those same industry-leading Power BI experts). Even though we’re focusing on Power BI here, you can use the same methods to optimize an Analysis Services Tabular model (or even Power Pivot, also known as the Excel data model).
Knowing when and how to use external tools for Power BI is required knowledge for different certification exams, such as the DP-500 (to be retired on April 30, 2024), the PL-300 and the new DP-600 exam (the certification for Microsoft Fabric).
How to Get Semantic Model Metadata into Vertipaq Analyzer
The first step is to download the latest version of Vertipaq Analyzer, which is free. Basically, it’s a macro-enabled Excel file that is going to parse the metadata of a semantic model and present you all the metadata of its tables and columns in a couple of PivotTables. When we look at the instructions, we can see we need another tool as well: DAX Studio.
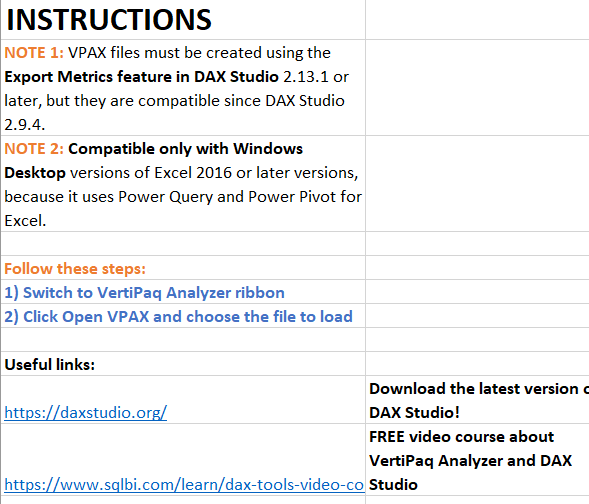
We will need DAX Studio – which is also a free tool – to create a VPAX file. This file will contain all the necessary metadata to do our analysis. Download and install the software on your machine.
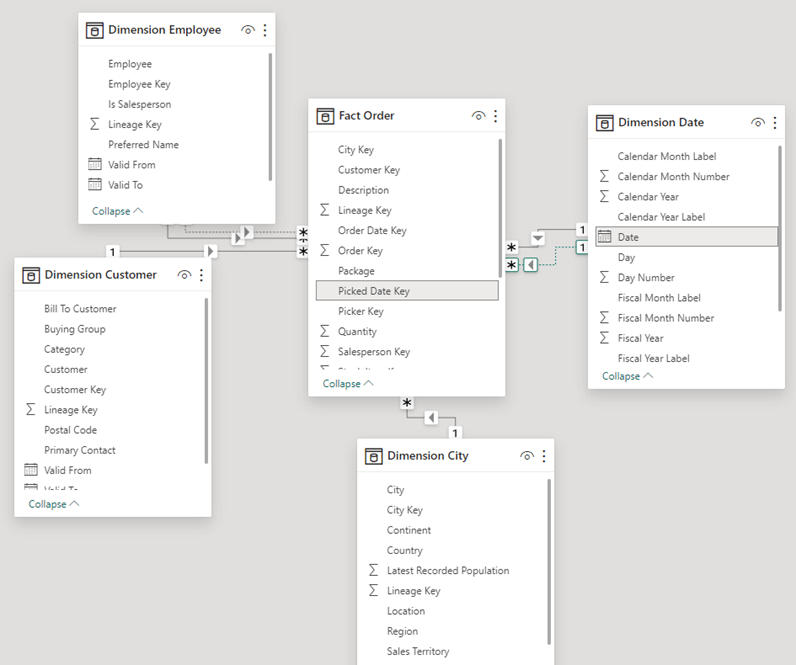
We need a Power BI semantic model to optimize, and I’m using a model with data from the Wide World Importers sample data warehouse. I imported the tables as-is from the database and created relationships between them.
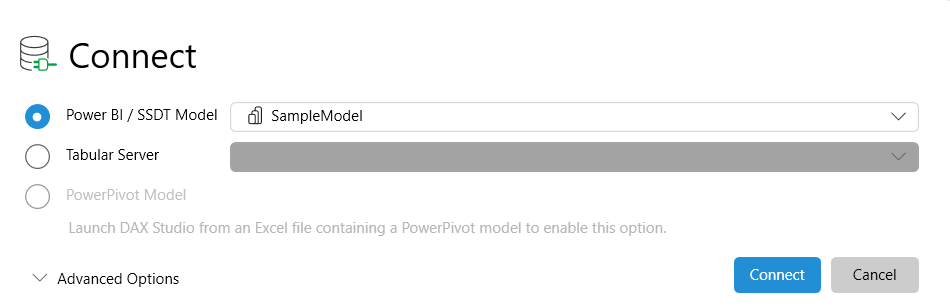
With Power BI Desktop open, start up the DAX Studio application. At startup, it’s going to ask you what model you want to connect to. Select Power BI / SSDT Model and choose the sample model from the dropdown list.
Once the model is opened, go to the Advanced tab and select Export Metrics.
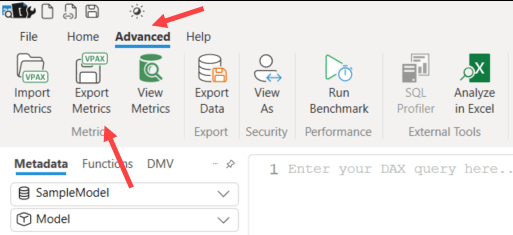
DAX Studio will extract the metadata of each table and its columns and save it as a .vpax file.
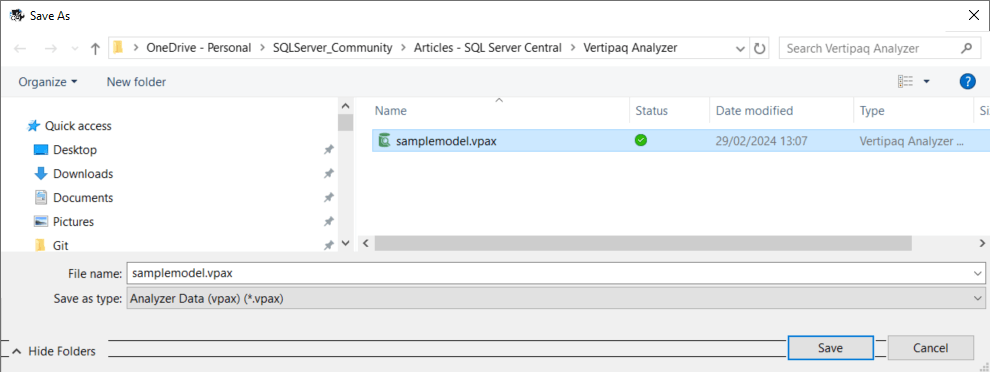
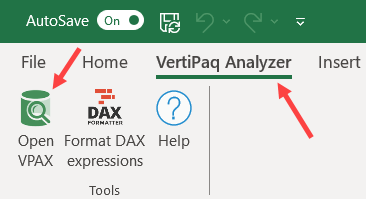
Back to the Vertipaq Analyzer Excel file. Go to the Vertipaq Analyzer ribbon and select Open VPAX.
Excel will load all the metrics from the VPAX into its own Power Pivot model. This means that any previously loaded data will be overwritten. After a couple of seconds, the metadata is presented to you in several PivotTables:
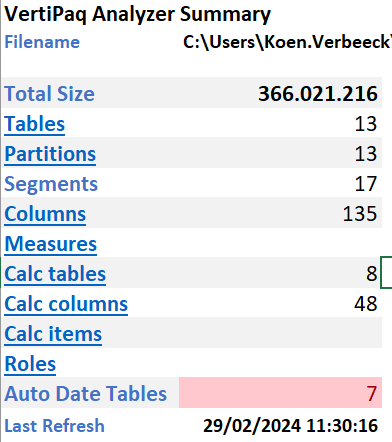
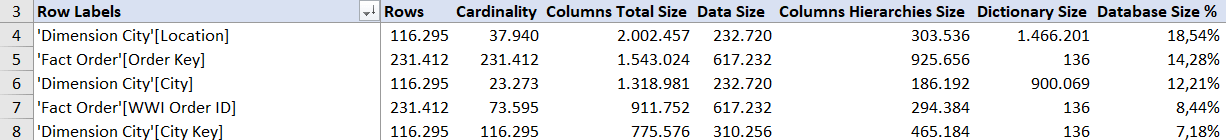
The total size is about 366MB (this is the size in RAM, the file size is about 60MB on disk. The following YouTube video explains why there’s such a big difference: What's the real size of your data model in Power BI?). The most interesting information is in the columns tab. There you can find a PivotTable with all the columns of the model, sorted from largest to smallest. If you want to optimize your model in terms of size and memory footprint, that’s where you start.
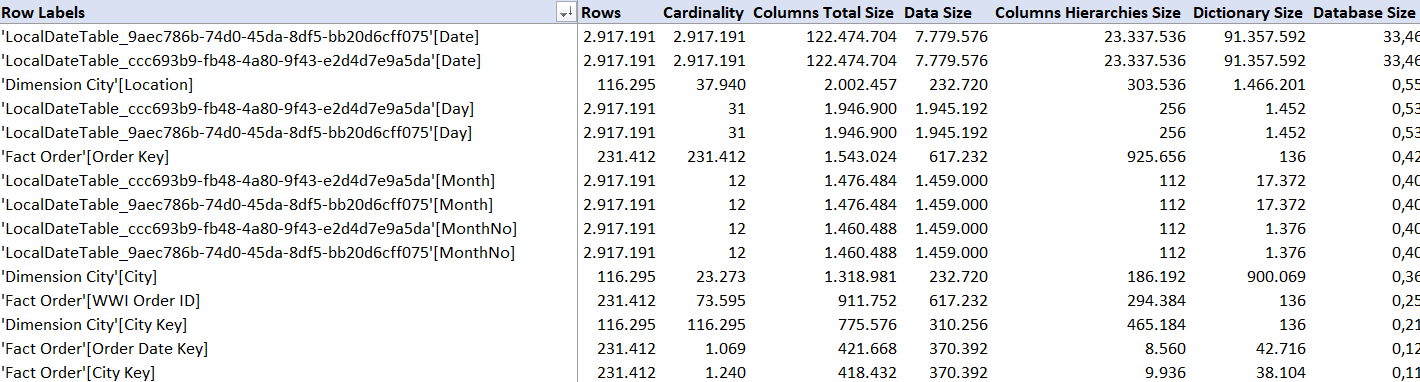
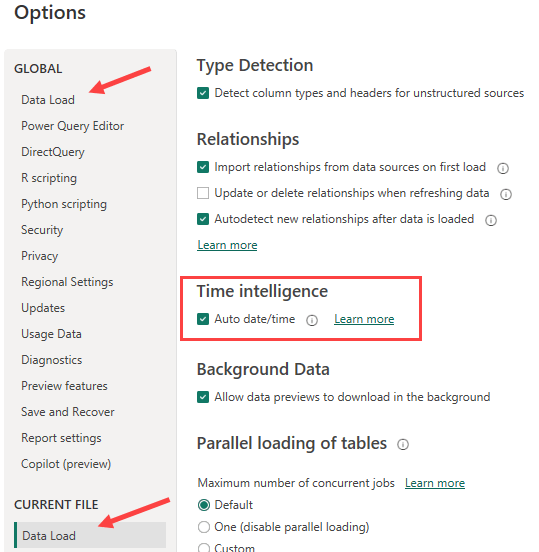
Typically, the bulk of a model is just a handful of columns. In this case, we can see a lot of columns are from LocalDateTable tables. What? We didn’t put such tables in the model. Where do they come from? These tables are created by a time intelligence feature called Auto date/time.
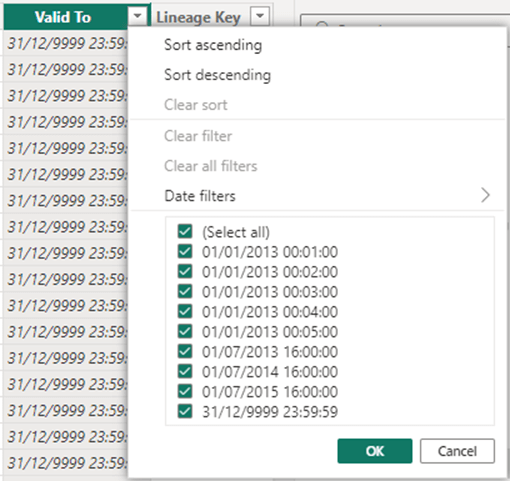
Basically, what this features does is creating a date table for every date column in your model. That’s right, every date column. This means that if you have 7 dates – like I had in the sample model – that you have 7 automatically created date tables. The size of the date table is determined by the min and max dates of that date column. When we look at the City dimension, we can see there’s a range from 2013 till 9999. Whoops, that’s a lot of dates.
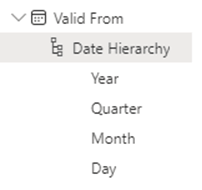
The reason those date tables are automatically created is so that you can use each date column directly in a visual and have a nice hierarchy available (year > quarter > month > date) without you having to build a date dimension yourself.
This might be nice for small models, but in bigger models with lots of dates this can really bloat your model. The solution is thus to always create your own date dimension. When we disable the auto date/time feature and reload all the metadata in the Vertipaq Analyzer, we get the following result:
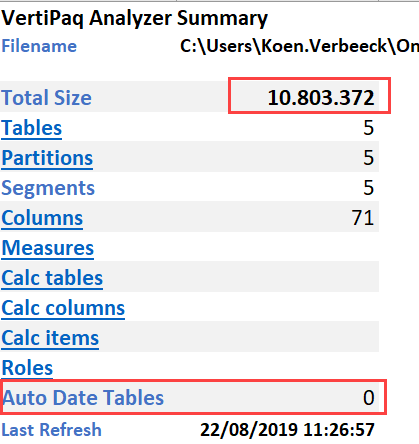
The total size has plummeted to a mere 10MB (about 8MB on disk) and the auto date tables have disappeared. Always disable the auto date/time feature!
Model Size Optimization Techniques
Now that we know how to get our metadata in the Vertipaq Analyzer, and that we have to get rid of auto-generated tables, we can start optimizing our models. There are a couple of guidelines that can help you with this task:
- Get rid of unnecessary columns. Make sure that every column that is present in the model fulfills a purpose. When we look at the columns tab now, we can see the City Location column is the biggest column of the model. This column alone is worth 18% of the total database size.

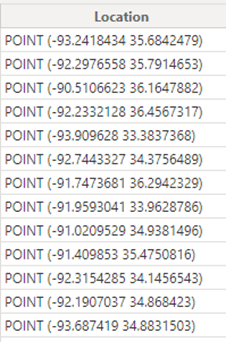
When we look at the data, we can see it is geographical information. The reason the columns is so big is because the data is hard to compress because it’s practically unique for each row. Unless you accurately want to plot data on a geographical map, you don’t need this column.
- Try to minimize the use of calculated tables and columns. Ideally, such calculations are down farther downstream, such as in the ETL or in the data warehouse. Matthew Roche, PM at Microsoft, has a nice blog post about this: Roche’s Maxim of Data Transformation.
- Reduce the cardinality of the columns. The more unique values a column has, the harder it is to compress it and how bigger the dictionary will become. For example, if you have a datetime column up to the second, there are a lot of possible values. If you only need the date portion, just truncate the time portion. There are only 365 possible dates in a year, so this will compress much better. The same goes for numbers. The more digits behind the decimal point, the harder it is to compress the column. Do you really need a 6 digits scale? Two are probably fine.
- Disable Column Hierarchies. This is more advanced optimization technique. Because Excel PivotTables need to work on Power BI semantic models, Power BI needs to support MDX. In that language, each column has its own hierarchy (remember the all member from SSAS Multidimensional?). However, if you’re sure a column will never be displayed as a filter, slicer or axis of a visual, you can disable this hierarchy. Good candidates are measures and surrogate keys. You can learn more on how to disable those hierarchies in this YouTube video or in this article.
- The last option is influencing the encoding. This is also quite advanced, and is explained in the article Power BI VertiPaq Engine: Optimizing Column Encoding.
Conclusion
With the free tools DAX Studio and Vertipaq Analyzer it’s easy to see which columns in your Power BI model contribute the most to the overall size. You can have some quick wins by disabling the auto date/time feature and by deleting columns you don’t need. The Power BI Desktop file is included in the resources if you want to try it out yourself. The auto date/time feature is disabled to make the model smaller for download.
