One of the most important things in database administration is monitoring. For example, you want to know if unauthenticated users are reading data, if the system is throwing errors, if there is wrong data somewhere, and the amount of time that sessions are taking. This monitoring needs automation to catch things up when they occur. Relying solely on manual log reviews is inefficient and prone to oversight. Initiative-taking monitoring prevents escalation of issues before end users report them to management.
SQL Server has a flight recorder since version 2008, named “system_health*.xel”, and you can read it using T-SQL. SQL Server Analysis Services (SSAS) also has a flight recorder, named “FlightRecorder*.trc”, but since it is a trace file you cannot automate reading it. Therefore, it is often necessary to build a custom flight recorder by creating an Extended Events (XE) trace, which logs the events in which you are interested.
First, I will show you a quick way to do it. Then, I will explain the underlying logic so you can modify it according to your needs.
Download my GitHub template here: https://github.com/pabechevb/SSAS/blob/main/FlightRecorderXel.xmla. Then, modify this line to match your environment:
“<parameter name="filename" value="D:\MSSQL\OLAP\Log\FlightRecorder.xel" />”
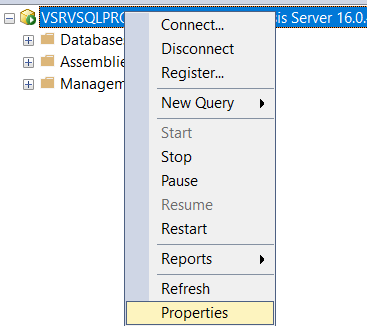
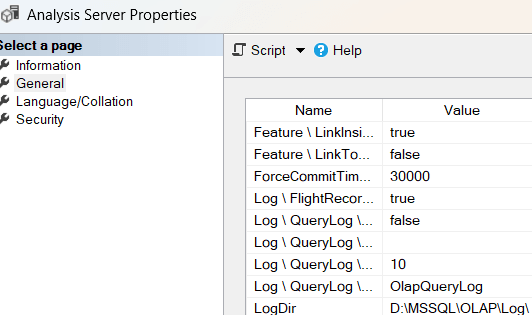
A recommended practice is to place the file in the same directory as the default flight recorder; you can find its location in the Analysis Services properties, in the General tab, the “LogDir” property:
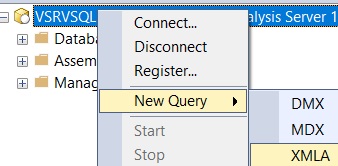
In Analysis Services, open a new XMLA query:
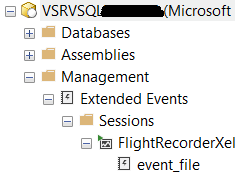
Then, paste the code and run it. The new trace will appear under Management -> Extended Events -> Sessions:
And now, you can query the flight recorder programmatically. The following query retrieves events recorded in the last 15 minutes:
SELECT DATEADD(MI, DATEDIFF(MI, GETUTCDATE(), GETDATE()), timestamp_utc) [DateTime], CAST(event_data AS XML) [EventData]
FROM sys.fn_xe_file_target_read_file('D:\MSSQL\OLAP\Log\FlightRecorder*.xel', NULL, NULL, NULL)
WHERE CAST(timestamp_utc AS DATETIME) >= DATEADD(MI, -15, GETUTCDATE())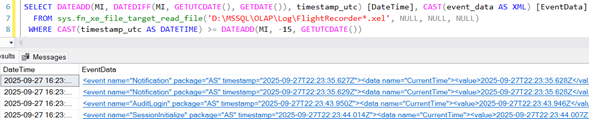
Now, here is the explanation. In SQL Server Analysis Services (SSAS), the file FlightRecorderTraceDef.xml is the definition file that tells SSAS flight recorder which events and columns to capture in its rolling trace. In a default installation, it is in “C:\Program Files\Microsoft SQL Server\<InstanceID>\OLAP\Config\”.
The flight recorder, by default, includes:
- Query events (begin, end)
- Session lifecycle (initialize, terminate)
- Errors and warnings
- Lock events (acquire, release)
For a detailed description of the SSAS Flight Recorder events, see: https://byobi.wordpress.com/2016/01/15/ever-wondered-whats-captured-in-the-ssas-flight-recorder/
And what about the SSAS extended events? Through testing and documentation review, I identified the following useful events:
- Security/Audit events (Admin operations, Logins, Permissions)
- Errors (general, MDX, DAX, progress, command errors)
- Concurrency issues (Deadlock, LockTimeout, LockWaiting)
- Session lifecycle (SessionInitialize)
- Notifications + UserDefined hooks
If you want to define your own extended events, when connected to Analysis Services, go to Management -> Extended Events -> Sessions -> right click and select “New Session…”. In the first tab just enter the name, then select the tab “Events”:
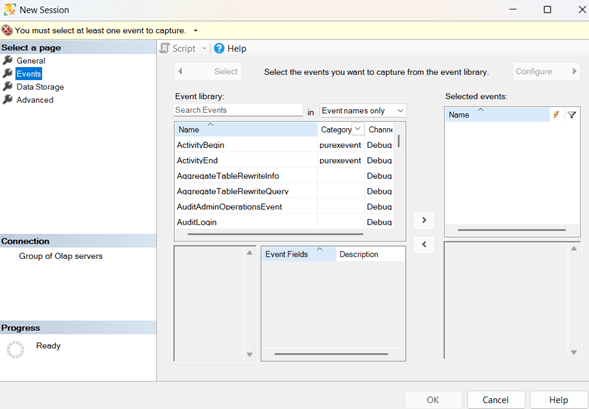
Here you need to select which events you want to capture; once selected, click on the “>” button in the middle between “Event library” and “Selected events”. Once added, select it on the right panel and in the upper right corner, click on “Configure”:
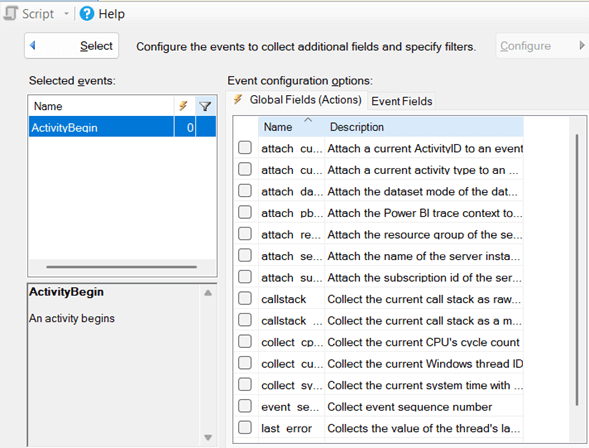
There you need to select the actions to capture. Once done, click on the upper left button “Select” to return to the previous screen. As a best practice, limit the number of events captured to reduce overhead.
Next, you need to specify the data storage:
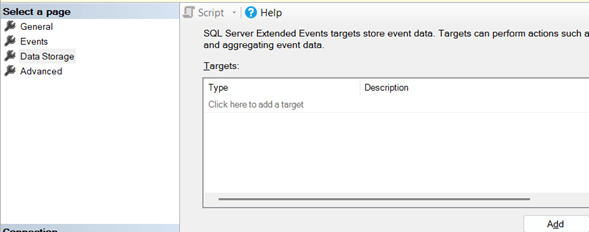
As a best practice, store the trace file in a location with sufficient disk space.
And finally, the advanced event options:
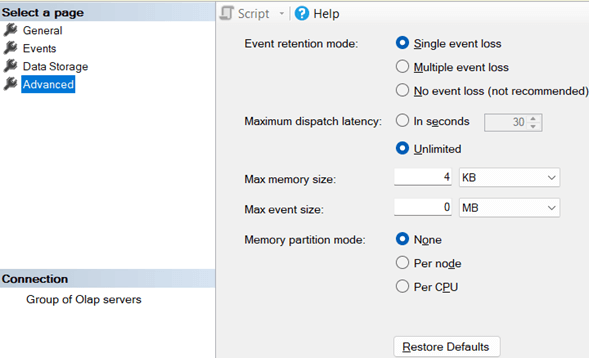
As best practice, specify “Single event loss”, “Unlimited” maximum dispatch latency, 4 MB max memory size, and 1 MB max event size. The memory partition mode depends on your CPU configuration.
By configuring a personalized flight recorder, administrators gain initiative-taking insight into system usage, security, and performance. This approach enables real-time troubleshooting, better auditing, and more efficient monitoring of SSAS environments.