

Introduction
In this article, I'm going to introduce the basics of the Statistical Functions - Mean, Median and Mode and how can these be calculated using SQL and DAX. The mean, median and mode are the three most widely used kinds of "averages" in statistics. I think these are very common and you're likely to encounter one or all of these in any statistical inference while working or performing some kind of data analysis.
Let's get started and understand the concepts within.
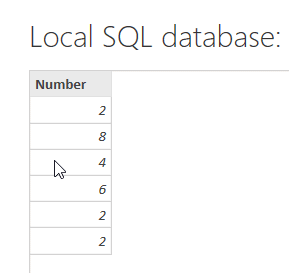
In this tutorial, I will consider the following series and calculate all the averages based on this only.
Series = 2, 8, 4 ,6, 2, 2
Mean
The mean is also known as the average of all the numbers in a given series. It is calculated by adding up all the data points in the series and then dividing those by the total number of data points.
The mathematical formula for mean is denoted as follows:
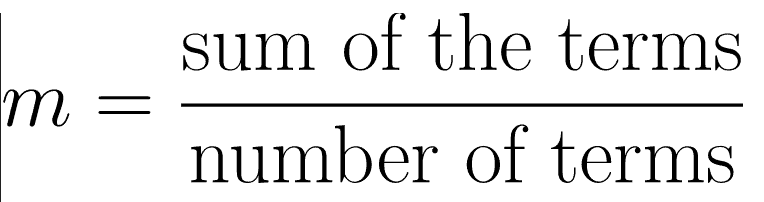
For example, let us calculate the mean of Series. When we add these values we obtain (2 + 8 + 4 + 6 + 2 + 2) = 24. Since the number of data points is 6 in this case, the mean is calculated as 24/ 6 = 4.
Thus, the mean of the Series is 4.
Median
Median is calculated by ordering all the data points from the series in ascending order and then picking out the middle data point from it. If there are two middle data points, then the median will be calculated as the mean of those two numbers.
The mathematical formula for calculating the median is as follows:
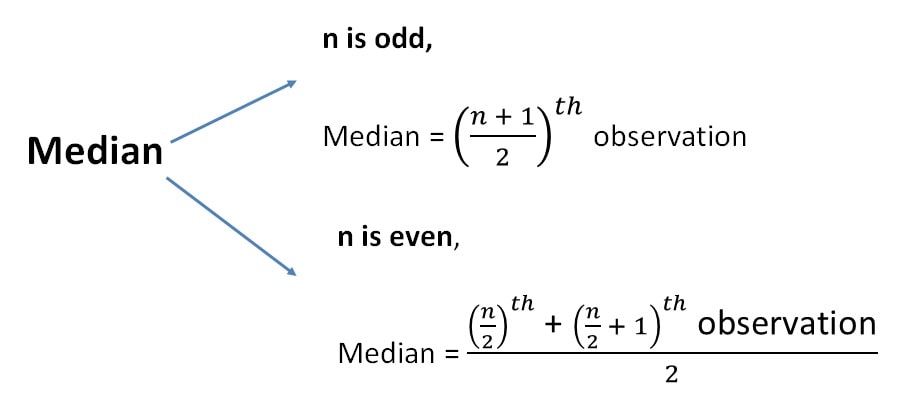 Fig 2 - Median Formula
For example, let us consider the earlier series. In order to calculate the median, the first step would be to arrange the series in ascending order and that will be 2, 2, 2, 4, 6, 8. Now, that the value of n, in this case, is 6 (even number). Notice that there are now, two numbers in the center - 2 and 4. In such a case, the median will be calculated as (2 + 4) / 2 = 3.
Let us consider another example, by removing one number from the Series, so that it becomes - 2, 2, 4, 6, 8. Now, according to the above formula, since n = 5 (odd number), the data point in the position (n + 1) / 2 = 3 is 4, which is calculated as the median.
Mode
The mode is calculated as the data point which occurs most frequently in a given series. In other words, it is the most common number in a dataset. Mathematically, there is no formula mode, as it just takes into account the most frequently occurring items from the list.
 Fig 3 - Mode Graph
Let us consider the same series again - 2, 8, 4, 6, 2, 2.
In this series, the number 2 appears thrice while all the other numbers appear only once. Thus, the frequency of 2 is 3, while that of others is 1. Since 2 is the highest frequency in the series, the mode for this series is also 2.
Calculations in SQL
In the following sections, I'll be using the same series as used in the example above to calculate all the three functions mentioned and demonstrate the scripts in SQL.
Let us first prepare our dataset on which we will be performing all the calculations.
CREATE TABLE #TempStats(
    [Number]    INT
)
GO
INSERT INTO #TempStats ([Number])
VALUES (2),(8),(4),(6),(2),(2)
GO
Mean
It is the simplest of all the calculations. We just need to calculate the average of all the values in the series, which can be computed as follows.
--Mean
SELECT AVG([Number]) AS [Mean] FROM #TempStats

Results
Mean
-----------
4
(1 row affected)
Median
In order to calculate the median, we need to sort the series in ascending order and then divide it into two equal halves. I'll show in a step-by-step process how it can be done using SQL.
Let us first sort the series and fetch the results.
SELECT
    [Number]
FROM #TempStats
ORDER BY [Number]
GO

Results
Number
-----------
2
2
2
4
6
8
(6 rows affected)
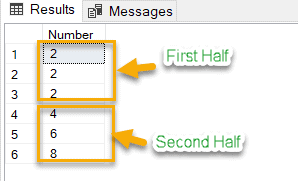
As you can see in the image above, the series has been sorted and we have identified the first and the second halves as well.
The next step here is to consider the highest value from the first half and the lowest value from the second half. In this case, 2 from the First Half and 4 from the second half. In order to do that, we will write two select statements and fetch the results. We will be using the TOP 50 PERCENT in SQL to achieve this.
-- Selecting first half
SELECT TOP 50 PERCENT [Number] [FirstHalfNumber]
FROM #TempStats
WHERE [Number] IS NOT NULL
ORDER BY [Number] ASC
-- Selecting second half
SELECT TOP 50 PERCENT [Number] [SecondHalfNumber]
FROM #TempStats
WHERE [Number] IS NOT NULL
ORDER BY [Number] DESC

Results
FirstHalfNumber
-----------
2
2
2
(3 rows affected)
SecondHalfNumber
-----------
8
6
4
(3 rows affected)
Now that we have both the resultsets ready, we need to extract the highest number from the first half and the lowest number from the second half. This can be done as follows.
-- First Half Highest
SELECT TOP 1 [Number] [FirstHalfHighest] FROM (
    SELECT TOP 50 PERCENT [Number]
    FROM #TempStats
    WHERE [Number] IS NOT NULL
    ORDER BY [Number] ASC
) FirstHalf
ORDER BY [Number] DESC
-- Second Half Lowest
SELECT TOP 1 [Number] [SecondHalfLowest] FROM (
    SELECT TOP 50 PERCENT [Number]
    FROM #TempStats
    WHERE [Number] IS NOT NULL
    ORDER BY [Number] DESC
) SecondHalf
ORDER BY [Number] ASC

Results
FirstHalfHighest
----------------
2
(1 row affected)
SecondHalfLowest
----------------
4
(1 row affected)
Once we have both these values ready, the final step is to calculate the average of these two numbers and we will have the median value of the entire series. The overall script is as follows.
-- Calculating the median
SELECT (
    (
        SELECT TOP 1 [Number] FROM (
            SELECT TOP 50 PERCENT [Number]
            FROM #TempStats
            WHERE [Number] IS NOT NULL
            ORDER BY [Number] ASC
        ) FirstHalf
    ORDER BY [Number] DESC
    )
    +
    (
        SELECT TOP 1 [Number] FROM (
            SELECT TOP 50 PERCENT [Number]
            FROM #TempStats
            WHERE [Number] IS NOT NULL
            ORDER BY [Number] DESC
        ) SecondHalf
        ORDER BY [Number] ASC
    )
) / 2 AS [Median]

Results
Median
-----------
3
(1 row affected)
Alternatively, there is another method to easily calculate the median in T-SQL. We can leverage the PERCENTILE_CONT function and obtain the same result. This is an analytical function in SQL which helps to calculate the percentile value in a continuous distribution of data values in a table. Since median is also defined as the 50th percentile of a series, we can use this function and calculate the 50th percentile.
The syntax of this function is as below.
SELECT PERCENTILE_CONT(Percentile Value)
       WITHIN GROUP ( ORDER BY Clause)
        OVER ( PARTITION BY Clause )
FROM [TableName]- Percentile Value -The Percentile to be computed. This value should be between 0.0 and 1.0.
- ORDER BY clause -This will sort the data in a specified order within the group.
- PARTITION BY clause - It divides the records selected by the SELECT statement into separate partitions.
In this example, we will not be using the PARTITION BY clause, since we want the entire series to be considered for calcualting the median. Let's see it in action.
SELECT DISTINCT PERCENTILE_CONT(0.5)
WITHIN GROUP(ORDER BY [Number]) OVER() AS [Median]
FROM #TempStats
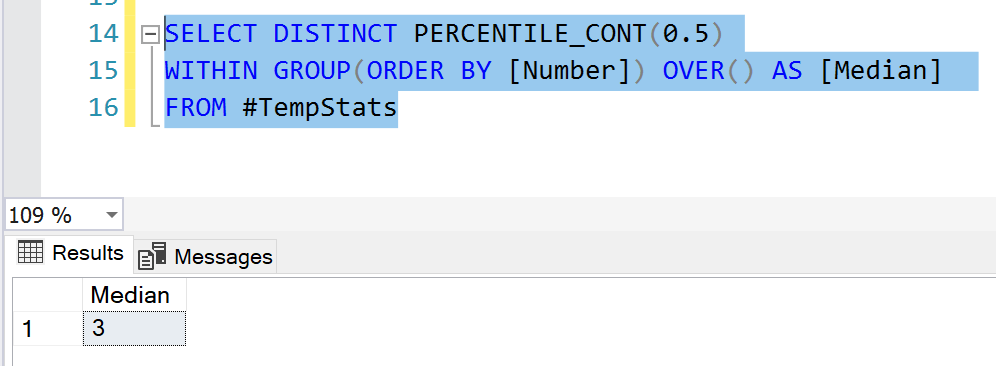
This is how the median can be calculated using SQL.
Mode
Finding out the mode is SQL is also quite easy. The first step would be to get a distinct count of all the numbers in the series which can be done as follows.
-- Fetch the frequency for each number
SELECT [Number], COUNT(1) [Frequency]
FROM #TempStats
WHERE [Number] IS NOT NULL
GROUP BY [Number]

Results
Number      Frequency
----------- -----------
2           3
4           1
6           1
8           1
(4 rows affected)
As you can see in the results above, the frequency for the number 2 is 3, whereas it is 1 for all the other numbers. So, the final step to calculate the mode is just to display the number with the highest frequency.
--Mode
SELECT TOP 1 [Number] [Mode]
FROM #TempStats
WHERE [Number] IS NOT NULL
GROUP BY [Number]
ORDER BY COUNT(1) DESC

Results
Mode
-----------
2
(1 row affected)
Sometimes, it may so happen that there are two or more than two numbers in the series which have the same highest frequencies. In such a case, it becomes essential for us to display all the numbers which have the same highest frequency.
For example, let us insert three more numbers in the same table as follows.
INSERT INTO #TempStats ([Number])
VALUES (5),(5),(5)
GO
Now, as per the definition of mode, there should be two numbers 2 and 5 with the same frequency, i.e. 3. So, we must display both of these. This can be done by altering our previous script and adding the WITH TIES clause in SQL.
--Mode
SELECT TOP 1 WITH TIES [Number] [Mode]
FROM #TempStats
WHERE [Number] IS NOT NULL
GROUP BY [Number]
ORDER BY COUNT(1) DESC

Results
Mode
-----------
2
5
(2 rows affected)
Calculations in DAX
Let us now head over to Power BI and perform the same calculations but using DAX and not SQL. I'm using the same series in PowerBI just to keep the calculations the same.
Mean
In order to calculate mean, we will just use the AVERAGE function available in DAX and create a measure for it. The script to create a measure for the mean is provided below.
Mean = AVERAGE(Series[Number])
Median
There is already a formula available in DAX that does all the heavy lifting while calculating the median for any given series. We can leverage the MEDIAN function for the same. The script is as below.
Median = MEDIAN(Series[Number])
Mode
In order to calculate mode in PowerBI, we need to perform some calculations which will calculate the frequency of the numbers in the series during runtime, and then extract the numbers with the highest frequency. I have provided the script for the same below.
Mode =
MINX (
    TOPN (
        1,
        ADDCOLUMNS (
            VALUES ( Series[Number] ),
            "Frequency", CALCULATE ( COUNT ( Series[Number] ) )
        ),
        [Frequency],
        0
    ),
    Series[Number]
)
Let me explain how the calculations are performed here.
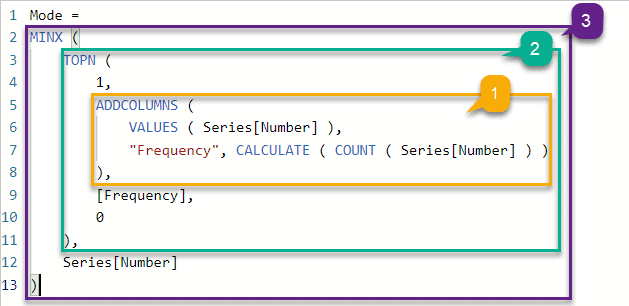
As you can see in the figure above, I have divided the calculations into 3 main parts. Let me go through each of these one-by-one.
- This is the very first part of the calculation in which we add a second column Frequency and store the count of Numbers in this column. An important point to note here is that, after adding a column, both the columns are together considered as a table. So, all the calculations will be performed on this table from now on.
- Once we have the count for all the Numbers, now we need to sort the table in descending order based on the Frequency. This is done by using the TOPN function in DAX. This function accepts 4 parameters to fetch the desired results.
- n = number of records that should be returned
- table = table on which the TOPN function is to be applied
- sort column = column from the table on which sorting is to applied
- sort order = (0 = descending, 1 = ascending)
- Finally, we display the minimum of the results obtained in the previous step to display as the mode value for the series.
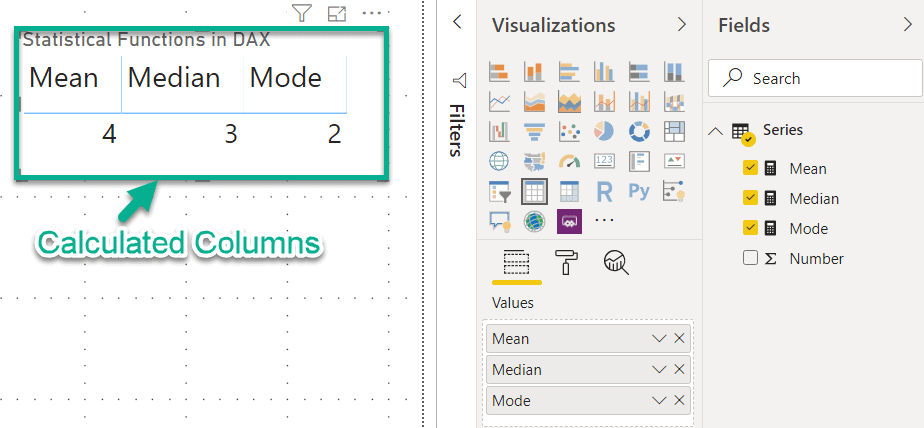
Final Touch in Power BI
Now that all the measures are created using DAX, we can just build up a table in PowerBI and fetch data from these three calculated measures. As you can see in the image below, we have obtained the same values in Power BI as from SQL.
Takeaway
In this article, I have described the basic statistical functions that are very essential in any kind of data analysis using SQL and DAX. The next step would be to learn more about the uses of these functions in detail.
- Read more about Median and its uses here
- Important Statistical Functions for Data Science
- ADDCOLUMNS Function in DAX
- TOPN Function in DAX