

When a server runs SQL Server, SSAS, Power BI Report Server, and other services, server-level memory metrics aren't enough. Process-level telemetry can show you what happened before everything stopped responding. This distinction becomes particularly important on servers hosting several Microsoft data and reporting components.
Introduction
I’m tired of the traditional solution to unexplained server problems: reboot the system and hope the problem goes away. Lately, users have been reporting Power BI Report Server stopped working, and the solution has always been the same: restart the service. Unless the system was unresponsive; in that case the solution has been to restart the server.
But who’s to blame when you have in the same box Analysis Services, Power BI Data Gateway, Power BI Report Server, SQL Server and Integration Services? And what do we do when Event Viewer doesn’t have any more information, and the logs of every program only show they entered into low memory mode but nothing more than that?
The Real-World Incident
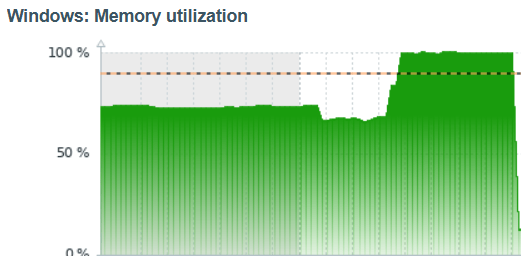
After I implemented this process-level monitoring using Zabbix, a new incident occurred which looked like another routine service failure. Memory usage reached 100%. Shortly afterward, the Zabbix service stopped logging metrics, and Power BI Report Server stopped generating invoices. Restarting PBIRS didn't fix the problem. Only a server reboot restored normal operation. The server was healthy again, the process responsible for the problem was no longer consuming the memory, and the relevant logs contained no obvious explanation. Normally, this would leave us with very little evidence. This time, however, I had historical process-level data.
The default Zabbix Windows template showed 100% memory usage for 10 minutes:
And by using my custom Zabbix template, I had the history that changed the investigation: MSOLAP increased from approximately 20 GB to 50 GB during that interval:
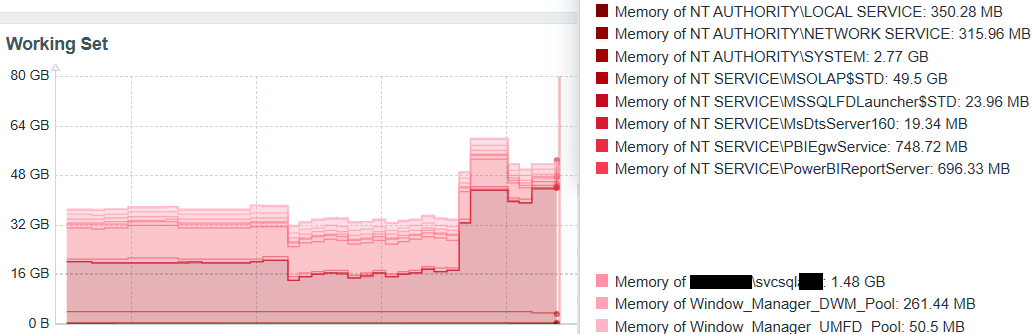
The exact reason Power BI Report Server remained unhealthy after Analysis Services released the memory was not captured by the available logs. What was clear was that the system had experienced severe memory pressure, and a server restart was required to fully recover. It could have been that active connections got hung or the memory pool got corrupted in SQL Server or Power BI Report Server, so even when Analysis Services was no longer using that amount of memory, the server had to be restarted.
With this data in hand, I then adjusted the SSAS memory configuration to prevent the process from consuming an uncontrolled share of the server's memory. The same can be done in Power BI Report Server or SQL Server if they have unrestricted memory limits.
The Scripts
I couldn't find a Zabbix template that provided the process-level grouping and historical view I needed. While some commercial monitoring solutions can provide process-level visibility, they often require additional agents, configuration, or resources. I had Zabbix already monitoring the server, but by default it doesn't collect the level of information I needed. So instead of adding another monitoring product, I extended Zabbix. Extending the Zabbix agent with my own ultra-lightweight scripts gave me the level of visibility I needed without any hassle.
In my GitHub repository you can find the following scripts:
- top_processes_template.yaml: this is the Zabbix template which polls the system every minute, creates items automatically per-process with their measures, and includes a dashboard you can visualize once you add the template to a server.
- top_processes.ps1: this is my ultra-lightweight script which returns information about every process in the system, including its memory usage, CPU usage, open handles, and number of threads and waiting threads.
- top_processes.sh: benefiting from this newly created template, I also created an ultra-lightweight script in bash (Linux) returning the same information but for Linux, used to monitor a legacy database system.
If you want to learn more about how they work and how they are installed, I recommend my previous articles:
- Monitoring SQL Server Using Zabbix
- Monitoring Distributed Availability Group Health with T-SQL and Zabbix
The template installation is described in the link above.
To install top_processes.ps1, in “C:\Program Files\Zabbix Agent 2\zabbix_agent2.conf” add the line “UserParameter=custom.processes,powershell -NoProfile -ExecutionPolicy Bypass -File "C:\Program Files\Zabbix Agent 2\Custom Queries\Windows\top_processes.ps1"”.
To install top_processes.sh, in “/etc/zabbix/zabbix_agent2.conf” add the line “UserParameter=custom.processes,/usr/local/bin/top_processes.sh”.
Windows
The script uses the PowerShell “Get-Process” cmdlet with a parameter to include the user name, because the same executable may be launched under different accounts, and the same application may also use multiple process names. Instead of grouping by executable, the results are grouped by user name. You can see in your task manager, in the “Details” tab, sorting by user name is how the information is going to be grouped together. The script avoids 'Get-CimInstance', 'Invoke-CimMethod', and 'Get-CimAssociatedInstance' because their overhead is too high for frequent polling, and if the results are not returned in about a second, the Zabbix server is not going to process them no matter what you do to increment the timeout in the client and in the server. To count the threads waiting, we exclude processes waiting for user input or for the scheduler.
About the results, the CPU is measured in seconds since the process started, that’s why in Zabbix we include in the preprocessing a “change per second” to subtract the previous value, and then a “multiplier” to convert it to percentage. For example: if the process CPU time increases from 120 to 125 seconds during a 60-second polling interval, the process consumed approximately 5 seconds of CPU during that interval. That corresponds to approximately 8 percent of one CPU over the interval. On a multi-core system, a process can legitimately exceed 100 percent when it uses more than one logical processor.
Linux
The script uses “ps” because it returns most of the information we’re interested in, specifically Resident Set Size (rss) equivalent to Working Set, Virtual Memory Size (vsz), and Number of Threads (nlwp). Because it doesn’t return the number of file descriptors (equivalent to Handles) we create a non-associative array at the beginning using fast parsing; the same for waiting threads (counting the ones in state S “normal sleep” and D “I/O sleep”) and also the same for CPU ticks since the process started.
The goal was not to make the Linux script identical to the Windows implementation internally. The goal was to expose the same metrics to the Zabbix template.
Once the data is gathered, the results are aggregated by process using “awk” because the relevant processes normally run under the same user. Common processes are grouped together when they start with the same letters, the memory value is converted to bytes by multiplying it for 1024, and the CPU is converted to seconds by dividing it by the clock ticks. Because there are so many results when grouping by program, we exclude the ones with 0 CPU or memory usage to reduce noise.
Zabbix Template
The template has a master item which retrieves the whole information from the Windows and Linux agents, so the user parameter is named the same, “custom.processes”. Then, a discovery rule creates the items using the LLD macro “{#PRG}” and the JSONPath “$.PRG”, and the item prototypes create the individual counters for CPU, Handles, Memory, Threads, Virtual Memory and Waiting Threads.
Finally, the dashboard displays the values as stacked graphs for items with similar names, allowing to view the whole information. Note the dashboard is not intended to replace Task Manager; its purpose is historical investigation. When an incident occurs, I can go back to the previous 15 or 30 minutes and see which process changed its memory consumption before the incident.
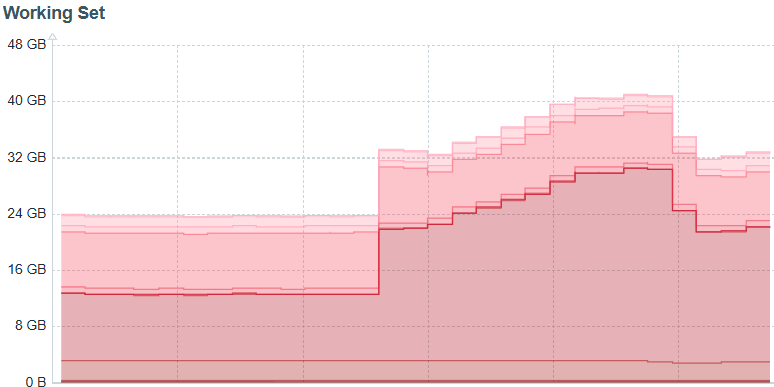
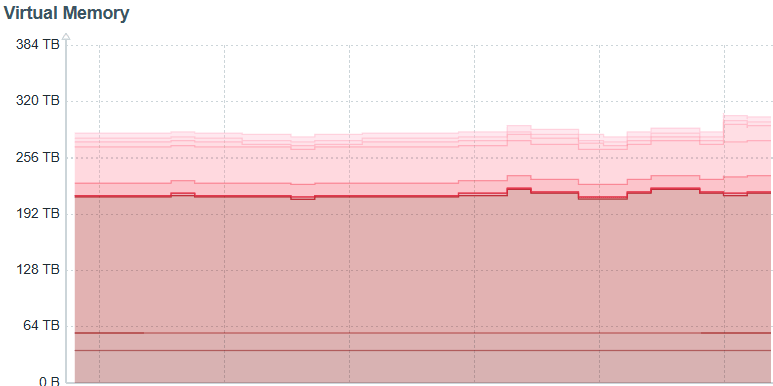
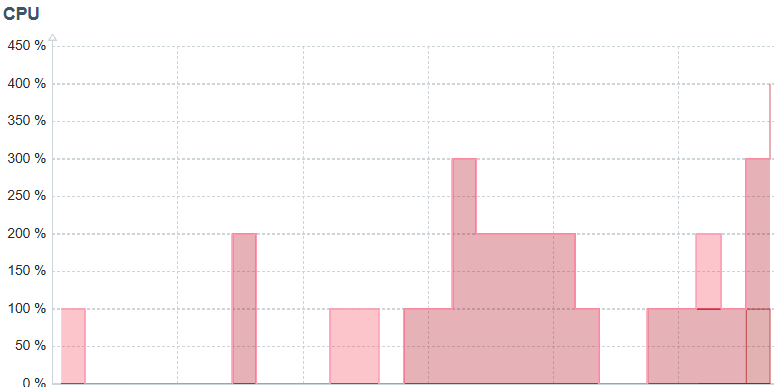
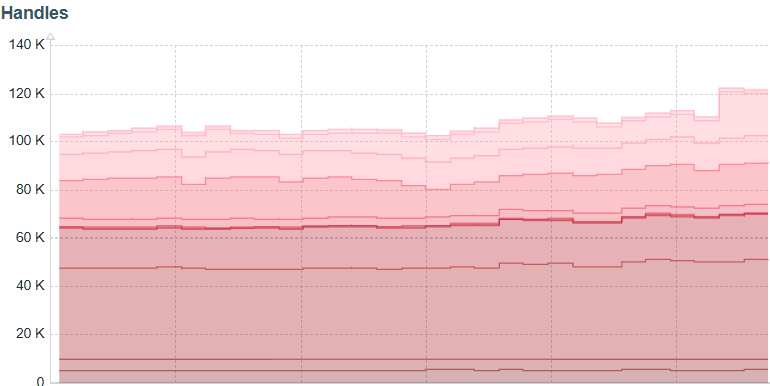
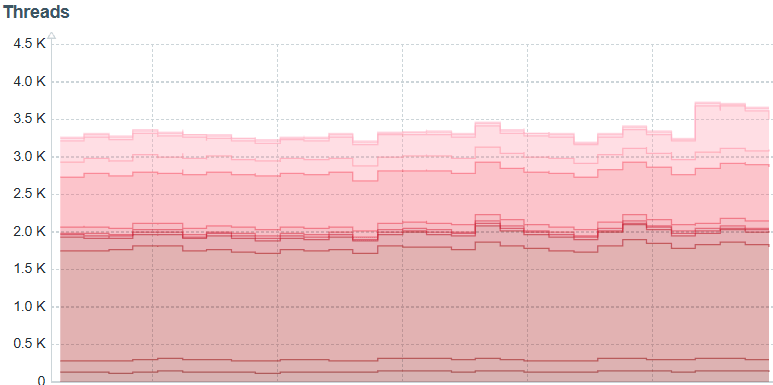
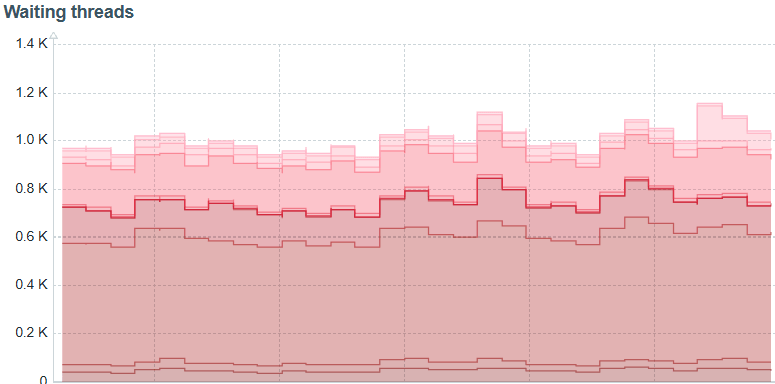
I recommend viewing small time intervals, 15 minutes or 30 minutes, around the time when you experienced issues, because the dashboard has to calculate and display a large number of process metrics, and larger time ranges can become expensive to render.
What this monitoring does not tell you
This monitoring is great for historical data without creating performance counter monitoring individually and including Linux systems, but:
- It doesn't prove that a process has a memory leak.
- It doesn't replace SQL Server memory diagnostics.
- It doesn't explain why an application allocated memory.
- It doesn't replace Windows Performance Monitor.
- It doesn't automatically determine the root cause.
It gives you the historical evidence needed to know where to dig deeper and troubleshoot.
Conclusion
Zabbix allows us to keep historical information about the systems, but by default has very basic information. Extending it to monitor individual processes, taking care to use lightweight data capturing scripts, accelerates the problem resolution process and allows making memory adjustments to specific SQL Server or Power BI components that are normally left under their default configuration. A reboot can restore a server, but it cannot explain why the server failed; historical process-level telemetry can.