

After creating a distributed availability group using the steps described in my article, SQL Server 2022 Clusterless Distributed Availability Group, how can we verify if the synchronization between data centers is healthy?
In SQL Server Management Studio, when you right-click a distributed availability group, you will notice that there is no dashboard to confirm whether SQL Server is properly synchronizing data across data centers:
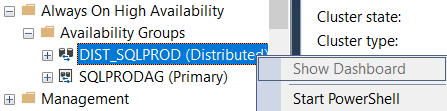
Even if you check the dashboards of the primary and secondary data centers separately, you will not see if there is a problem in-between.
To solve this, we can run a query on the primary node of the primary data center:
CREATE TABLE #Info (
  AG_Name SYSNAME, is_distributed BIT, is_chained BIT, replica_server_name VARCHAR(256), [Database] SYSNAME,
  role_desc VARCHAR(10), synchronization_health TINYINT, synchronization_health_desc VARCHAR(20), log_send_queue_size BIGINT, log_send_rate BIGINT,
  redo_queue_size BIGINT, redo_rate BIGINT, suspend_reason_desc VARCHAR(30), last_sent_time DATETIME, last_hardened_time DATETIME,
  last_redone_time DATETIME, last_commit_time DATETIME, secondary_lag_seconds BIGINT);
INSERT INTO #Info
SELECT ag.name AG_Name, ag.is_distributed, 0 'is_chained', ar.replica_server_name AS [AG], dbs.name AS [Database],
       ars.role_desc, drs.synchronization_health, drs.synchronization_health_desc, drs.log_send_queue_size, drs.log_send_rate,
       drs.redo_queue_size, drs.redo_rate, drs.suspend_reason_desc, drs.last_sent_time, drs.last_hardened_time,
       drs.last_redone_time, drs.last_commit_time, drs.secondary_lag_seconds
  FROM sys.databases dbs
 INNER JOIN sys.dm_hadr_database_replica_states drs ON dbs.database_id = drs.database_id
 INNER JOIN sys.availability_groups ag ON drs.group_id = ag.group_id
 INNER JOIN sys.dm_hadr_availability_replica_states ars ON ars.replica_id = drs.replica_id
 INNER JOIN sys.availability_replicas ar ON ar.replica_id = ars.replica_id
UNION ALL
SELECT ag.name AG_Name, 1 'is_distributed', 1 'is_chained', ar.replica_server_name AS [AG], dbs.name AS [Database],
       ars.role_desc, drs.synchronization_health, drs.synchronization_health_desc, drs.log_send_queue_size, drs.log_send_rate,
       drs.redo_queue_size, drs.redo_rate, drs.suspend_reason_desc, drs.last_sent_time, drs.last_hardened_time,
       drs.last_redone_time, drs.last_commit_time, drs.secondary_lag_seconds
  FROM [VSRVSQLON].master.sys.databases dbs
 INNER JOIN [VSRVSQLON].master.sys.dm_hadr_database_replica_states drs ON dbs.database_id = drs.database_id
 INNER JOIN [VSRVSQLON].master.sys.availability_groups ag ON drs.group_id = ag.group_id
 INNER JOIN [VSRVSQLON].master.sys.dm_hadr_availability_replica_states ars ON ars.replica_id = drs.replica_id
 INNER JOIN [VSRVSQLON].master.sys.availability_replicas ar ON ar.replica_id = ars.replica_id;
UPDATE i
   SET i.last_sent_time = i2.last_sent_time, i.secondary_lag_seconds = i2.secondary_lag_seconds, i.synchronization_health = i2.synchronization_health
  FROM #Info i
 INNER JOIN #Info i2 ON i2.[Database] = i.[Database] AND i2.is_distributed = 1 AND i2.is_chained = 0 AND i.is_distributed = 1 AND i.role_desc='PRIMARY';
DELETE
  FROM #Info
 WHERE is_distributed = 1 AND is_chained = 0;
ALTER TABLE #Info DROP COLUMN is_chained;
SELECT AG_Name, is_distributed, replica_server_name, [Database], role_desc,
       synchronization_health, synchronization_health_desc, log_send_queue_size, log_send_rate, redo_queue_size,
       redo_rate, suspend_reason_desc, last_sent_time, last_hardened_time, last_redone_time,
       last_commit_time, secondary_lag_seconds
  FROM #Info;
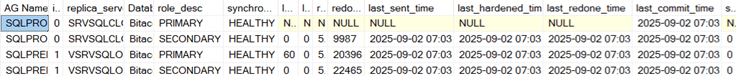
This script requires a linked server to the primary node of the secondary data center. This linked server needs the security to “Be made using the login’s current security context”. Notice how we copy the distributed AG information (returned by the primary data center) to the corresponding record (primary node of the secondary data center); this ensures we only return one row per server.
Here is an example of the output for one database:
As the number of databases grows, spotting synchronization issues manually becomes impossible; that’s why monitoring software like Zabbix is so valuable:
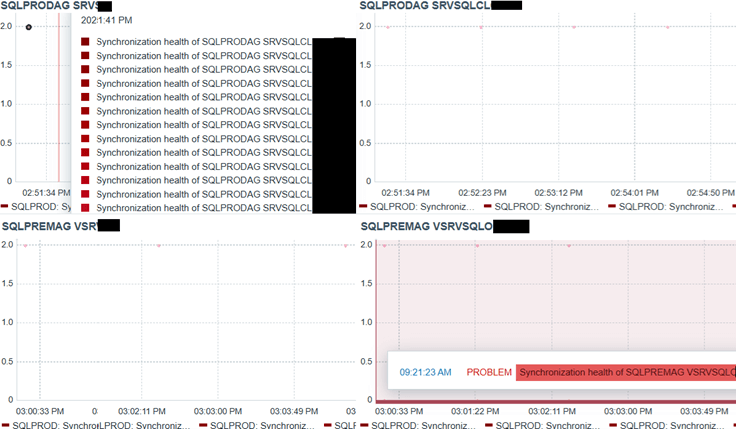
With it you can create a dashboard that shows the synchronization health of every database across all servers, and it can report immediately any disconnection. This also helps non-DBAs, and even non-technical people, to monitor things easily.
You can either download the prebuilt template from my GitHub repository and adjust it, or you can follow the detailed 10-step guide below to build your own.
Step 1: Create a folder for custom SQL queries
If you installed Zabbix under “C:\Program Files\Zabbix Agent 2\”, create the folder: C:\Program Files\Zabbix Agent 2\Custom Queries\MSSQL
Then add a file named “AGDistributed.sql” and paste the SQL command shown earlier.
Step 2: Configure the Zabbix MSSQL plugin
In “C:\Program Files\Zabbix Agent 2\zabbix_agent2.d\”, locate “mssql.conf” and add:
Plugins.MSSQL.CustomQueriesDir=C:\Program Files\Zabbix Agent 2\Custom Queries\MSSQL
Step 3: Restart the Zabbix agent and test
Restart the agent after making configuration changes and after modifying any SQL file:
net stop "Zabbix Agent 2"
First test connectivity to the database replacing the tags with their real values, unquoted (check in my previous article Monitor SQL Server using Zabbix, the part related to Macros):
& "C:\Program Files\Zabbix Agent 2\zabbix_agent2.exe" -t mssql.ping[{$MSSQL.URI}, {$MSSQL.USER}, {$MSSQL.PASSWORD}]Then assess the custom query (omitting the “.sql” extension):
& "C:\Program Files\Zabbix Agent 2\zabbix_agent2.exe" -t mssql.custom.query[{$MSSQL.URI}, {$MSSQL.USER}, {$MSSQL.PASSWORD}, AGDistributed]Finally, start the service:
net start "Zabbix Agent 2"
Step 4: Create a new template in Zabbix
In Zabbix, click Data Collection --> Templates. Click Create template (top-right corner):
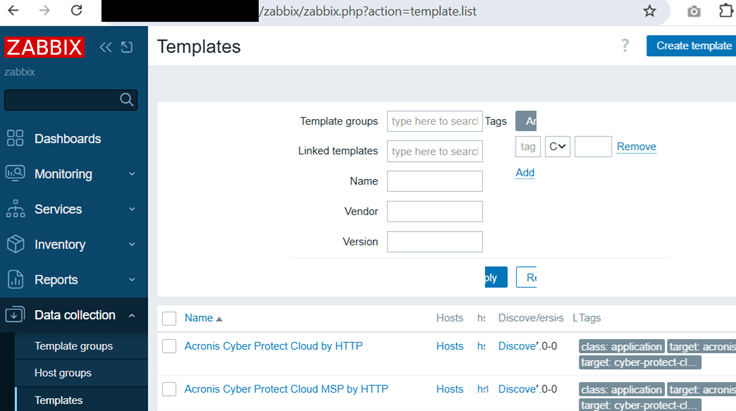
Enter the following details, then click Add to save:
- Template name: AG Distributed
- Template groups: Templates/Database
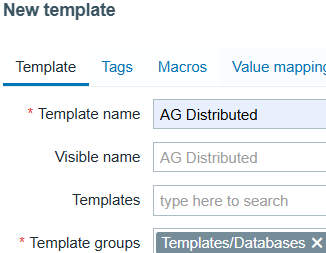
This template will hold all the items, rules, and dashboards.
Step 5: Add a template item
In the template list, locate AG Distributed, then click Items:
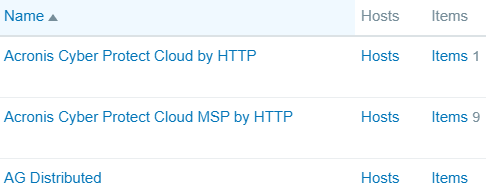
Click Create item (top-right corner) and fill in the details, then click Add:
- Name: AG Distributed
- Type: Zabbix agent (active)
- Key: mssql.custom.query[{$MSSQL.URI},{$MSSQL.USER},{$MSSQL.PASSWORD},AGDistributed]
- Type of information: Text
- Update interval: 1m (one minute, increase later if needed)
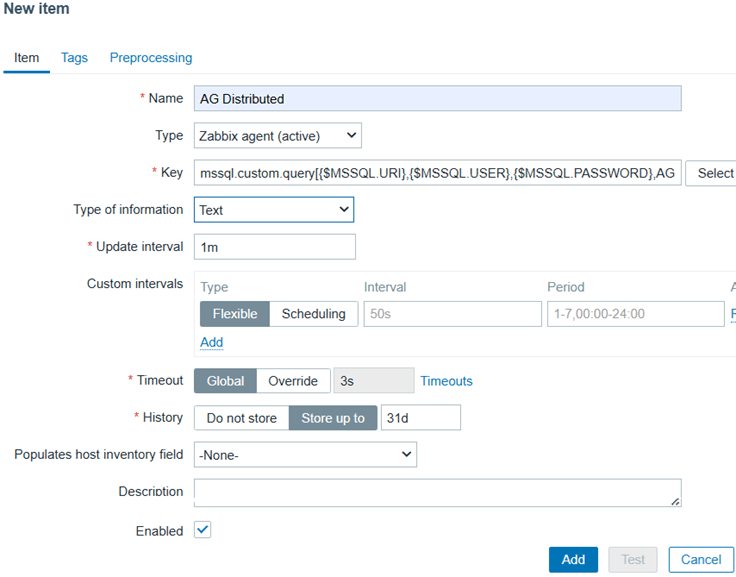
This item will capture the query results and make them available in JSON format.
Step 6: Associate the template with a host
Go to Monitoring --> Hosts, select the host where the SQL Server instance runs, under Configuration choose Host:
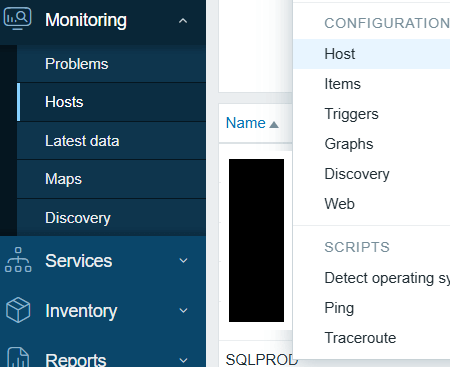
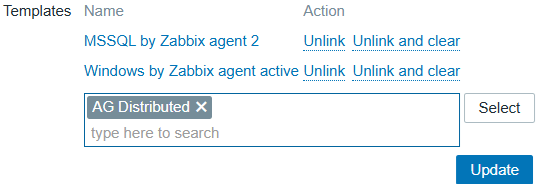
In the Templates, type “AG Distributed” or use the Select button to find it, then click Update:
Go to Monitoring --> Hosts, select the host where the SQL Server instance runs, under View, choose Latest data. In the Name field, search for “AG Distributed”. Hover over the Last value column; you should see the JSON output from the SQL script:
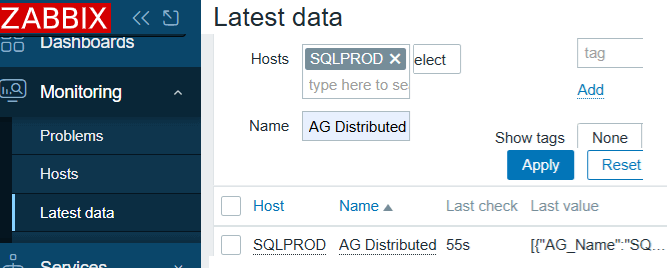
If you see an Info icon in the last column, there is a problem with the data collection.
Step 7: Add a discovery rule
Discovery rules let Zabbix automatically generate monitoring items for every availability group, SQL instance, and database.
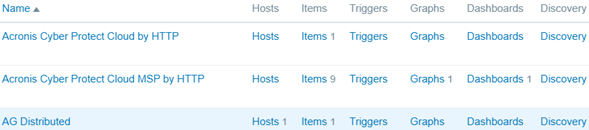
In the template list, locate AG Distributed, then click Discovery:
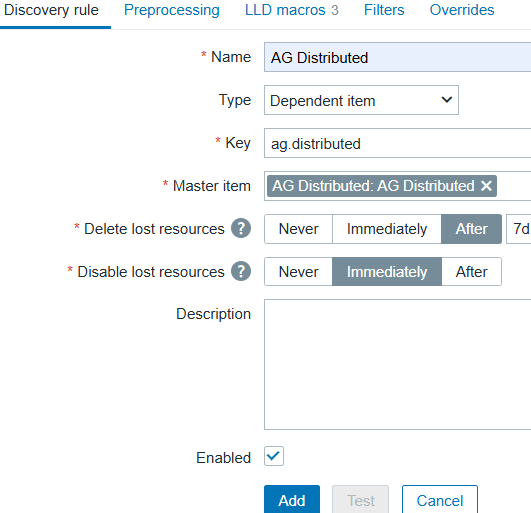
Click Create discovery rule and fill in the details:
- Name: AG Distributed
- Type: Dependent item
- Key: ag.distributed
- Master item: select “AG Distributed” (the item created in step 5)
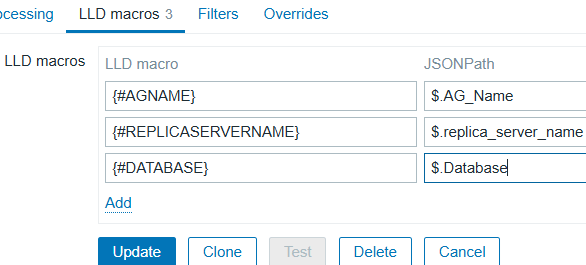
Switch to the LLD macros tab (LLD stands for Low Level Discovery). Add three macros that uniquely identify each record:
- {#AGNAME}: Availability group name
- {#REPLICASERVERNAME}: SQL Server instance name
- {#DATABASE}: Database name
Example: for a database named DB1 in two 2-node AGs (SQLPRODAG and SQLPREMAG), you will have:
- SQLPRODAG CLOUD1 DB1
- SQLPRODAG CLOUDDR2 DB1
- SQLPREMAG ONPREMISE1 DB1
- SQLPREMAG ONPREMISEDR2 DB1
LLD macros are keys created by Zabbix when the data comes. They must be uppercase, without spaces, underscores, or quotes. Choose any names that make sense to you – you will reference them in later objects.
The JSONPath is a query that returns a value; they must match exactly the name in the JSON (the names of the columns defined in our SQL query): they are case sensitive and do not allow spaces or quotes.
After saving, go to Monitoring --> Hosts, select the host where the SQL Server instance runs, and under Configuration choose Discovery. Confirm the new discovery rule, and any time you update this or to any underlying object, check the Info column for errors:
Step 8: Add an item prototype
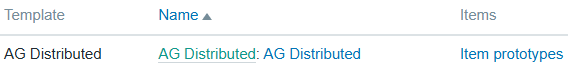
In the template list, locate AG Distributed, then click Discovery. On the discovery rule, click Item prototypes:
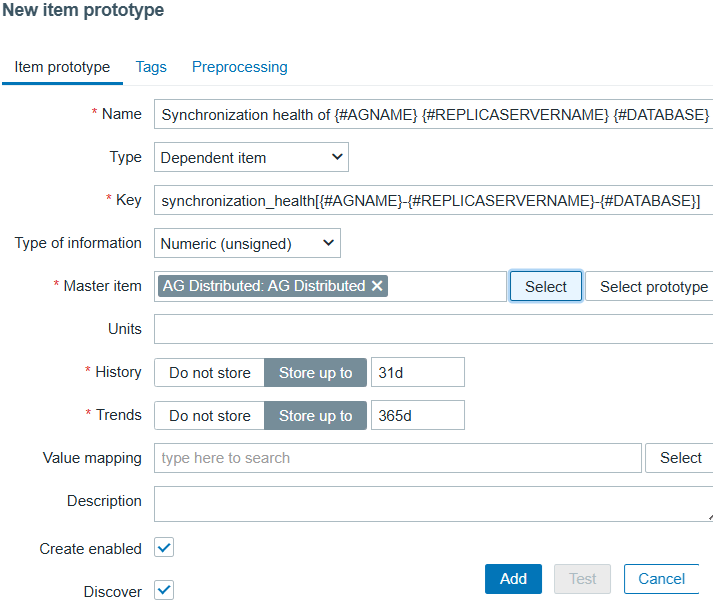
Click Create item prototype and enter the details:
- Name: Synchronization health of {#AGNAME} {#REPLICASERVERNAME} {#DATABASE}
- Type: Dependent item
- Key: avoid using commas, enter synchronization_health[{#AGNAME}-{#REPLICASERVERNAME}-{#DATABASE}]
- Type of information: Numeric (unsigned)
- Master item: select “AG Distributed”
Go to the Preprocessing tab, and Add a Preprocessing step:
- Name: JSONPath
- Parameters: $[?(@.AG_Name == "{#AGNAME}" && @.replica_server_name == "{#REPLICASERVERNAME}" && @.Database == "{#DATABASE}")].synchronization_health.first()
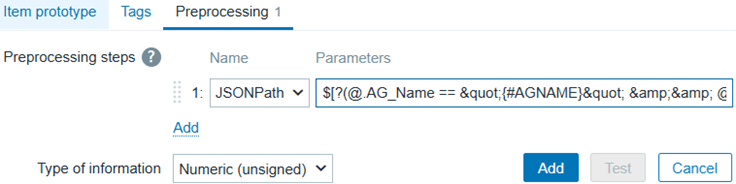
This preprocessing searches in the JSON the three keys defined earlier in the LLD macros, then gets the field synchronization_health, and dynamically creates items; for example: Synchronization health of SQLPRODAG CLOUD1 DB1.
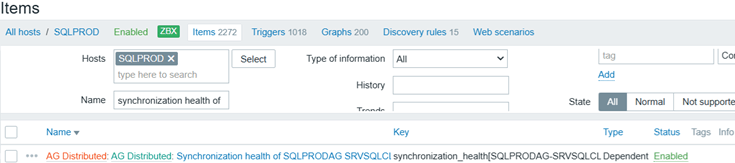
Search under Monitoring --> Hosts --> Items the name “synchronization health of”, and confirm no issues on Info on the discovered items:
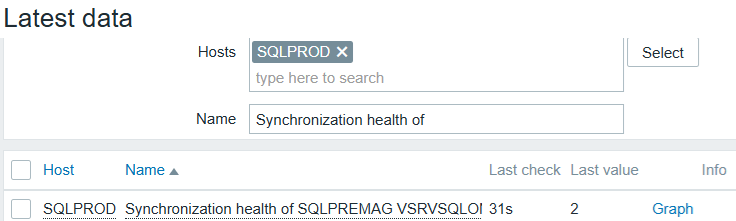
Go to Monitoring --> Hosts, select the host where the SQL Server instance runs, under View choose Latest data. Search the name “synchronization health of” to see the values received, and confirm no issues on Info:
Step 9: Add a trigger prototype
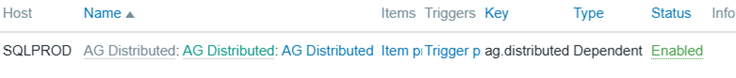
In the template list, locate AG Distributed, then click Discovery. On the discovery rule, click Trigger prototypes:
![]()
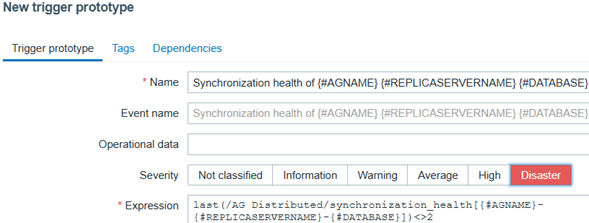
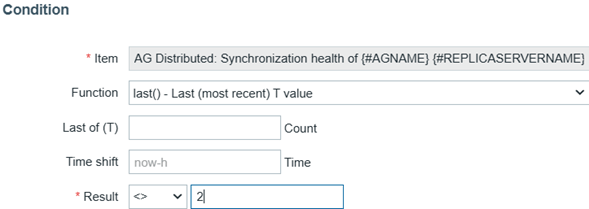
Click Create trigger prototype and enter the details:
- Name: Synchronization health of {#AGNAME} {#REPLICASERVERNAME} {#DATABASE}
- Severity: Disaster
- Expression: click Add and enter the details:
- Item: click Select prototype and select Synchronization health of {#AGNAME} {#REPLICASERVERNAME} {#DATABASE}
- Condition: <> (not equal)
- Value: 2 (healthy; see the official documentation)
Once added, you will see alerts under Current problems or in the host's problems:
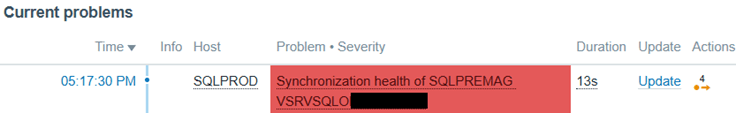
If you have email alerts configured for Disaster, you will also receive one.
Step 10: Create the dashboard
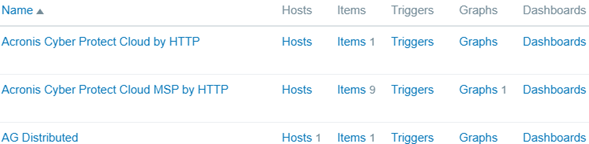
Finally, let us visualize everything. In the template list, locate AG Distributed, then click Dashboards:
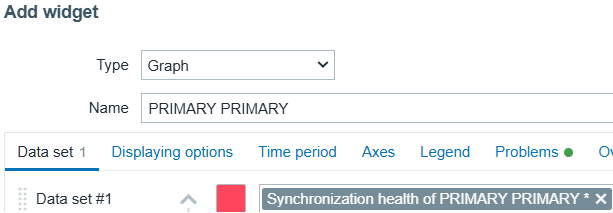
Click Create dashboard (top-right), enter a name (i.e., “AG Distributed”) and click Apply. On the canvas, add your first widget in the upper left corner:
- Type: Graph
- Name: enter the data center and server name, e.g., SQLPRODAG CLOUD1
- Data set #1 item patterns: enter Synchronization health of SQLPRODAG CLOUD1 * replacing the actual data center and server name; do not forget the asterisk
- Draw: points
- In the Problems tab, enable show problems
Add additional widgets as needed. Each widget displays up to fifty items, so create multiple depending on the number of availability groups, nodes, and databases. When done, click Save changes (top-right). You can now go to Monitoring --> Hosts, select the host where the SQL Server instance runs. Under View, choose Dashboards and select AG Distributed to view the synchronization health.
That completes the setup. With this dashboard, you will have a clear, near-real-time view of distributed availability group health. It makes detecting and resolving synchronization issues far easier, and it is simple enough for both DBAs and non-technical users to interpret.