

Zabbix is an open-source monitoring software, like Paessler PRTG, which can monitor SQL Server performance statistics and status. Although it doesn’t replace DBA functions, it is useful to provide evidence when things start to fail. Among its features are:
- Alert when the service fails or stops.
- Monitor Windows Performance Counters.
- CPU usage.
- Disk latency.
- Active connections.
- Blocking queue length.
- Transactions and resource usage.
- Dashboards for historical graphic visualization.
By default, there are multiple checks, but it’s totally augmentable so you can create your own monitoring at the OS or database level, integrate other tools’ monitoring into a dashboard as it keeps historical data, and tune thresholds and alerts.
Assuming you have already a Zabbix server installed and configured, and a SQL Server instance you want to monitor, here are the steps to monitor it.
Step 1: Install the agent and plugin in Windows
You need to download the latest agent and plugin; in my case they are “zabbix_agent2-7.0.3-windows-amd64-openssl.msi” and “zabbix_agent2_plugins-7.0.3-windows-amd64.msi”. When you run the installers, they’re very straightforward.
For the first installer, the agent, you need to agree to the installation and then agree to the GNU Affero General Public License.
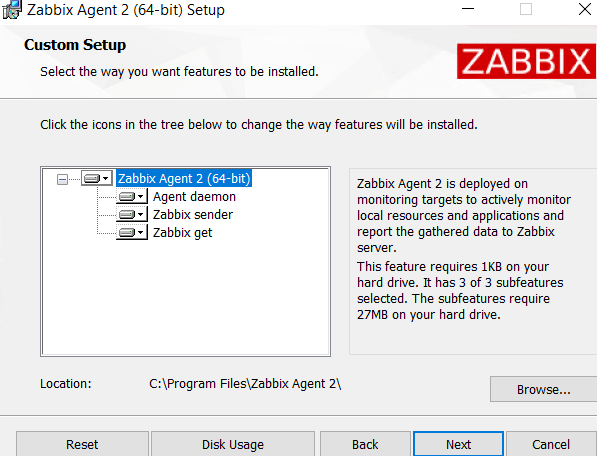
When prompted about what to install, leave it as it is:
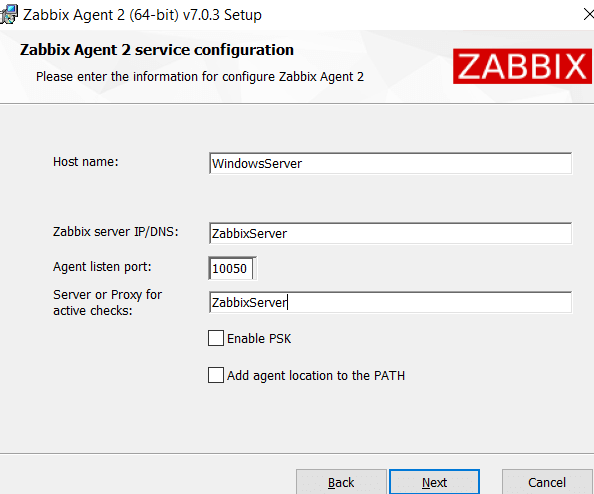
When prompted about the service configuration:
- Host name: The name to use when adding the host to the console.
- Zabbix server IP/DNS: The IP/DNS of the Zabbix server.
- Agent listen port: Leave the default or you can change it.
- Server or Proxy for active checks: Enter the same IP/DNS of the Zabbix server.
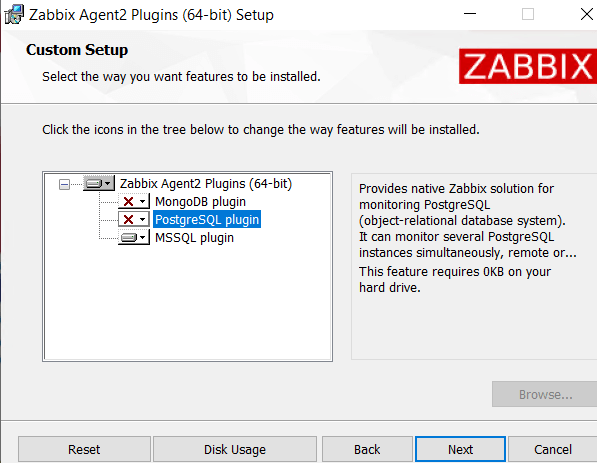
For the second installer, the plugins, only install the one for MSSQL:
Step 2: Create the Zabbix database user
The user needs to view the server state and view any definition, also needs to monitor the msdb sysjobs. Here is the script with the minimum permissions required, just enter a strong password:
USE master;
CREATE LOGIN zabbix WITH PASSWORD = '<StrongPassword>';
GRANT VIEW SERVER STATE TO zabbix;
GRANT VIEW ANY DEFINITION TO zabbix;
USE msdb;
CREATE USER zabbix FOR LOGIN zabbix;
GRANT EXECUTE ON msdb.dbo.agent_datetime TO zabbix;
GRANT SELECT ON msdb.dbo.sysjobactivity TO zabbix;
GRANT SELECT ON msdb.dbo.sysjobservers TO zabbix;
GRANT SELECT ON msdb.dbo.sysjobschedules TO zabbix;
GRANT SELECT ON msdb.dbo.sysjobhistory TO zabbix;
GRANT SELECT ON msdb.dbo.sysjobs TO zabbix;
GRANT SELECT ON msdb.dbo.backupset TO zabbix;
GRANT SELECT ON msdb.dbo.backupmediafamily TO zabbix;
Step 3: Add the host to the Zabbix server
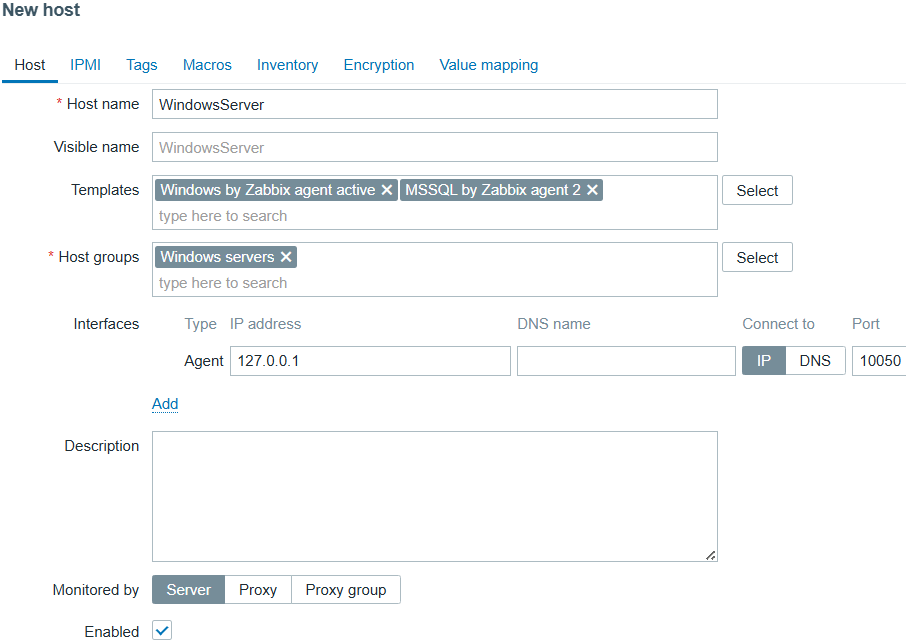
Go to “Monitoring”, then “Hosts”, and in the upper right corner click on “Create host”. The information you need to provide is:
- Host name: The same used when installing the agent.
- Visible name: If you want to use a more friendly name in the dashboards.
- Templates: Type “Windows by Zabbix agent active” and select it, then type “MSSQL by Zabbix agent 2” and select it.
- Interfaces: Click on “Add” and enter the server IP address or DNS name, and port (if not the default).
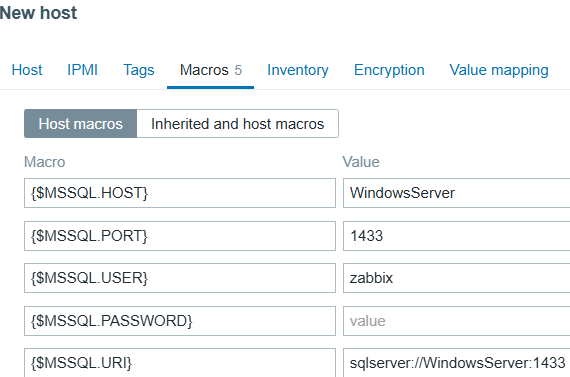
Then, go to “Macros” and enter the following:
- {$MSSQL.HOST}: The IP/DNS of the server to monitor.
- {$MSSQL.PORT}: The SQL Server port.
- {$MSSQL.USER}: The database user created earlier.
- {$MSSQL.PASSWORD}: The password of the user created earlier.
- {$MSSQL.URI}: Enter the server IP/DNS and the port number.
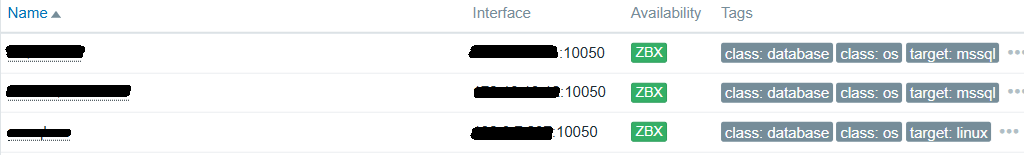
Finally, click on “Add” in the bottom right corner, and wait for the server to appear green in the “Hosts”:
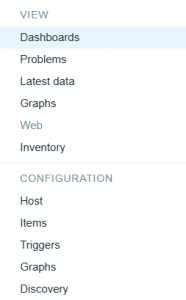
Now, you can left click on the host name and go to “Dashboards”:
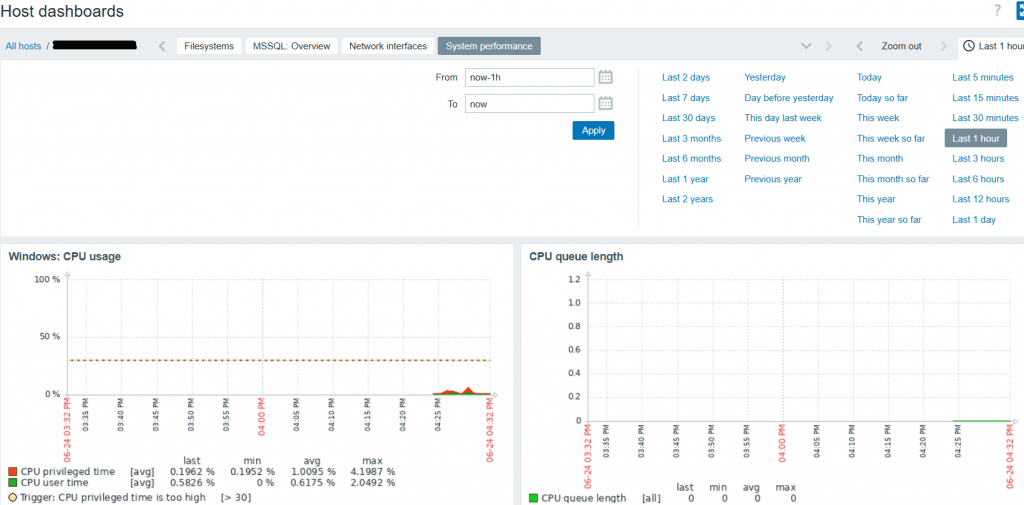
There you can see information about Windows system performance:
And information about SQL Server:
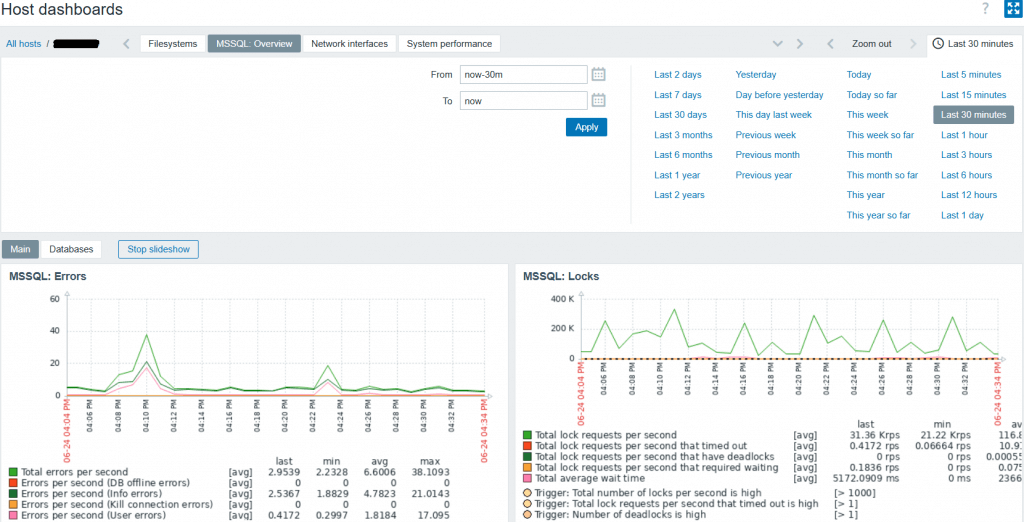
By default, for SQL Server you have the following dashboards:
- Errors
- Locks
- Server memory
- Memory/cache load
- Waits per second
- Wait times
- Database pages
- Cache objects
- Transactions
- Compilations
- Pages
- Page life expectancy
- Memory grants outstanding and pending
- Processes blocked
- Access methods
- Auto-params
- Logins per second and Logouts per second
- For each database, the data and log growth over time
Additional information regarding MSSQL monitoring can be found in this link.
