

It is customary for a DBA to build a new SQL Server instance and leave a practical amount of memory for the Windows OS to use. The amount of memory spared to the OS is typically based on the amount of memory installed on the host machine; I personally usually use the guidelines provided by Slava Oks's MSDN blog.
While these guidelines work very well most of the time, I recently encountered a situation where the customary method can fall down due to the way SQL Server allocates memory for large objects and where those objects are stored. To further expand on that topic, it is important to understand the basics of SQL Server memory management and where the various memory clerks choose to allocate memory. It boils down to large object allocation vs. small object allocation, which may come as a surprise to some. Allow me to explain.
Understanding the SQL Buffer Pool
The first and most obvious memory area in SQL Server is the buffer pool. This is the memory you are configuring with the "max server memory" setting. The buffer pool is also called the "single page allocator" and contains primarily the data and procedure caches, but it also stores other things. The main thing to understand about memory allocation to the buffer pool is that there is a strict size limit of 8kb: the size of a data page. Objects that are 8kb or less are stored in the buffer pool and absolutely nothing larger than 8k can be stored in the buffer pool.
The 8k limit on the buffer pool doesn't mean that a table or index can't be allocated into the buffer pool. SQL Server requests tables and indexes as a range of 8kb pages and writes them into the buffer pool in that fashion. The storage engine is accustomed to handling 8kb pages, so it is only natural that a memory page in the buffer pool be the same size to utilize built-in efficiencies.
The things that are typically stored in the buffer pool are:
- cached data*
- cached execution plans*
- algebrizer trees for views, constraints and defaults
- lock memory
- Anything with a non-zero value in sys.dm_os_memory_clerks.single_pages_kb
*These could also live in the multipage allocator which we will read about now.
Understanding the Multipage Allocator
The other main memory area in SQL Server is called the multipage allocator (MPA). I first encountered the MPA in SQL 2000 when it was known as "memtoleave", which I didn't fully understand at the time. I mainly recall memtoleave because of common issues with restarting SQL 2000 instances because the memtoleave area had filled up, causing performance issues. I also clearly remember that memtoleave was allocated only when SQL Server started up (thus the need to restart). That behavior has changed with SQL 2005, but the memory area still exists and is used extensively by SQL Server under the new name and new dynamic memory management practices.
The Multipage allocator stores objects requested by any SQL Server component that are larger than one 8k page. This means any memory request made by any of the SQL Server components that is larger than one 8k page.
That leaves out a lot of specific details, but some objects that are frequently larger than 8k are:
- cached execution plans (say what!?)
- CLR hosting & runtime
- SQL OS Worker Threads
- Cached Permissions
- Thread Schedulers & Memory Clerks
- Anything with a non-zero value in sys.dm_os_memory_clerks.multi_pages_kb ... even the buffer pool memory clerk will place objects in the MPA.
Unlike the buffer pool, the MPA does not live inside the memory allocated to the SQL instance in the "max server memory" setting... The MPA lives in the Windows system cache and is accessed by SQL Server just like any other application would access that memory cache.
Usually the MPA has a small footprint in the system cache, but under certain conditions, SQL Server can use a lot of Windows system cache.
The Windows System Cache
I like to think of the Windows system cache as the "buffer pool" for the OS. Like the buffer pool, the system cache acts as an object cache by storing libraries, keys, files, drivers, handles, etc. that the OS needs. Unlike the buffer pool, it does not care about the size of an object that is cached. Beyond its role as the OS object cache, the system cache handles memory caching for applications such as SQL Server including the placement/replacement policies and cache size. This behavior appears to be unchanged since Windows 2003.
When a SQL Instance's MPA begins to take up too much of the system cache, the OS will suffer because it will have to go to back to disk and refetch things that are being squeezed from the cache. If that happens, the OS can start foraging memory from SQL Server buffer pools, even with "lock pages in memory" set! This can create a downward spiral that ends in degraded performance or out-of-memory errors.
Practical Memory Troubleshooting
A bloated MPA is most likely going to be caused by 2 things: CLR and cached execution plans. It will probably happen on a busy system but there are no guarantees. I have recently seen a 2 GB MPA on an TEST instance with 6GB of max server memory. The situation I encountered was due to cached execution plans, which I figured out by using the DMV's and DBCC Memorystatus. More on that later.
If you believe your SQL Server's MPA could be causing memory issues on a host, the fastest way to tell is to fire up Process Explorer brought to us by our good friends Mark Russinovich and Bryce Cogswell. Process Monitor does a good job of displaying memory information in a strait-forward and consumable way (unlike Windows Task Manager).
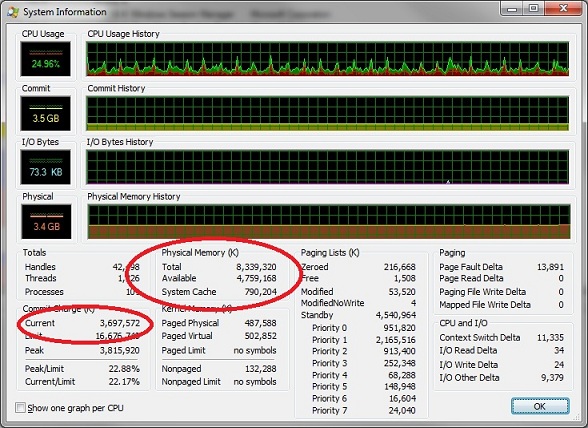
Open Process Explorer and select view - system information to see the OS memory details.
The Total counter circled above shows you the amount of physical memory available to the host.
The Available counter will show how many KB are available to the host;400 MB is probably as low as you would want to see it. The image above shows ~4.7 GB in the Available counter
The System Cache counter will show how large your Windows system cache has grown. Compare the System Cache counter with the amount of memory you've intentionally left to the operating system. If you're using more System Cache than what you've left the OS, you're either paging to disk, or having the OS steal memory from your SQL Server(s).
The Current counter is the amount of virtual address space in use (that's physical memory + pagefile). When the Current counter is larger than your Total counter it indicates that you are paging to disk, which is a very bad thing for a SQL Server.
If you do discover the system cache size is causing serious issues, it might need to be trimmed down by using another Russinovich tool called cacheset. Cacheset could save you a reboot someday, I highly recommend learning to use it to clear your cache and to set runtime limits on the cache's working set. You can also write a startup script to set hard limits on the system cache if you find yourself with no other options.
It is debatable whether or not setting hard limits on a system cache is a worthwhile endeavor. It can be an easy fix, but the most appropriate fix would be to find what is overrunning the cache and correct it. I would only recommend setting memory limits to stop the bleeding, so to speak.
Use the DMVs
Some of the SQL DMVs and built-in DBCC commands can start pointing you in the right direction for determining if SQL Server itself is responsible and which memory clerk is to blame.
This SQL 2008+ query will tell you how large the system cache is. It's no replacement for Process Monitor, but it will do in a pinch.
select system_cache_kb/1024 as systemCacheMB from sys.dm_os_sys_memory
This query will tell you the total size of your MPA in megabytes.
select sum(multi_pages_kb)/1024.0 as multipage_mb
from sys.dm_os_memory_clerks
You might benefit from gathering baselines to see roughly how much MPA your instance uses on a typical day.
This query will show you which memory clerk is using the most MPA
select type, sum(multi_pages_kb)/1024.0 as MPA_MB
from sys.dm_os_memory_clerks
group by type
order by 2 desc
If you find a particular memory clerk is out-of-control, you can free up that memory running the dbcc freesystemcache for your particular memory clerk. The commands for freeing a specific cache store are undocumented, but they coincide with the cache name in the sys.dm_os_memory_clerks table. Use the below query to identify the correct command to run for the memory clerk that is misbehaving.
SELECT DISTINCT 'dbcc freesystemcache('''+ name + ''')' AS DBCC_Command
 ,TYPE
FROM sys.dm_os_memory_clerks
WHERE TYPE LIKE 'objectstore%' OR TYPE LIKE 'cachestore%' or type like 'userstore%'
order by 2
These commands are not to be taken lightly, especially on production systems as they can cause a brief, but precipitous drop in performance because the server will need re-cache the objects you just purged from source. I would use these in an emergency situation only and work to determine root cause later.
This last query will help you identify cached execution plans taking up space in your MPA and how much memory they are consuming. Modify it to your heart's content
; WITH MPAPlans AS (
SELECT plan_handle, SUM(size_in_bytes)/1024/8 AS numPages
FROM sys.dm_exec_cached_plans
GROUP BY plan_handle )

SELECT ISNULL(DB_NAME(dbid), 'resourcedb'), objectid, numpages/128.0 AS size_in_mb, size_in_bytes, text
FROM sys.dm_exec_cached_plans cp
 INNER JOIN MPAPlans mpa ON cp.plan_handle = mpa.plan_handle
 INNER JOIN (SELECT DISTINCT sql_handle, plan_handle FROM sys.dm_exec_query_stats) qs ON mpa.plan_handle = qs.plan_handle

-- cross APPLY sys.dm_exec_query_plan(mpa.plan_handle) -- you could get the plan here if you wanted.
 CROSS APPLY sys.dm_exec_sql_text(qs.sql_handle)
ORDER BY numPages DESC
Conclusion
While this article doesn't break a lot of new ground, it does shed some light onto the inner workings of SQL Server memory management and provides some insight into why it is important to leave the OS a fair share of memory. My hope is that somewhere, a DBA will read this article become able to fix a system instability issue that has been plaguing them.
Thanks for reading!
Resources
I'd like to thank the authors of these online documents, which provided me with the background information for the bulk of this article.
Oks, S. (5/11/2005) SQLOS's memory manager and SQL Server's Buffer Pool. retrieved from http://blogs.msdn.com/b/slavao/archive/2005/02/11/371063.aspx
Oks, S. (11/13/2006) Q & A: Does SQL Server always respond to memory pressure?
retrieved from http://blogs.msdn.com/b/slavao/archive/2006/11/13/q-a-does-sql-server-always-respond-to-memory-pressure.aspx.
Geyzerskiy, D. DAT322: SQL Server 2005 Memory Internals. [PowerPoint slides]. retrieved from http://download.microsoft.com/download/7/a/b/7ab8283e-a3a0-4185-818b-ab7b1fc6300b/DAT423SQL%20Server%202005%20Memory%20Internals.ppt
Microsoft Support. (11/20/2007) How to use the DBCC MEMORYSTATUS command to monitor memory usage on SQL Server 2005
retrieved from http://support.microsoft.com/kb/907877
Graziano, B. (7/25/2007)What Query Plans are in SQL Server's Memory?
retrieved from http://www.sqlteam.com/article/what-query-plans-are-in-sql-server-memory
Patuel, S. (10/13/2007) Design: Memory working set explored
retrieved from http://blogs.msdn.com/b/salvapatuel/archive/2007/10/13/memory-working-set-explored.aspx

