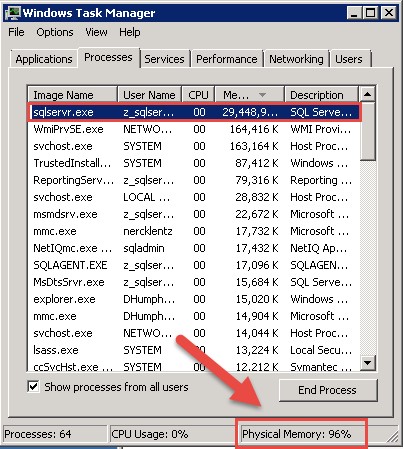
Recently, a client of mine contacted me in a panic because almost all of the memory on the SQL Server host was used up…according to Task Manager, that is.
Don’t panic...Task Manager is probably not telling you the entire truth. If you are looking at Task Manager to get accurate values for memory (RAM) usage or CPU time, you will get not-so-accurate information. False alarms. Information that doesn’t exactly mean what it implies.

After speaking with my very worried client, I checked around on the servers and looked at many performance indicators. What I usually see is that CPU is low, disk usage is low, and memory used is high, which is what we expect on a SQL Server machine. SQL Server will use as much memory as it can get, to improve performance by caching as much data as it can into memory in case it needs it, to avoid having to go to disk. SQL Server will immediately release any memory to the OS if needed.
SQL Server is a memory hog, and will hold onto all the memory we allocate to it, whether it is actually using it or not. And this is what we want it to do. SQL Server will take all the memory that is allocated to it when it is needed, store data and execution plans in the buffer, and when it is through using it, it doesn’t release it…it caches that data into memory until either 1) SQL needs it again, or 2) the Windows OS requests the memory.
This isn’t an indication of performance stress. This is just showing that SQL Server has reserved all the memory that we told it to use (through setting min and max memory on the SQL instance properties). SQL Server doesn’t let go of memory unless the server comes under memory pressure (when other apps need memory and Windows sends out a memory pressure notification). As long as the OS doesn’t need to use it for anything, SQL Server will hold on to the memory for future use.
The default memory setting when you install SQL is for it to use all of the memory. When Windows asks SQL to give it back, SQL gives it back in huge amounts. And then proceeds to build back up again to maximum amount. This is not optimum for stability or performance, and it is highly recommended to set the limit in the Max Memory Setting as a best practice. That way Windows OS is always guaranteed to have a certain amount.

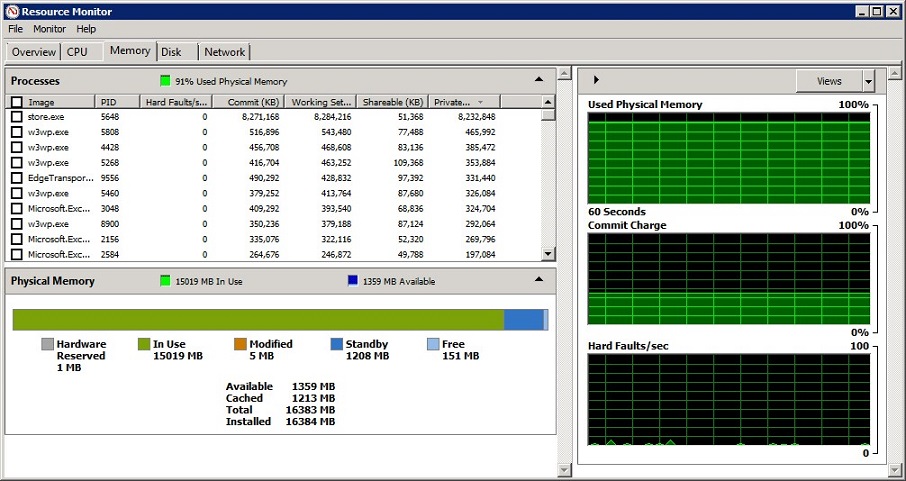
When looking at Resource Monitor, it is a mistake to use the Available and Free metrics as the key indicators for determining overall system health. The Available MB of memory is comprised of both the Standby and the Free. The stuff in Standby is what Windows has put in the cache (but can be booted out if needed), and Free means it is not being used at all. The combination is what Windows calls Available.
So there is actually data in the cache that Windows says is available. Some of the categories in Task Manager/Resource Monitor can be very confusing and even misleading, which is why we shouldn’t use these metrics alone to decide if we are in danger of being out of memory.
Instead of only relying on Task Manager or Resource Monitor, we really need to look at other metrics to find out if there is a memory related performance issue on the machine. Some of the metrics to pay attention to are:
- Page Life Expectancy
- Available Bytes
- Buffer Cache Hit Ratio
- Target & Total Server Memory
- Memory Grants Pending
- Pages/sec (Hard Page Faults)
- Batch Requests/sec & Compilations/sec
Some of these metrics can be queried from T-SQL, or can be observed with Perfmon (Windows Performance Monitor – located in Administrative Tools).
Page Life Expectancy (PLE)
Found in Perfmon at SQL Server: Buffer Manager - Page Life Expectancy, this counter measures the average amount of time unlocked data pages are staying in the buffer pool. During peak production hours this number may dip into lower numbers, but we generally want this number to remain above 300 seconds (so data is staying in the cache for 5 minutes or longer). The longer data stays in the buffer, the less likely SQL will have to go to disk for I/O operations.
There is an interesting occurrence with page life expectancy. When SQL Server really does run out of memory, PLE drops very quickly, but it grows back very slowly. You’re probably not still having memory issues during the coming back stage, even though it may look like its struggling. If PLE stays down however, then you have a problem. So be careful, because PLE can be misleading when it takes a drop; there’s a difference between it going down and staying down (you have a memory problem), and going down once and crawling back up (which is normal). If it stays down below 300 seconds consistently, you may need to add more RAM.
You can monitor this through Perfmon, or run the following query:
SELECT [cntr_value]
 FROM sys.dm_os_performance_counters
 WHERE [object_name] LIKE '%Buffer Manager%'
 AND [counter_name] = 'Page life expectancy'
Available MBytes
Found in Perfmon as Memory: Available MBytes, this counter detects how much memory is available for use, and whether Windows is experiencing memory pressure. We generally start investigating if this number consistently goes below 500MB, which would indicate low memory, and Windows may start memory management operations. If Available Mbytes is consistently low, you may need to add more RAM.
This counter cannot be queried through T-SQL; it has to be observed through Perfmon only.
Buffer Cache Hit Ratio
Found in Perfmon as SQL Server: Buffer Manager: Buffer Cache Hit Ratio. This counter averages (since the last restart of your SQL instance) how often SQL Server goes to the buffer pool to get data, and actually finds that data in memory, instead of having to go to disk. We want to see this ratio high in OLTP servers – around 90-95%. The higher the ratio, the less often SQL has to go to disk for I/O operations, which translates into better performance for your end users. If this number is consistently below the 90% mark, you may need to add more RAM to your server to boost performance.
SELECT [cntr_value]
 FROM sys.dm_os_performance_counters
 WHERE [object_name] LIKE '%Buffer Manager%'
 AND [counter_name] = ‘Buffer cache hit ratio’
Target & Total Server Memory
Found in Perfmon at SQL Server: Memory Manager – Total Server Memory, and SQL Server: Memory Manager – Target Server Memory. The Total Server Memory is the current amount of memory that SQL Server is using. The Total Server memory will be quite a bit lower than the Target memory during the initial buffer pool ramp up. During this time SQL Server is trying to populate the cache and get pages loaded into memory. Performance might be a little slower during this time since more disk I/O is required, but this is normal. After the instance ramps up, and normal operations resume, Total Server Memory should be very close to Target Server Memory. (The ratio should be close to 1). If Total Server Memory does not increase much, but stays significantly less than Target, this could indicate a couple of things…
1) You may have allocated much more memory than SQL can use – SQL could cache the entire databases into memory, and if the databases are smaller than the amount of memory on the machine, the data won’t take up all the space allocated. In this case Total Memory (actually memory being used by SQL) will never reach Target Memory (amount allocated to SQL). Or,
2) SQL cannot grow the buffer pool because of memory pressure from outside of SQL. If this is the case, you need to either increase the Max Server Memory, or add more RAM to boost performance.
SELECT [cntr_value]
 FROM sys.dm_os_performance_counters
 WHERE [object_name] LIKE '%Memory Manager%'
 AND [counter_name] IN (‘Total Server Memory (KB)’,’Target Server Memory (KB)’
Memory Grants Pending
Found in Perfmon as SQL Server: Memory Manager – Memory Grant Pending, this counter measures the total number of SQL processes waiting for a workspace memory grant. The general recommendation for this measurement should be 1 or less. Anything above 1 indicates there are SQL processes waiting for memory in order to operate.
Memory grants pending could be due to bad queries, missing indexes, sorts or hashes. To investigate this, you can query the sys.dm_exec_query_memory_grants view, which will show which queries (if any) that require a memory grant to execute.
If the Memory Grants Pending are not due to the above mentioned conditions, then more memory should be allocated to SQL Server by adjusting Max Server Memory. Adding more RAM should be the last resort in this case.
SELECT [cntr_value]
 FROM sys.dm_os_performance_counters
 WHERE [object_name] LIKE '%Memory Manager%'
 AND [counter_name] = ‘Memory Grants Pending’
Pages/sec (Hard Page Faults)
Found in Perfmon as Memory: Pages/sec, this measures the number of pages read from or written to disk. Pages/sec is the sum of Pages Input/sec and Pages Output/sec and reports the number of requested pages that were not immediately available in RAM and had to be read from the disk (resulting in hard page faults). A Hard Page Fault occurs when windows has to use the swap file on the disk. It’s when the address in memory that’s part of a program is no longer in main memory, but has been instead swapped out to the paging file, making the system go looking for it on the hard disk. Since disk storage is much slower than RAM, performance can be greatly degraded.
We want to see the Page/sec number below 50, and closer to 0. If you see a high value of Pages/sec on a regular basis, you might have performance degradation, but not necessarily. A high Pages/sec value can happen while doing database backups or restores, importing or exporting data, or by reading a file mapped in memory.
Because a hard fault doesn't necessarily indicate a critical error condition depending upon what’s normal for your environment, it’s a good idea to measure a baseline value, and monitor this number based on that. If the values are consistently higher that your baseline value, you should consider adding more RAM.
Batch Request & Compilations
There are two counters to examine here.
- SQL Server: SQL Statistics – Batch Request/Sec. This is the number of incoming queries
- SQL Server: SQL Statistics - Compilations/Sec. This is the number of new executions plans SQL had to build
If Compilations/sec is 25% or higher relative to Batch Requests/sec, SQL Server is putting execution plans in the cache, but never actually reusing them. Your valuable memory is being used up to cache query execution plans that will never be used again – instead of caching data. This is bad. We don’t want this to happen.
A high Compilation/sec value (like over 100) indicates there are a lot of Ad-Hoc (one-hit-wonder) queries being run. You can enable the “optimize for ad hoc” setting if this is the case, and this will put the execution plan in the buffer, but only after the second time it has been used.
To query these metrics with TSQL:
SELECT [cntr_value]
 FROM sys.dm_os_performance_counters
 WHERE [object_name] LIKE '%SQL Statistics%'
 AND [counter_name] = 'Batch Requests/sec';

SELECT [cntr_value]
 FROM sys.dm_os_performance_counters
 WHERE [object_name] LIKE '%SQL Statistics%'
 AND [counter_name] = 'SQL Compilations/sec';
To get the ratio of Compilations to Batch Requests:
SELECT ROUND (100.0 *
 (SELECT [cntr_value]
 FROM sys.dm_os_performance_counters
 WHERE [object_name] LIKE '%SQL Statistics%'
 AND [counter_name] = 'SQL Compilations/sec')
 /
 (SELECT [cntr_value]
 FROM sys.dm_os_performance_counters
 WHERE [object_name] LIKE '%SQL Statistics%'
 AND [counter_name] = 'Batch Requests/sec')
 ,2) as [Ratio]
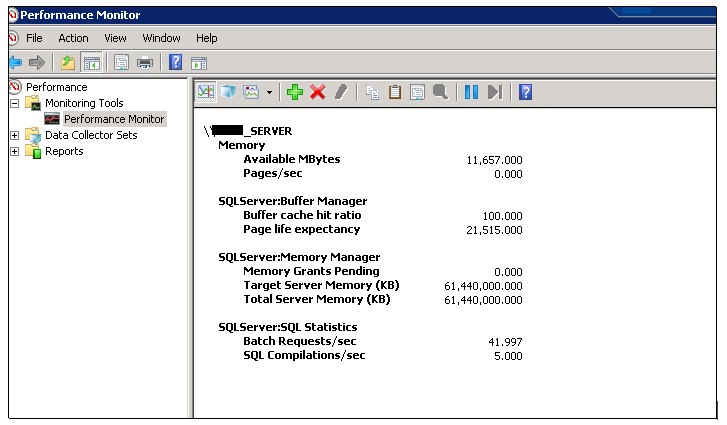
Looking at the counters in Perfmon (Report View) below, we can see that this particular server is in a healthy state, with over 11GB of Available Bytes, no page faults (so I/O is operating from buffer, not disk), Buffer cache with 100% ratio, PLE of 21,515 seconds (that’s almost 6 hours data spent in the buffer), no pending memory grants (so no SQL process is having to wait for memory), ample Total memory, and low compilation ratio (11%) compared to all the queries being run.

These measurements should be observed and understood, instead of using Task Manager to make critical decisions about resources on your SQL Server.
If it is decided to make changes based upon only what we see in Task Manager, and we reduce the amount of memory SQL can use, and it happens to need more to execute processes, it will have to read/write from disk, which will degrade the performance. Reducing the amount of memory SQL can use will slow performance and will most likely increase complaints from end users. The lower you set your Maximum Server Memory, the lower your performance will go.
No matter how much memory you put in a system, SQL Server will use all it can get until its caching entire databases in memory and then some. This isn’t an accident. SQL Server caches data in memory on purpose. That means it is healthy, and enhancing performance for your end users.


