When it comes to monitoring SQL Server there are a lot of metrics available to us - hundreds! In practice while we monitor quite a few, we rely on a handful to help us understand the current and long term health of a server. My goal today is to make the case for monitoring the number of connections as one of those key metrics.
In the world of SQL Server a connection is what is allows an application or user to authenticate, submit queries, and receive results. Connections are somewhat expensive to open and they require an ongoing memory allocation so we’re going to prefer a lower connection count (and well short of the maximum of 32767 per instance).
In older client/server applications you might see each desktop application open and sustain a connection for the length of a user session, but in most modern apps (web apps, n-tier, etc) connections are consumed in a pattern often referred to as open-use-close where a connection is opened, a query is executed, and then the connection is closed. That seems a little illogical given that connections are expensive to open, but there is some behind the scenes magic called connection pooling that allows us to keep connections open and reuse them while making it seem like we’ve closed the connection. If you’ve ever seen calls to sp_reset_connection in Profiler that’s a sign that connection pooling is being used.
Let’s start by looking at our options for monitoring the connect count. You have two choices; you can query a system DMV or use the perfmon counter called “User Connections” (which is also available from a DMV). The user connections counter refers to connections that are not system connections. My view is that as long as you use the same counter or query consistently it doesn’t matter a lot whether system connections are included.
Here’s a query to retrieve the perfmon counter from within SQL. Right now I have a whopping total of 5 connections open.
SELECT *
FROM sys.dm_os_performance_counters
WHERE counter_name = 'User Connections';
We can see the results here:

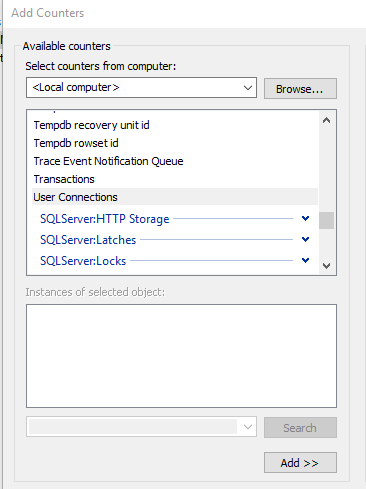
You also get it via Performance Monitor directly by looking at these counters.

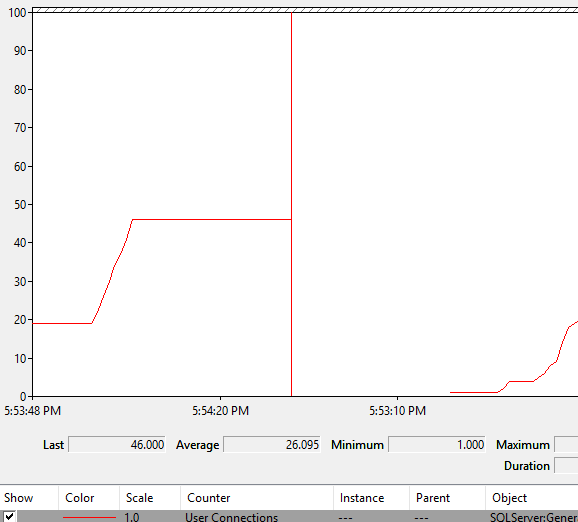
If I plot them, I'll see the count over time.

If you prefer a more SQL-centric view of things, you can get the number of user connections with this query:
SELECT *
FROM sys.dm_exec_connections
This result set contains a number of columns, which can help you troubleshoot any issues.

If you’re not familiar with using Perfmon or the sys.dm_exec_connections DMV it’s worth taking a few minutes to see what values you have on your local/development machine. Open a few new query windows in SSMS and watch the count increase.
Note: If you don’t see the counters in Perfmon it is because SQL Server isn’t installed on that machine or because something is amiss with the counters. See this post for details on how to fix the counters.
Now that you know how to view the number of connections let’s talk about why it’s a useful thing to monitor. The number of connections is a good way to understand the load - what I call the tempo of use - on an instance in a different way than looking at CPU. If I see a sudden increase in the connection count or the number of connections running higher than average for that time period I want to take a look even if CPU usage is fine. Here are some examples of why the connection could increase:
- Peak workload. Everyone logs in on Monday morning, the connection count probably goes up a lot. I’d expect it to be a similar count to the previous (non-holiday!) Monday.
- Devs aren’t closing connections. Usually ,if this happens it turns into an issue in short order because you hit the connection pool limit, but it depends on the usage and the pool limit.
- A plan changed. Yes, plans change all the time, but if it’s a plan on a high volume stored procedure that changes the execution time from 5 ms to 50 ms you’ll see the number of connections increase. Note that short duration blocking can cause the same symptom.
- More servers in use. If you’re in the cloud and scale out, either to handle load or as part of a planned effort for patching or release, those new servers will be opening connections. For some period of time you’ll have a lot more than normal.
- Change in workload. Every time you do an application change there is a chance that it does more and/or different work than before. Most of the time it’s incremental and just gets absorbed, but sometimes - like when they starting calling a new stored procedure on every page load - you’ll use more connections
There is no “magic number” that indicates a problem. On one system I monitor I have a low severity alert if the count goes over 1000 connections and a high severity alert if it goes over 1500. Most days it runs just under that 1000 level and I’d expect to see it cross over and back a couple of times on busy days. If it stays over 1000 for more than few minutes I want to dig in to see why. If it’s over 2000 we’re having a really bad day.
One point to consider if you monitor connection count is that you will eventually find value in knowing where the connections are coming from, both by server and by application. Perfmon won’t give you that answer, you have to get it from SQL, but that doesn’t mean you have to track it all the time, you can just go look if the overall count crosses whatever threshold you’ve set. Sometimes you’ll find it’s one server or one application that is causing the issue.
Wrapping up, think of the connection count as a general health indicator that is baselined to that instance. It won’t tell you what is wrong, but it can signal that there is something that needs attention before it gets worse.


