

There are many reasons you should monitor your databases, including avoiding performance problems or running out of disk space. Ideally, you want a scalable monitoring solution where you can monitor all your SQL databases in one single place. This article will describe two options that are available: Azure SQL Analytics and Azure SQL Insights. Both are based on Azure Monitor so we will start this article by looking into Azure Monitor.
Note that Azure Monitor is primarily for monitoring Azure SQL databases. For hybrid environments or on-premises SQL Server databases, I would suggest also looking into third-party tools such as Redgate SQL Monitor.
Azure Monitor
Azure Monitor is one of the very core features of Azure. You can find it by just searching for "monitor" in the Azure portal, as you can see in this image:

Azure Monitor enables you to collect logs and metrics from most Azure Services and use them for purposes such as:
- Detailed analytics and troubleshooting of your Azure services
- Alerting and automatic actions based on your collected data (with a bit of code, you can even create automatic actions for auto-scaling your Azure SQL databases)
- Displaying visualizations on resource overview pages and Azure Dashboards
For example the graph in the Azure portal on the Overview page of an Azure SQL Database is provided by Azure Monitor (see the image below).
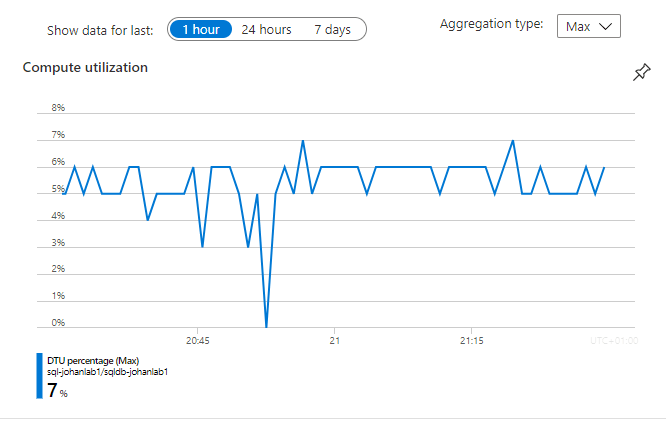
Data collected by Azure Monitor are of two kinds: metrics and logs. Each is described below.
Metrics
Azure Monitor Metrics are numeric data in a particular structure. They are a lightweight and near real-time collection, so they are useful for alerting and fast detection of issues. You can easily configure metrics-based alerts in Azure Monitor that can notify you about the alert or even take action. You can also view your metrics in interactive visual charts such as the Azure portal overview pages.
Only are a pretty small amount of metrics are available for Azure SQL databases, but they include important data such as resource usage and disk space utilization.
Logs
Azure Monitor Logs store data in records with different sets of properties. The logs are like a generic database table with different sets of columns depending of the type of row. You can write queries against the logs using the Kusto query language (KQL) and you can also configure alerts and actions based on the logs.
Logs can contain a wide variety of data. They can provide comprehensive information about Azure SQL databases that can’t be described by only simple metrics. Logs are stored in Log Analytics workspaces. Both Azure SQL Analytics and Azure SQL Insights make use of Azure Monitor logs, so you will need a Log Analytics workspace for your monitoring.
Azure SQL Analytics
Azure SQL Analytics is, as of February 2022, still in preview, although it has been around since at least the beginning of 2018(!). It enables you to monitor all your Azure SQL databases across multiple subscriptions in a single view. It also supports monitoring Managed Instances and Elastic pools.
Below is an example screenshot from Azure SQL Analytics, showing the top consuming queries and wait types for a database. You can also easily get an overview of query durations, deadlocks, SQLInsights issues and more for all your monitored databases.
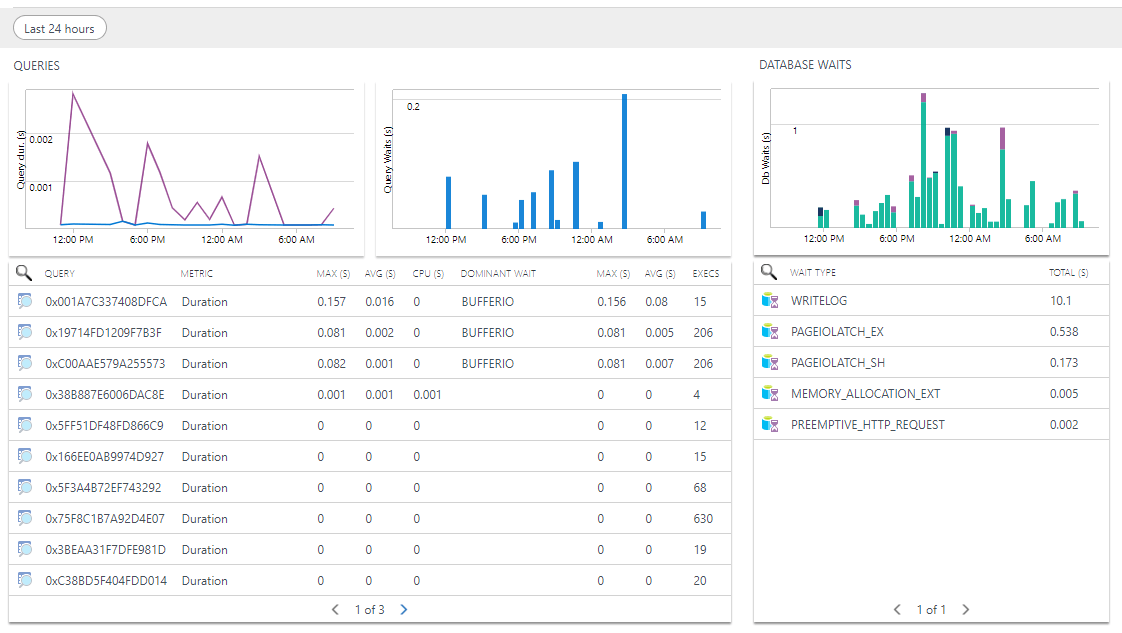
Azure SQL Analytics doesn't use any agents for collecting data. It relies on metrics and logs collected through Diagnostics settings on your Azure SQL databases.
Azure SQL Analytics can monitor all your Azure SQL databases regardless of private networks and firewalls or different subscriptions. This is because it collects the monitoring data through the diagnostic setting. Unfortunately this prevents the collection from working with on-premises SQL Server databases or databases hosted in VMs.
Azure SQL Analytics setup
To setup Azure SQL Analytics you need to do two things:
- Setup data collection from your databases into Log Analytics
- Install the Azure SQL Analytics solution
Setup data collection
Make sure you have created a Log Analytics Workspace. If not, just search for Log Analytics workspace in the Azure Portal and create.
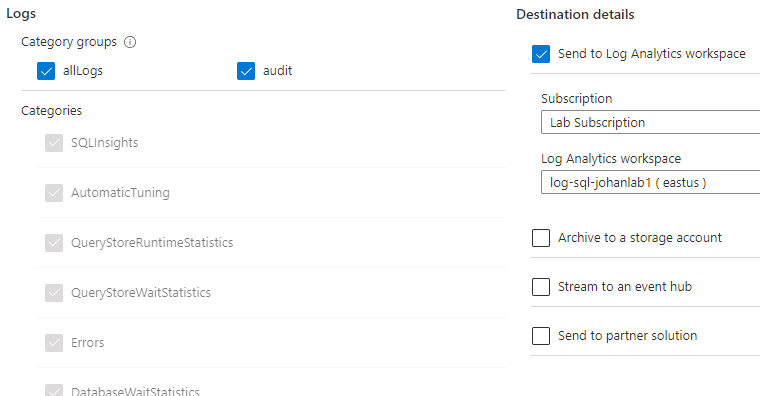
On each database you wish to monitor, go to the Diagnostic settings in the left menu in the Azure Portal and create a setting that outputs your desired logs and metrics. Select all logs and metrics. Set the destination to your Log Analytics Workspace.
Install the Azure SQL Analytics solution
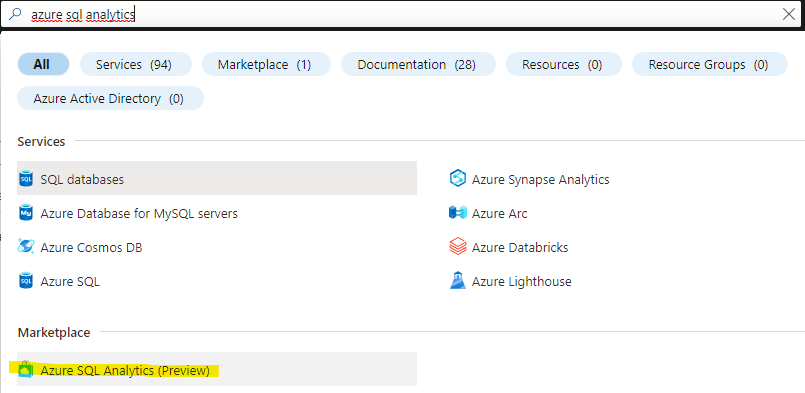
Search for "azure sql analytics" in the Azure Marketplace. It should then appear under "Marketplace":
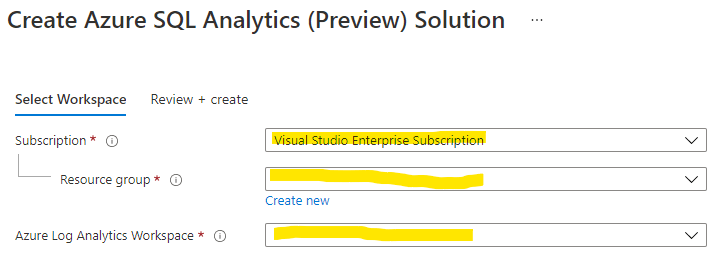
When you create the solution, select the subscription/resource group where your previously created Log Analytics workspace is located and then select the Log Analytics workspace.
After the creation, you should find Azure SQL Analytics among your resources in the Azure Portal:

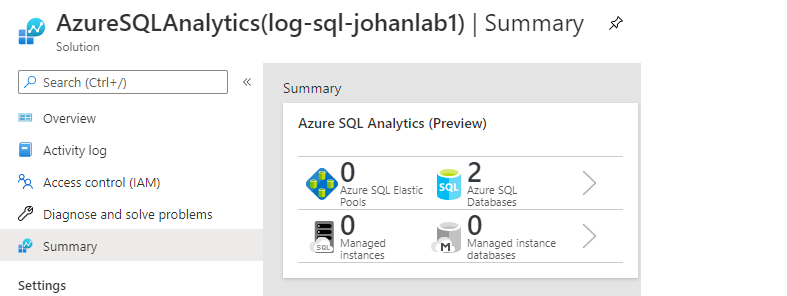
To view the monitoring dashboard, open Azure SQL Analytics and click Summary. You should see this tile that says "Azure SQL Analytics", where you can select your Azure Elastic pools, SQL databases, Managed instances or Managed instance databases.
Azure SQL Analytics is pretty easy to use. It consists of dashboards where you can click to drill-down into details. For more guidance on how to use Azure SQL Analytics, see the documentation.
Pricing
Azure SQL Analytics is free, but you will have to pay for your Log Analytics Workspace if you collect more than the free units. See Log Analytics pricing.
Azure SQL Insights
Azure SQL Insights is a monitoring solution that collects data from Dynamic Management Views of the databases. It has been around since March 2021 and is, as of February 2022, still in preview.
Azure SQL Insights can monitor SQL databases from multiple subscriptions and even on-premises SQL Servers, but there are several limitations:
- It doesn’t work with elastic pools
- It doesn’t work with lower service tiers (Basic, S0, S1, S2)
- Currently it only support SQL authentication
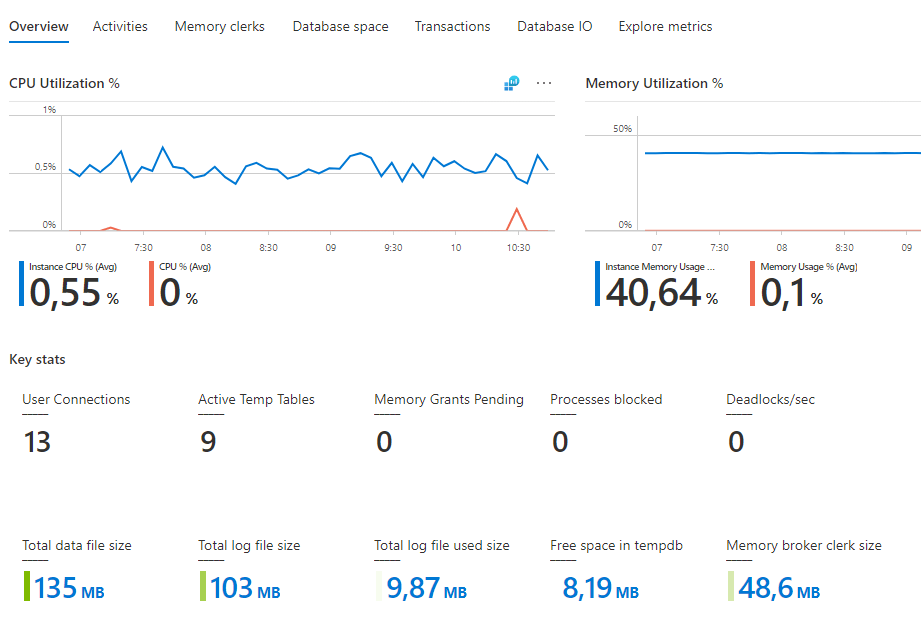
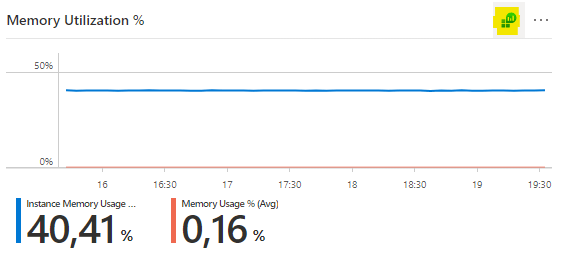
Below is a screenshot from the Azure SQL Insights dashboard, showing av overview of resource utilization.
Azure SQL Insights uses an agent, in a separate virtual machine to collect data. This monitoring agent is based on the open-source Telegraf agent and can only run on Azure virtual machines. That makes it a bit difficult to monitor on-premise databases, because your virtual machine then would need network access to those databases. Also if you have separate virtual networks without connectivity, you need to install a separate virtual machine with the agent in each network.
Azure SQL Insights Setup
These are the steps to setup Azure SQL Insights:
- Setup a Log Analytics workspace
- Create a virtual machine (VM)
- Create a monitoring profile
- Add your virtual machine to the monitoring profile and configure connection strings
Setup a Log Analytics workspace
Make sure you have created a Log Analytics Workspace. If not, just search for Log Analytics workspace in the Azure Portal and create.
Create a virtual machine
Create a VM for the monitoring agent. As of February 2022, the VM has to run Ubuntu 18.04 as operating system. If you don’t collect data from too many SQL databases, then a size such as Standard B2s should be sufficient. No special configuration is required, but the VM must have network connectivity to the databases it will monitor.
Create a monitoring profile
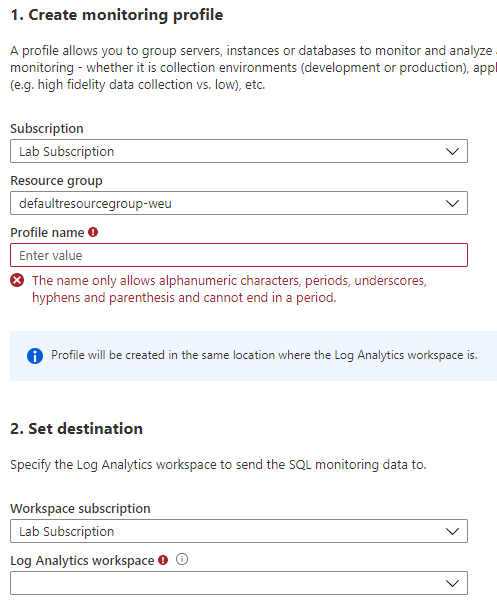
Open Azure Monitor and under Insights in the left menu, click SQL.

Choose to create a new monitoring profile. Connect it with your Log Analytics workspace.
The default collection settings contain most monitoring options, but you can add more options and change the collection time interval if you wish.
Add your virtual machine to the monitoring profile and configure connection strings
Click Add monitoring machine. Select the VM you created previously.
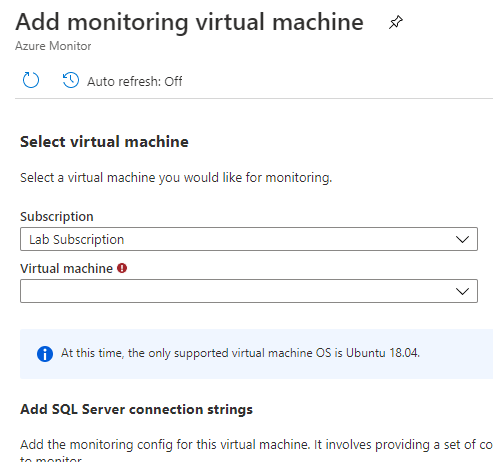
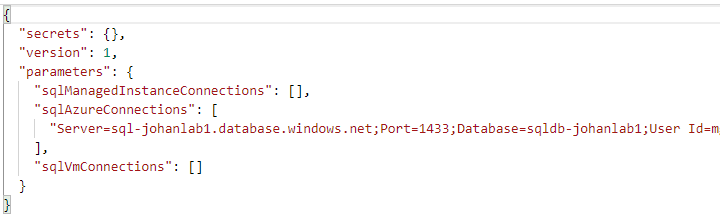
Enter your connection strings in the configuration (remember that only SQL authentication is supported).
Note:
- You are encouraged to use a key vault for storing your passwords. The sample configuration in the Azure Portal shows you how to configure with a key vault. If you use a key vault, you will need to enable access to the key vault for the managed identity of your VM.
- Make sure the SQL users specified in the connection strings have enough permissions on the databases being monitored (see under security below).
- Ensure the VM has connectivity to your databases. If you have databases in multiple virtual networks, you may need to create multiple monitoring machines to be able to connect to all your databases.
Finally click ”Add monitoring virtual machine” to let Azure SQL Insights magically install the monitoring agent on your VM.
Your virtual machine should show status ”Collecting” after a few minutes. If not, click on it to view the log.

Now the screen in Azure Monitor under SQL should look like this:
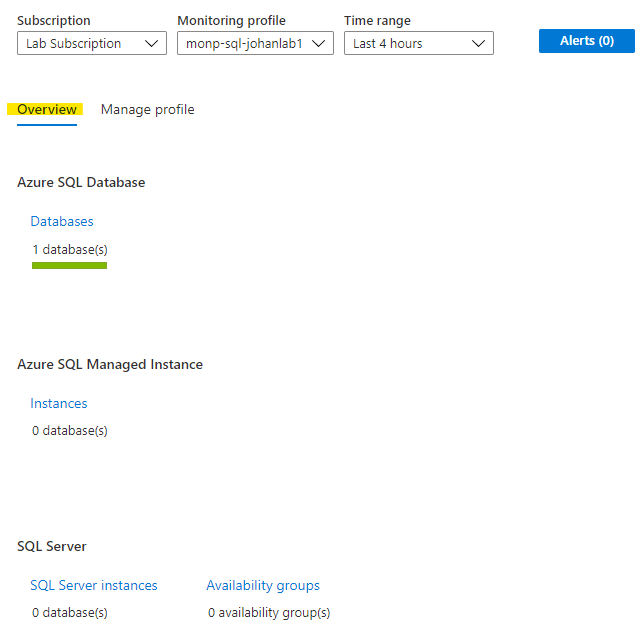
From here you drill-down into your databases, instances and availability groups and get dashboards and tables. You can also click on an icon above any graph to get the KQL query behind it.
You can even customize the dashboards with your own graphs by clicking Edit at the top of the screen and then save your own dashboards.
For more guidance on how to use Azure SQL Insights, see the documentation.
Security
It is recommended that you use dedicated SQL users for the purpose of monitoring your databases with a minimal set of privileges. The SQL users need the following permissions in the master database:
GRANT VIEW SERVER STATE TO [your_monitoring_user]
GRANT VIEW ANY DEFINITION TO [your_monitoring_user]
And in each user database:
GRANT VIEW DATABASE STATE TO [your_monitoring_user]
To view the monitoring data in Azure SQL Insights, the user needs at least to belong to the Reader role.
Pricing
Azure SQL Insights is free, but you will have to pay for the monitoring VMs. Also you will have to pay for your Log Analytics Workspace if you collect more than the free units. See Log Analytics pricing.
Conclusion
This article describes two monitoring options for your Azure SQL databases:
- Azure SQL Analytics
- Azure SQL Insights
Both are powerful monitoring options that allow you to monitor your Azure SQL databases in a single view, but they have their pros and cons. Azure SQL Analytics is easier to setup and doesn't require any extra virtual machines. Azure SQL Insights is more customizable, but require you to create virtual machines for the monitoring agent. Adding a virtual machine of course also increases the cost.
These are not the only option though, so for instance, you could use techniques such as Extended events for more advanced monitoring scenarios. For hybrid or on-premises database environments, I would also suggest looking into third-party tools such as Redgate SQL Monitor.

