

Managed Vs Unmanaged Tables
Microsoft Fabric was released as general availability on November 15th, 2023. I will be creating a series of articles to get you up to speed on how to manipulate data in the lake house using Spark. I really like the speed of the starter pools in Microsoft Fabric. A one to ten node pool will be available for consumption in less than 10 seconds. Read all about this new computing from this Microsoft learn page.
Business Problem
Our manager has given us weather data to load into Microsoft Fabric. How do we accomplish this task?
Technical Solution
This is a very simple use case for our engineers to get used to the platform. The following topics will be explored in this article.
- create an account
- create a lake house
- create directories
- upload files
- create a notebook
- create an unmanaged table
- create a managed table
- query both tables
Architectural Overview
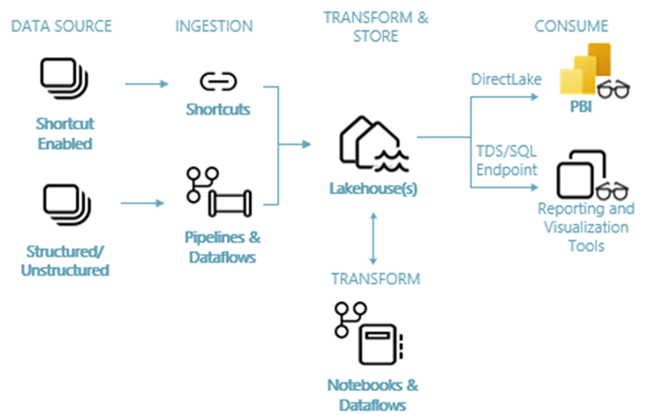
The architectural diagram shows how information flows from a source system, into a delta lake house, transformed by programs, and used by end users. To get source data into the lake, we can use any of the three methods to retrieve the data as files:
- pipelines – traditional Azure Data Factory components
- dataflows – wrangling data flows based on Power Query
- shortcuts – the ability to link external storage to the lake.
Once the data is in the lake, there are two types of programs that can transform the data files: spark notebooks and data flows.
The series of articles will be focused on how to use Microsoft Fabric’s version of Apache Spark using the Python language to transform data. However, the code samples are more than likely cross cloud and/or cross platform ready with minor changes. Once you learn Apache Spark, you can use that knowledge anywhere it is supported.
Lakehouse Setup
The first thing we need is to have a Microsoft Fabric account. You can get a free trial account here. You must use a domain account. Any free public account from @outlook.com or @gmail.com will not work. I am using my john@craftydba.com user account below.

The user interface for Microsoft Fabric reminds me of Power BI. I have a default workspace all to myself.

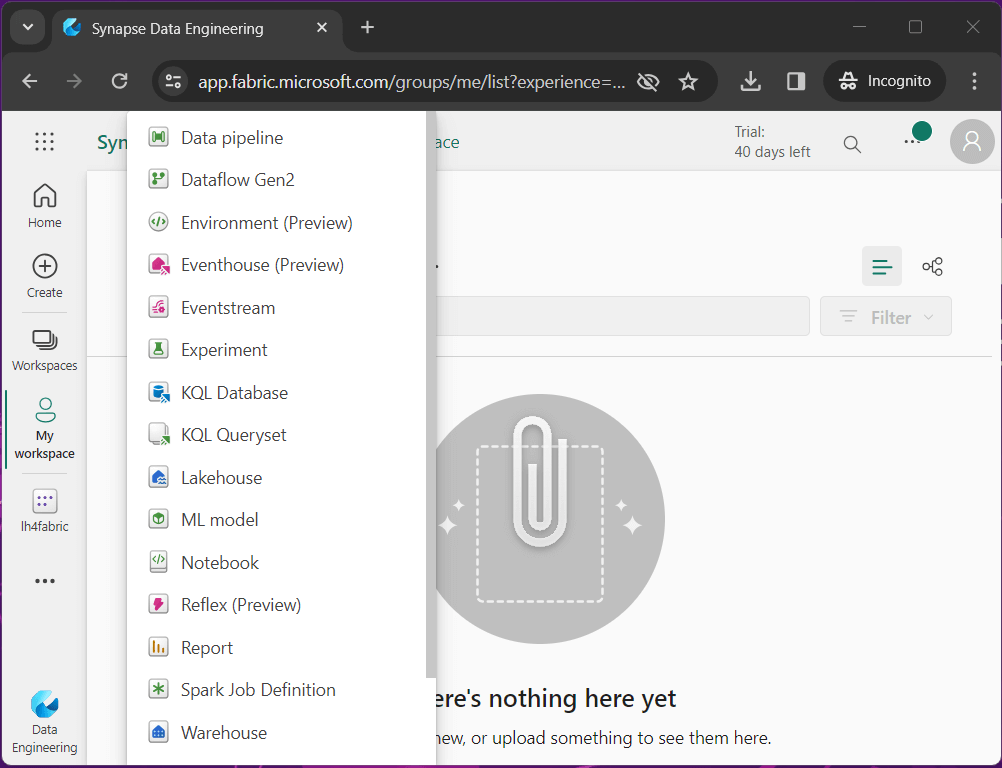
If we select the create option to the left, we get to pick and choose which object we want to create. Since we have no place to store our data, please choose the Lakehouse object.
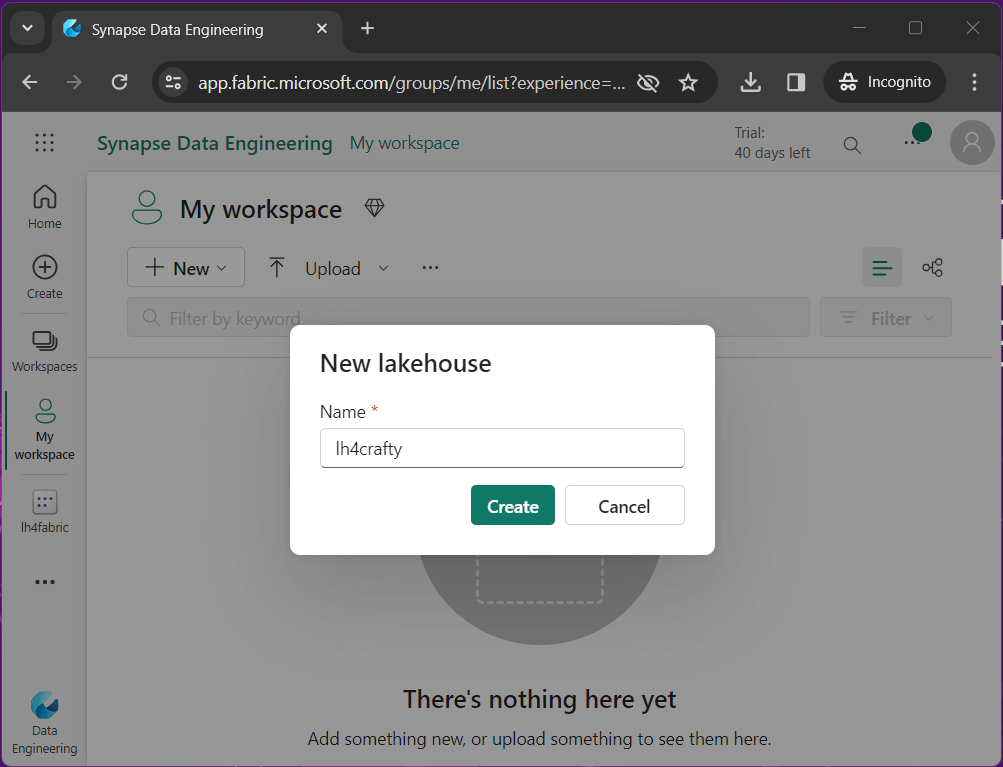
Naming conventions are important for organizing objects. The image below shows that I am prefixing the name of the Lakehouse with “lh4”. This is my convention for a lake house object in Microsoft Fabric. Make sure you company has its own naming convention for a consistent look and feel of objects inside your workspace.
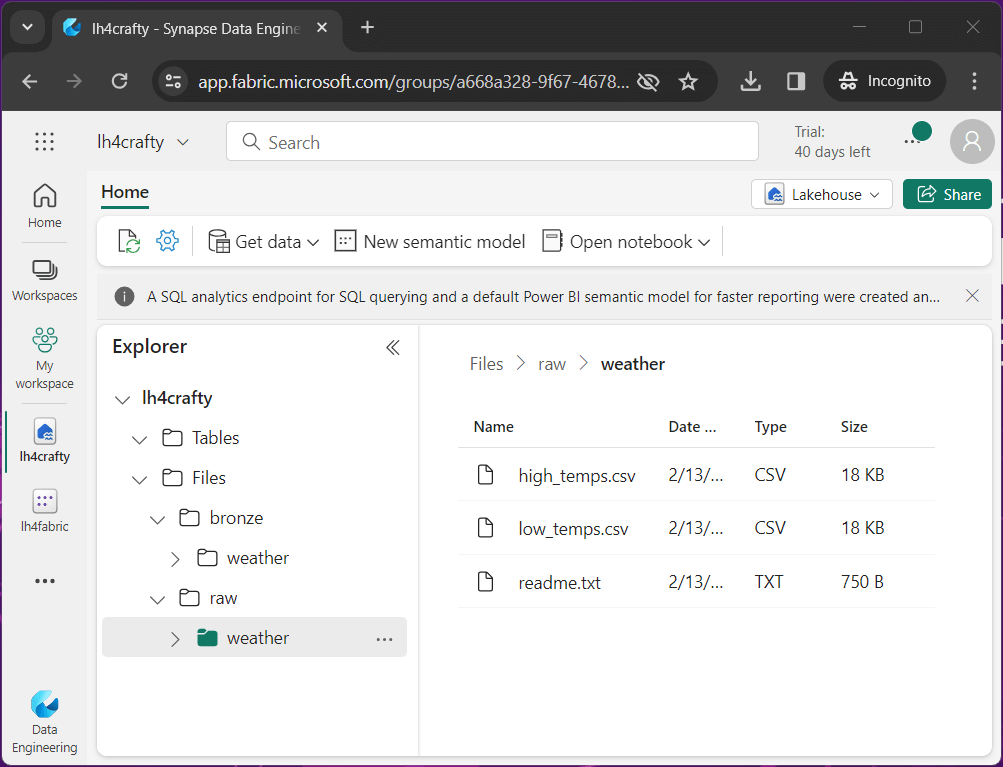
The Files folder is just like Windows Explorer. Please create directories for raw and bronze files by right clicking. Since we want to segregate data sets, create a sub directory for each data file. I uploaded the weather data files into the raw directory by right clicking. Please see the medallion architecture for details on naming conventions for folders. Basically, as you go from bronze to gold, the quality of the data is increased as well as its value to the Business Line. See thread zip file at end of article to obtain a copy of the data files.
What is a Lakehouse in Microsoft Fabric? It is a collection of data files that can be organized by folders. But we really cannot analyze data files directly. The real power is when we transform the data into a delta table. Delta tables support the ACID properties of a database and can be queried with Spark SQL. In the next section, we will be exploring how to read files and create tables using Spark Notebooks.
Spark Notebook
Jupyter Notebooks have been incorporated in many different development tools such as Data Studio and Synapse Analytics. It is not surprising that we will be creating Spark Notebooks to write our data engineering pipelines in Microsoft Fabric.
Just because we are breaking python programs into cells, it does not mean you do not comment your code. At the top of the notebook, I am showing which topics will be covered in this lesson. Jump to the end of the article to download the thread zip file that has the sample code.

The code below reads the comma separated values (CSV) file for low temperature readings into a Spark DataFrame. Because the column names might be the same between two data sets, the with column rename method is used to make the column unique.
#
# Read low temp file
#
# location
path = "Files/raw/weather/low_temps.csv"
# read file
df_low = spark.read.format("csv").option("header","true").load(path)
# rename columns
df_low = df_low.withColumnRenamed("temp", "low_temp")A similar code snippet is used to read in the high temperature data file. Two fields are renamed in preparation for joining DataFrames.
#
#  Read high temp file
#


# location
path = "Files/raw/weather/high_temps.csv"


# read file
df_high = spark.read.format("csv").option("header","true").load(path)


# rename columns
df_high = df_high.withColumnRenamed("temp", "high_temp")
df_high = df_high.withColumnRenamed("date", "date2")
To get our final dataset, we join the two DataFrames on the date columns, drop the duplicate column, and save the result set as a new DataFrame.
#
# join dataframes + drop extra columns
#
df_temps = df_low.join(df_high, df_low["date"] == df_high["date2"]).drop("date2")
If you executed the code up to this point in the notebook, the Spark Cluster will have a Spark Session that contains our transformed data in the DataFrame, named df_temps. The last step is to save the data from memory to the data lake.
Hive Tables
A hive catalog contains the information for schema on read. Unlike a database table which uses schema on write, the information on how to read a file is stored in the catalog. There are two ways to create a table in the Hive Catalog: managed and unmanaged tables. To create a managed table, we just use the save as table method. One major drawn back of this type of table type is the storage is controlled by the service. Thus, dropping a table removes both the schema (meta-data) and the data (files).
#
#  create managed (internal) table
#


df_temps.repartition(2).write.saveAsTable('managed_weather')
Creating an unmanaged table is a two-step process. First, we need to write the data to storage. Since we did not mount or link any storage to the lake house, we will use the local storage under the “Files” directory. I am going to save the data in a delta file format. The second step is to use Spark SQL to create (register) the table for the storage location. The major benefit of unmanaged tables is that a drop table action only gets rid of the meta-data, not the data files.
#
#  Write delta file
#


# location
path = "Files/bronze/weather"


# write delta files
df_temps.repartition(2)
  .write
  .format("delta")
  .mode("overwrite")
  .save(path)
The code above use the write method with the format option to create a delta file. The code below uses a special command at the top. It is called a magic command. Please see this extensive list of commands. In our notebook cell, the %sql is replace with spark.sql(“”) code at execution time.
%sql
--
--  create unmanaged (external) table
--


create table unmanaged_weather using delta
location 'Files/bronze/weather'
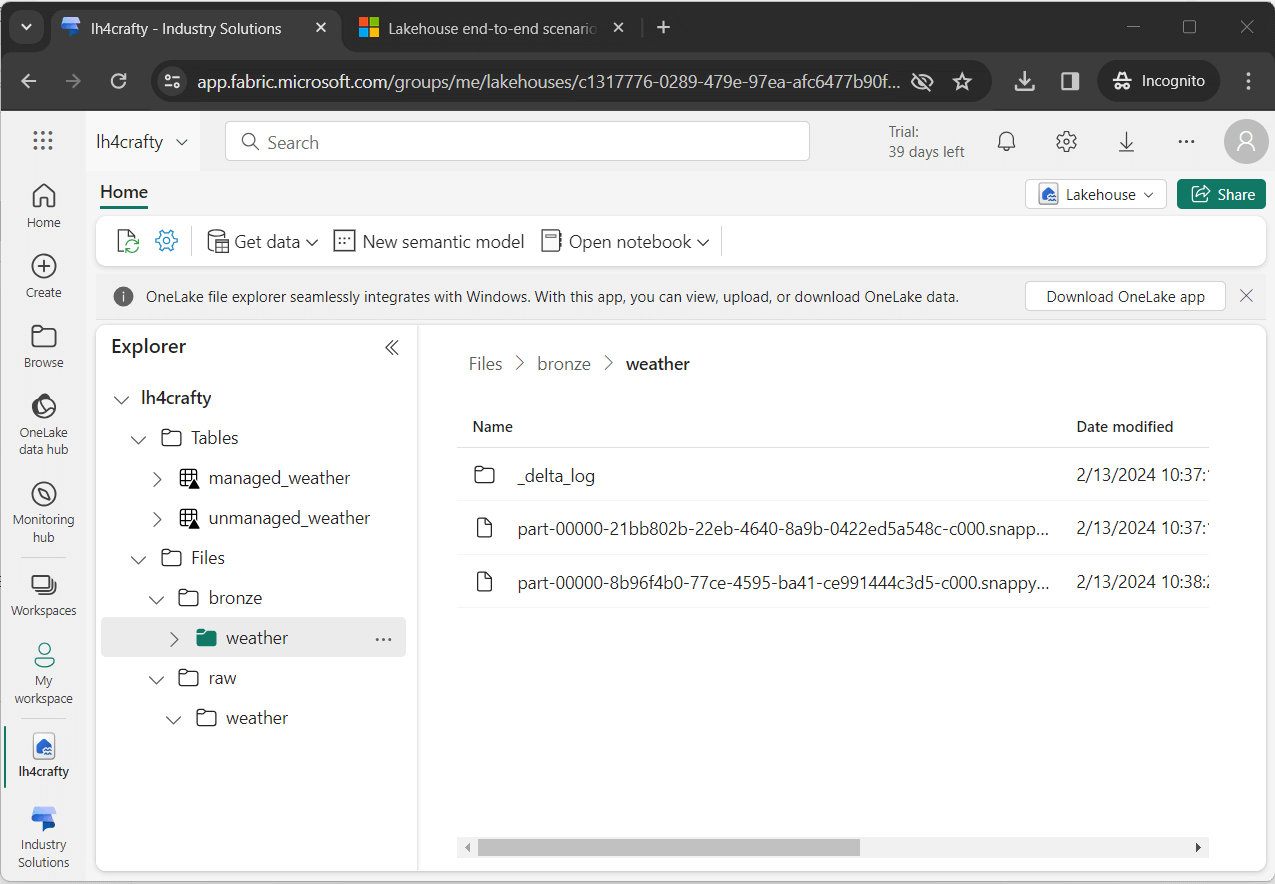
The image below the two tables have been created in the hive database. Unlike Azure Synapse that supports the create database command, Microsoft Fabric automatically creates a database when you deploy the Lakehouse object. Additionally, the image shows the two-partition delta file in the bronze quality zone.
Testing
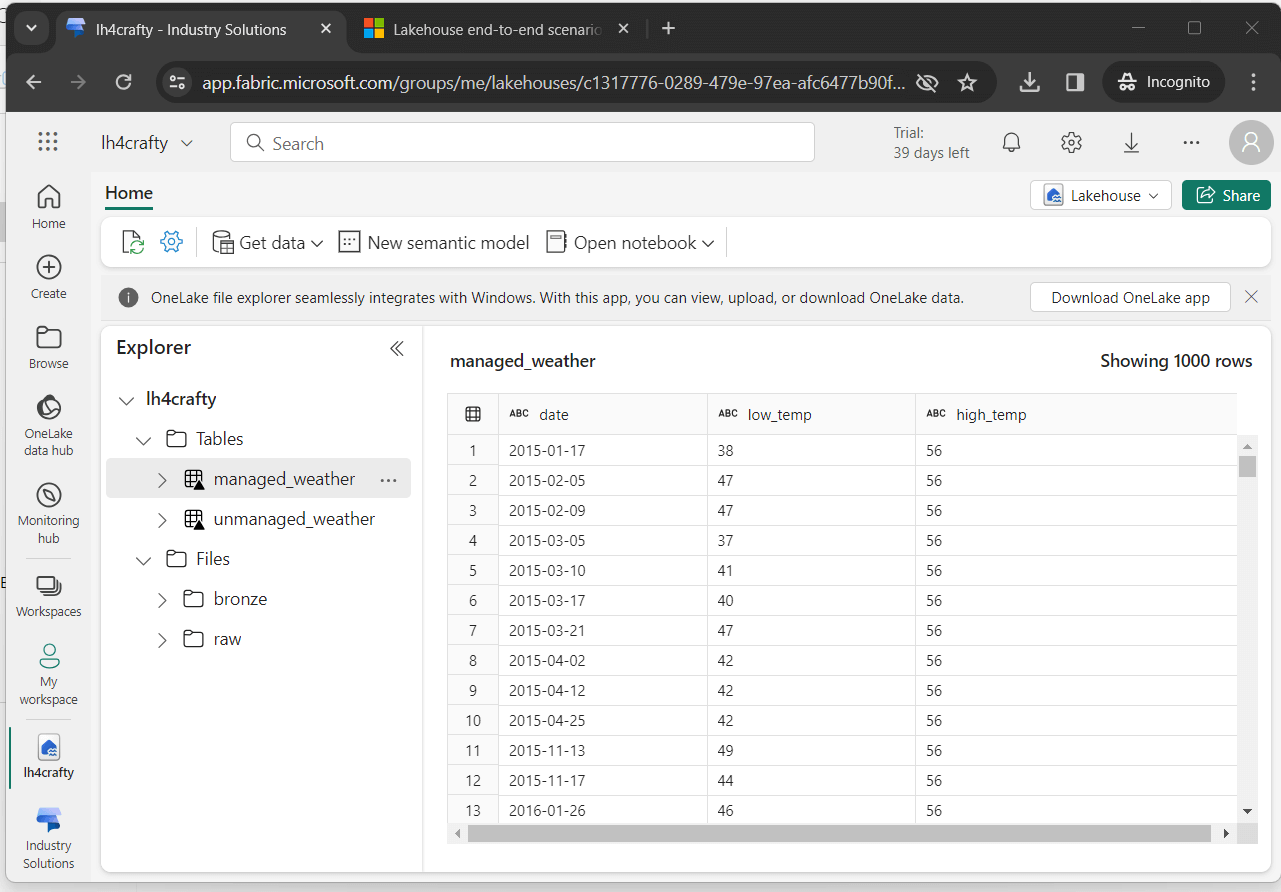
The easiest way to evaluate our hive tables is to view them visually. If we click the table, a preview window with the data is shown below. Please note the format of the data is strings. To be more accurate, we should fix this by casting the appropriate columns to dates and double precision floating points.
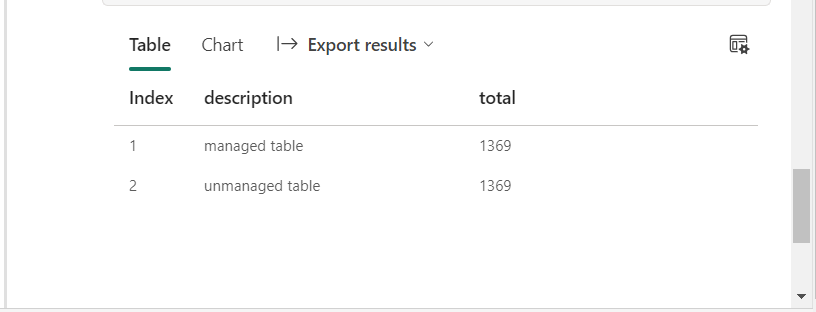
When working with big data, how can we determine if table A is a copy of table B. The first step is to check row counts.
%%sql -- get managed counts select 'managed table' as description, count(*) as total from managed_weather union -- get unmanaged counts select 'unmanaged table' as description, count(*) as total from unmanaged_weather
The output from the Spark SQL query shows matching row counts.
The cool think about PySpark is the fact that we can use both Spark SQL and/or DataFrame methods when we want. The code below filters the imaginary big data sets by a key value such as year. Then, once we determine if the datasets have the same number of rows, we can use the subtract method to validate equality.

Summary
Is the above code ready for deployment to production? The answer to that question is no. We did not evaluate the code to see if we can run the same code more than once without errors. When creating a data lake, capturing before and after record counts is especially important. This audit trail will help you when debugging issues.
The main component that is missing from Spark Notebooks is scheduling. This can be achieved by creating a Data Factory pipeline with a scheduled trigger. Additionally, we can simplify the process by using Spark SQL to expose the CSV files in the raw quality zone.
What is currently missing in Microsoft fabric?
Right now, you can create views in the hive catalog, but you cannot see them. Additionally, unmanaged tables can’t be seen by the SQL Analytics Endpoint. I can understand why views are not supported by the SQL Analytics Endpoint since the Spark SQL syntax is a-lot larger than the T-SQL syntax; However, they should be shown in the Lakehouse explorer. I am hoping the Microsoft Fabric Product Team puts both items on the agile backlog to be fixed.
What do I like about Microsoft fabric?
I love the fact that starter pools are blinding fast. This is a big deal over the major competitor, Databricks. Next time we will streamline and schedule the data engineering Spark notebook for weather data. Enclosed is the zip file with the data files and Spark notebook.