

Introduction
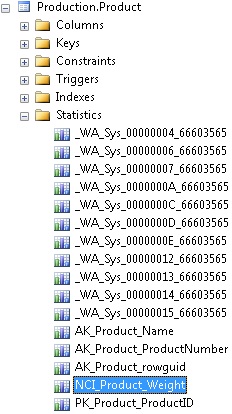
By default, SQL Server will automatically create statistics on both columns and indexes on your tables (though not on views). These statistics track basic metrics about the data in your table. When a query is executed, the statistics will help the optimizer estimate the number of rows to be returned in each step of the query. We can see what statistics are on a table via Management Studio by expanding the statistics folder underneath a table:
We can also view statistics using TSQL, like this:
DBCC SHOW_STATISTICS ("Production.Product", NCI_Product_Weight);The first set of data returned is the stat header, which gives a basic overview of the sampled data:
![]()
The update time lets you know when these statistics were last updated. Out-of-date statistics can lead to suboptimal execution plans, which could in turn cause performance problems on your SQL Server. Therefore, maintaining up-to-date statistics is critical for efficient query execution.
The Steps tells you how many ranges the table was broken into for analysis, which can be viewed in the histogram. SQL Server has a built in limit of 200 steps per statistics. As a result, there can be less, but never more than 200 rows in your histogram. Since updating statistics takes system resources, the rows sampled may be less than the total rows in the table, especially in a very large table.
The histogram is the guts of statistics:
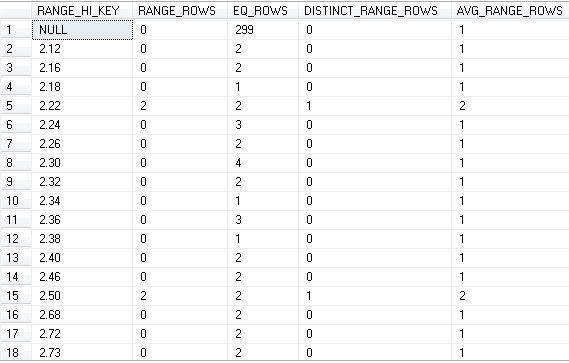
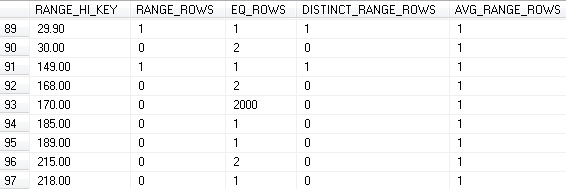
Here, your column is broken up into ranges. Each row of the histogram covers a range of values in between the previous value up to, and including the current value. RANGE_ROWS are the number of values in the range, but not equal to the RANGE_HI_KEY. EQ_ROWS are those rows equal to the RANGE_HI_KEY. DISTINCT_RANGE_ROWS are the estimated number of unique values in the range, but not including the RANGE_HI_KEY.
For example, the first row of the histogram includes NULL only and represents a total of 299 NULL values in the table for this column (299 EQ_ROWS). The second row contains all values up to, and including 2.12. Of these, 2 are equal to 2.12, and no others are in this range (2 EQ_ROWS). The 5th row, with a RANGE_HI_KEY of 2.22 contains 2 values that are exactly 2.22 (2 EQ_ROWS) and 2 values between 2.18 and 2.22 (2 RANGE_ROWS that are represented by 2.18 < value < 2.22)
There are three settings in SQL Server that guide how statistics are handled within a database. All are included in sys.databases and can be viewed with a query like this:
SELECT
       is_auto_update_stats_on,
       is_auto_create_stats_on,
       is_auto_update_stats_async_on
FROM sys.databases WHERE name = 'AdventureWorks'
Auto_update_stats_on tells you if SQL Server will automatically update stale statistics, which by default is on. This does not guarantee statistics that will give you accurate execution plans, but handles a few use cases when statistics are deemed stale. More on this below!
Auto_create_stats_on indicates if statistics will be automatically created on columns and indexes as needed, which is on by default. This is useful and should only be turned off if you are very confident about maintaining statistics manually. This setting does not apply to views, for which you will need to manually create statistics where needed.
Auto_update_stats_async_on determines if statistics should be updated before or after a query’s execution and is off by default. Turning this on speeds up query execution, but can lead to inaccurate execution plans, and therefore is recommended to be kept off.
Scenario: Inaccurate Statistics
In this example, we will simulate a set of statistics that is allowed to drift and become stale. To make this simple and easy to reproduce, auto-updating of statistics will be turned off:
ALTER DATABASE AdventureWorks
SET AUTO_UPDATE_STATISTICS OFF
Below, we will use a simple query to demonstrate the effect of statistics on our query plans:
SELECT
       ProductID,
       Weight,
       Name
FROM Production.Product
WHERE Weight = 170
The important piece of information is the WHERE clause, which filters all rows except those with Weight = 170. That query returns 1 row right now and results in the following execution plan and IO statistics:
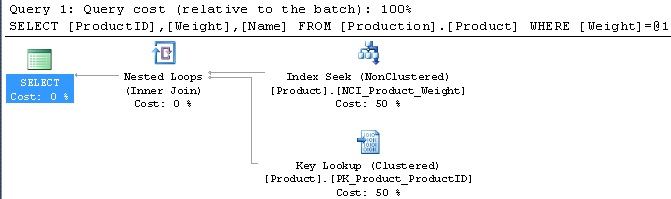
Table 'Product'. Scan count 1, logical reads 6, physical reads 0, read-ahead reads 0, lob logical reads 0, lob physical reads 0, lob read-ahead reads 0.
Currently, the query performs an index seek and quickly retrieves the single row that matches our WHERE clause. This behavior makes perfect sense and is the optimal execution plan that also results in minimal reads.
Next, we will create some additional dummy data in Production.Product, which ships with about 500 rows. Here, 1999 rows will be added, all with the same basic data (except for a few changes to allow our unique indexes to remain satisfied):
DECLARE @count INT = 1
WHILE @count < 2000
BEGIN
       INSERT INTO Production.Product
                     ( Name ,
                       ProductNumber ,
                       MakeFlag ,
                       FinishedGoodsFlag ,
                       Color ,
                       SafetyStockLevel ,
                       ReorderPoint ,
                       StandardCost ,
                       ListPrice ,
                       Size ,
                       SizeUnitMeasureCode ,
                       WeightUnitMeasureCode ,
                       Weight ,
                       DaysToManufacture ,
                       ProductLine ,
                       Class ,
                       Style ,
                       ProductSubcategoryID ,
                       ProductModelID ,
                       SellStartDate ,
                       SellEndDate ,
                       DiscontinuedDate ,
                       rowguid ,
                       ModifiedDate
                     )
       SELECT
              Name + CAST(@count AS VARCHAR(25)),
              ProductNumber + CAST(@count AS VARCHAR(25)),
              MakeFlag ,
              FinishedGoodsFlag ,
              Color ,
              SafetyStockLevel ,
              ReorderPoint ,
              StandardCost ,
              ListPrice ,
              Size ,
              SizeUnitMeasureCode ,
              WeightUnitMeasureCode ,
              Weight ,
              DaysToManufacture ,
              ProductLine ,
              Class ,
              Style ,
              ProductSubcategoryID ,
              ProductModelID ,
              SellStartDate ,
              SellEndDate ,
              DiscontinuedDate ,
              NEWID() ,
       ModifiedDate
       FROM Production.Product
       WHERE ProductID = 996

       SET @count = @count + 1
END
Now that we have added this additional data to Production.Product, we have a total of 2000 rows that fit our query’s WHERE clause, representing about 80% of the rows in the table. A quick peek at our statistics shows that these new rows have not been accounted for, either in the row count or the histogram:

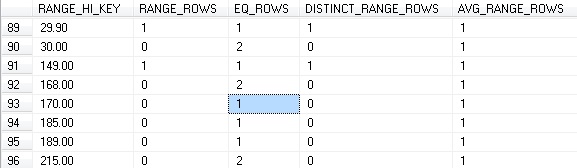
Since we have just inserted 1999 rows into our table with Weight = 170, we would expect to see 2000 EQ_ROWS for the RANGE_HI_KEY of 170. When we re-run the query, we get the following execution plan and IO statistics:

Table 'Product'. Scan count 1, logical reads 6008, physical reads 0, read-ahead reads 0, lob logical reads 0, lob physical reads 0, lob read-ahead reads 0.
Since our statistics are no longer applicable, we get the same execution plan. An index seek is not the optimal plan when we are returning such a large percentage of the table, and as a result we are forcing SQL Server to work hard to pick out all of the correct rows from the index B-Tree. This results in about 1000x more reads than we saw previously. By running this T-SQL, we can update statistics on the table:
UPDATE STATISTICS Production.Product NCI_Product_Weight;
Once updated, we can see that our statistics have sampled the correct number of rows:

Note that the Row count has been updated to 2503 (from 504), as have the Rows Sampled, which means that our histogram will also be accurate now. In addition, the equality rows for Weight = 170 are now accurate:
Note that EQ_ROWS for the RANGE_HI_KEY of 170 are now 2000, as there are 2000 rows in Production.Product with a Weight of 170. Another run of the query shows a more optimal execution plan:
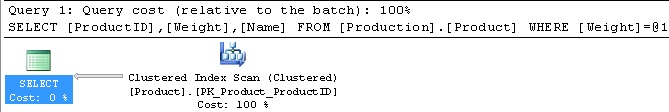
While a clustered index scan may not seem very elegant, it is the best choice for this scenario, where a large chunk of the rows in this table are being returned by our query. In addition, logical reads are a fraction of what they were before:
Table 'Product'. Scan count 1, logical reads 66, physical reads 0, read-ahead reads 0, lob logical reads 0, lob physical reads 0, lob read-ahead reads 0.
As a final illustration of this, let’s remove the new rows that we added:
DELETE FROM Production.Product WHERE ProductID > 999
When we run our original query one last time, we get the exact same query plan as the second execution above, resulting in a clustered index scan. For retrieving a single row where a nonclustered index is available, this is the wrong execution plan, and will result in triple the reads that are expected:
Table 'Product'. Scan count 1, logical reads 18, physical reads 0, read-ahead reads 0, lob logical reads 0, lob physical reads 0, lob read-ahead reads 0.
Run our statistics update from above and we will be back where we started. Our test query now shows the exact results we got at the start of this scenario: an index seek with only 6 logical reads.
Solution
By default, a database is set with AUTO_UPDATE_STATISTICS on. This will cause statistics to update whenever:
- An empty table has rows inserted into it.
- The row count in a table increases from less than 500 rows to more than 500 rows by a count of at least 500.
- The row count in a table increases from greater than 500 rows by 500 rows + 20%
These scenarios update statistics when row counts change significantly, but are not comprehensive enough for a complex production environment. In order to ensure that statistics are completely up-to-date, even if the above criteria are not met, we can update all statistics on a database at once:
EXEC sys.sp_updatestats
If we want to split up the work, or if we only care about a small number of tables or statistics, we can update statistics on only those:
-- Updates all statistics on Production.Product
UPDATE STATISTICS Production.Product;

-- Updates the statistics on NCI_Product_Weight
UPDATE STATISTICS Production.Product NCI_Product_Weight;
Statistics should only be updated during non-peak hours, as this can be a resource-intensive operation. How often you update statistics should be based on how write-intensive your data is. Daily or weekly are common intervals, but your environment may necessitate another interval based on the frequency of changes and when off-peak usage windows are available.
Note that sp_updatestats only updates statistics that require updating. If the row count within a specific index or table has not changed, then their corresponding statistics will not be updated, which helps prevent unnecessary work for this operation.
Conclusion
Accurate statistics are critical to efficient query execution. When statistics are out-of-date, performance problems and potentially severe application latency can result. While SQL Server includes default settings that help manage the addition of statistics as well as the automatic updating of statistics, it is generally a best practice to manage these tasks via your own automated processes. Regularly updating statistics will give the query optimizer the tools it needs to produce the best execution plans possible. In addition, you will prevent unwanted confusion if a performance problem arose as a result of inaccurate statistics.

