

In a Power BI project I built for a company, I started with the classic map showing revenue per shop. To make it more interesting, I decided to add the locations of competitors as dots on the map.
Not a bad idea, but harder than I expected. Getting the competitors’ database with location wasn’t straightforward, and I eventually had to rely on OpenStreetMap to obtain that information. OpenStreetMap isn’t perfect, some data is missing, and some is inaccurate, but it contains a huge amount of valuable information. And because it’s crowd-sourced, the data can always be improved and expanded over time.
Here’s the kind of result I was going for:
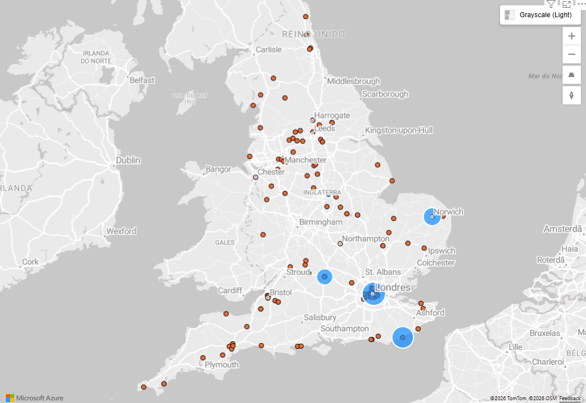
Figure 1 England Cheese Shops - "our cheese shop network" and competitors. Live Here
In this example, you see all the cheese shops in OSM for England as orange dots. From that set I asked AI to randomly choose “our” shops and generate a fictitious revenue for them. Our shops represent the Power BI data and are the blue circles, with the size representing the revenue.
If we have real data from a database and not from a text file, “our” shops and its revenue are easy to refresh: it’s Power BI 101. But how do we refresh the OSM data that we have on the reference layer? That’s the problem we are going to solve.
If you want to follow along, you can download all the files used in this article from GitHub.
Getting the data into the map
To add data to the reference layer, we are going to use a geoJSON file, although other formats like KML are accepted. We can upload a file, like you see on the figure, but that will embed the file in Power BI, and if we want to update the shops displayed, we need to upload a fresh geoJSON file to the report; not good.
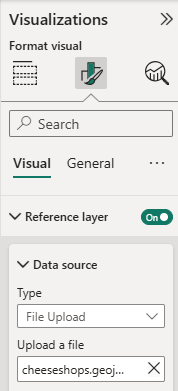
Figure 2 Use a geoJSON file in reference layer
On the other hand, if we use an URL, the file will be downloaded when the map is rendered. To use OSM data, we can use a URL that gets the data in real-time from OSM, but that isn’t a good idea. It will take some time to execute the query and sometimes it fails with timeout errors.
Instead, we are going to point the URL to a static file and schedule updates to that file in the background. In this way, we dodge any problem that can occur during the updates.
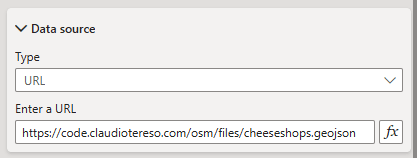
Figure 3 Use a geoJSON URL in reference layer
Using an URL in reference layer
Before you can use a URL in reference layer, there are two technical requirements that need to be addressed on the server where the files resides:
- Allow CORS (Cross-Origin Resource Sharing): By default, CORS allows a server to specify which external domains can access its resources. Without it, browsers block cross-origin requests (Azure maps is a chromium based control);
- Correct Content-Type: The server must answer with the correct MIME file, application/json for geoJSON, for Power BI to accept it.
If you try my URL (https://code.claudiotereso.com/osm/files/cheeseshops.geojson) on Power BI, it works because I have already addressed the requirements. Configuring CORS and MIME is a web server specific task. I use a shared hosting service that uses cPanel, and usually cPanel uses Apache web server, and for the Apache web server, we configure those settings in the .htaccess file.
All we need to do is create a .htaccess file in the same folder as the GeoJSON file with the following content:
<IfModule mod_headers.c>
    Header set Access-Control-Allow-Origin "*"
    Header set Access-Control-Allow-Methods "GET, OPTIONS"
    Header set Access-Control-Allow-Headers "Content-Type"
</IfModule>

<IfModule mod_mime.c>
    AddType application/geo+json .geojson
</IfModule>
The mod_headers segment solves the CORS problem by allowing requests from all origins and the mod_mime assigns the right MIME to the geoJSON files.
When you use Header set Access-Control-Allow-Origin "*" ANY webserver or application can access the returned data. If you want you can limit access to the file only to Power BI Service, but that will disable access from all other applications including Power BI Desktop. To do that, use Header set Access-Control-Allow-Origin "https://app.powerbi.com"
If you can’t host your files or configure your server, a good alternative is GitHub. It has both requirements configured. You just need to open the file in GitHub and press Raw to get the correct URL.
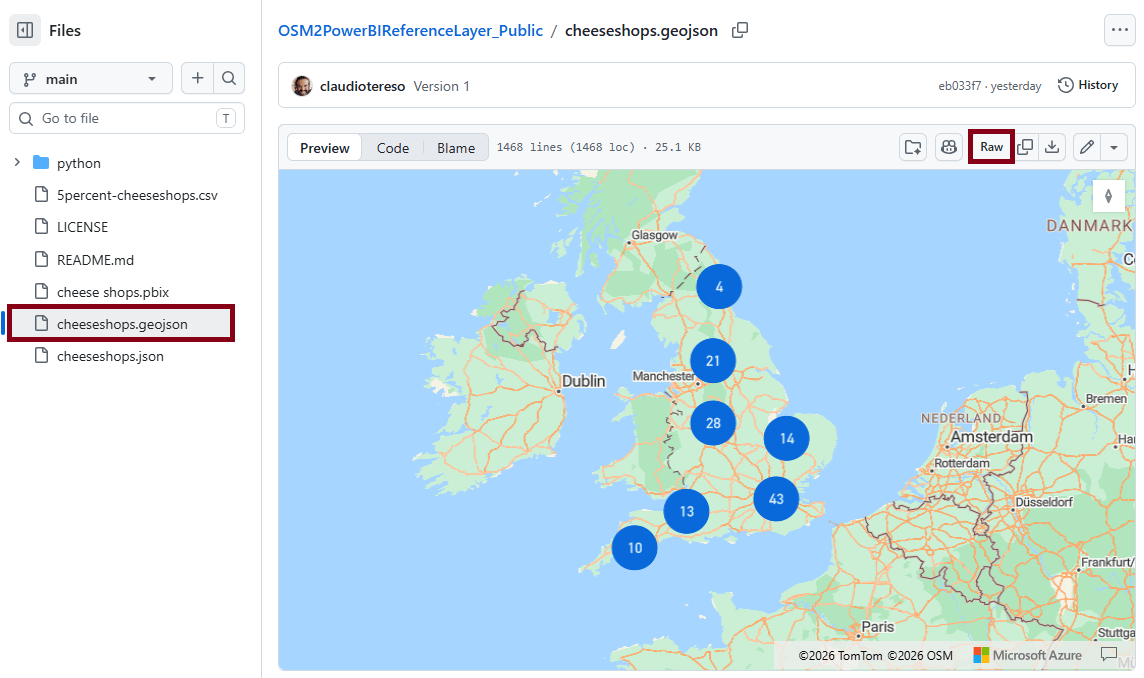
Figure 4 Getting the URL for the geojson file in GitHub
We now have a working GeoJSON URL, we just need a way to update it.
Updating the online GeoJSON file
Now we need to make things a little harder. We need Python to do this part… sorry.
The idea is to create a web service that we call to update the file. Just open the URL and it updates the file. This service will then be called by a schedule we will create in the next section. To get the information we need from OSM, we will use the Overpass API which we query through its HTTPS service. We first create the query using Overpass QL Language:
    query = """
    [out:json][timeout:60];
    area["name"="England"]["admin_level"="4"]->.eng;
    nwr["shop"="cheese"](area.eng);
    out center;
    """
This Python snippet creates a string that returns the data we need. Even without knowing Overpass QL it’s easy to understand what it does:
- Returns data in json format
- Search in England
- for nodes, ways and relations (the type of elements that make up OSM) that have the tag shop=cheese
- Return the center of the elements found. Nodes have only one point, but the other two are multi-point elements and we need only one point.
Then, we call the API and save the result in the data variable:
headers={'User-Agent': 'ClaudioTereso-OSM2PowerBI/1.0'}
url = "https://overpass-api.de/api/interpreter"
response = requests.post(url, data={"data": query},headers=headers)
data = response.json()
As we’ve seen the result is in JSON and we need to convert it to GeoJSON:
features = []
   # for each feature
   for el in data["elements"]:
      # if it’s a node get it’s coordinates
      if "lon" in el and "lat" in el:
         coords = [el["lon"], el["lat"]]
      # if it’s a way or a relation get center’s coordinates
      elif "center" in el:
         coords = [el["center"]["lon"], el["center"]["lat"]]
      # create the geoJSON element with the coordinates
      feature = {
        "type": "Feature",
           "geometry": {"type": "Point", "coordinates": coords},
            "properties": {}
      }
      # add to the collection
      features.append(feature)
      # complete geoJSON format
   geojson = {"type": "FeatureCollection", "features": features}
This snippet converts the JSON format returned by Overpass
{
   "elements": [
      {
         "type": "node",
         "id": 13935469178,
         "lat": 50.1563495,
         "lon": -5.0704313,
         "tags": {
            "name": "The Cheese & Compass",
            "shop": "cheese"
         }
      },
Into GeoJSON
{
  "type": "FeatureCollection",
  "features": [
     {
        "type": "Feature",
        "geometry": {
           "type": "Point",
           "coordinates": [
              -5.0704313,
             50.1563495
           ]
         },
         "properties": {}
      },
We could have added the other tags to GeoJSON, like name or shop, but we just need the coordinates. The smaller, the faster to upload to Power BI.
Finally, we save the GeoJSON to the file:
with open("cheeseshops.geojson", "w", encoding="utf-8") as f:
   json.dump(geojson, f, ensure_ascii=False, indent=2)
Those are the main sections of the code. In GitHub you will find the complete code that I used for the web service along with instructions on how to configure a Python app in cPanel (beware that some plans don’t include Python).
I’ve also added a version to run locally. If you don’t have a web server to host the GeoJSON file and run the python code, you can host the file in GitHub, run the python code locally and commit to upload the file, et voilà, file updated.
Scheduling the Update
In Linux we use cron to schedule jobs, but in my shared hosting I don’t have access to it, so I used the next best thing, which actually is better than cron for this service: cron-job.org. Cron-job is a free online service that runs scheduled HTTP requests, acting as a hosted cron scheduler. It has an easy-to-use interface and provides clear reporting that makes it simple to understand when each job ran, how long it took, and whether it succeeded or failed.
To schedule your service, you just need to create an account and, inside your account, press CREATE JONCRON and enter a name for your job, the URL to be called and when it should run.
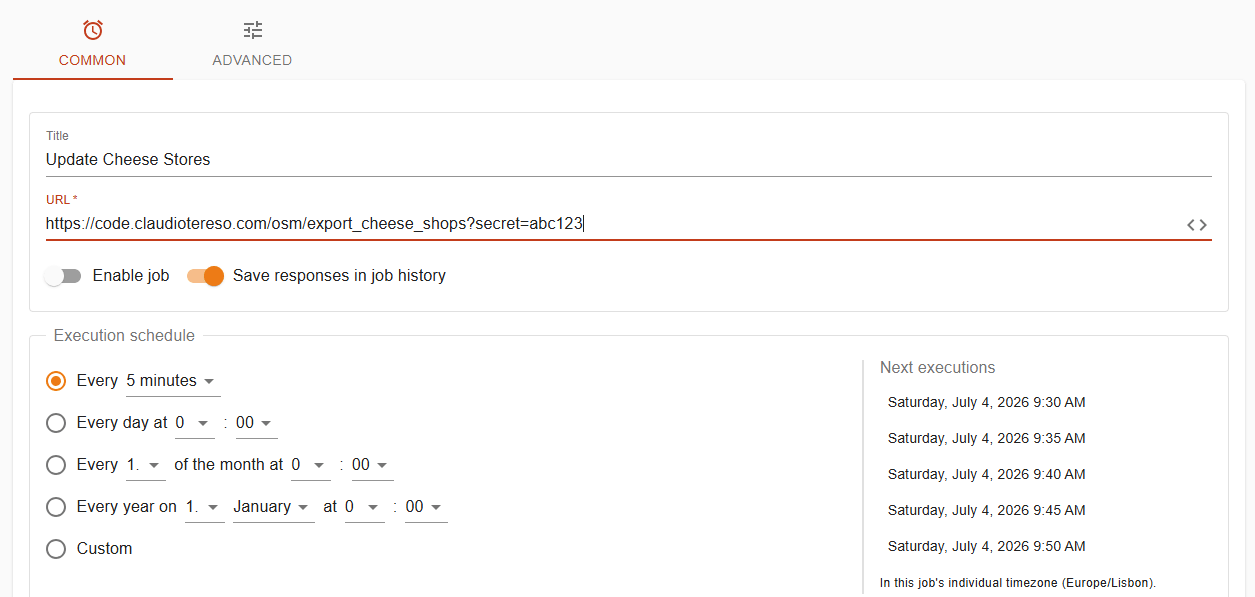
Figure 5 Creating a job in cron-job.org
Notice that I have used a parameter in my service to ensure the service cannot be triggered by third parties. And yes, the URL is real, and no, the secret is not abc123.
Cron-job.org has an excellent history page where you can see when it was run, duration, status and other execution details.

Figure 6 Cron- job history
And on top of that, if you press DETAILS, you can see the server response. In this case I made the service return the time it took to update the file and the number of cheese shops found.
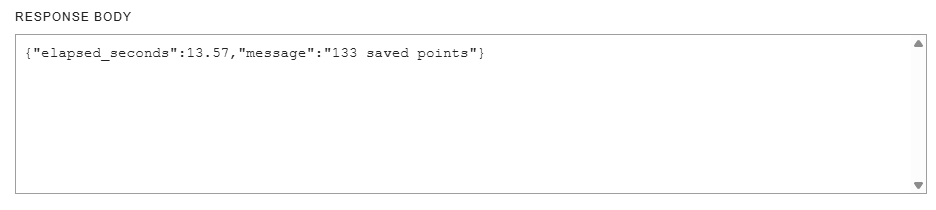
Figure 7 Cron- job history details
Final thoughts
Building Power BI Reports is not just about dropping maps and charts on a canvas. Sometimes we need to go the extra mile and that may include programming, use third-party APIs and discover amazing new web services.
This project was a journey where I had to learn quite a few new things to get it done, and those are always the best projects.