

For over 20 years, Reporting Services has been a staple of the SQL Server data platform. The first version was released in 2004 and it has grown to become a very popular reporting add-in for SQL Server, with millions of customers producing reports of their data. With the release of SQL Server 2025, the Power BI Report Server is absorbing Reporting Services and will be the future of reporting for on-premises SQL Server. No new version of Reporting Services (SSRS) is planned.
However.
There was a pilot program in SQL Server 2022 that considered using Grafana as a way of displaying SSRS reports natively and allowing integrations between SSRS and many existing dashboards. Grafana is an open source visualization platform that many people have used as a way of displaying data from a disparate set of sources. The pilot program was designed to instantiate an instance of Grafana from an SSRS server and extend the UI to read SSRS RDL files.
Getting Started
If you want to experiment with this option, you need to enable a trace flag inside of SQL Server. This is traceflag 260401, which you can enable with the following code. Note, this must be a global trace flag added to the startup of SQL Server. Open your configuration manager and add this to the Startup Parameters tab.
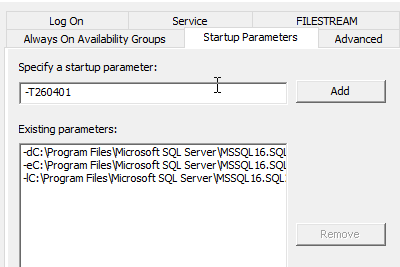
Click "Add" and verify the trace flag is available for your server.
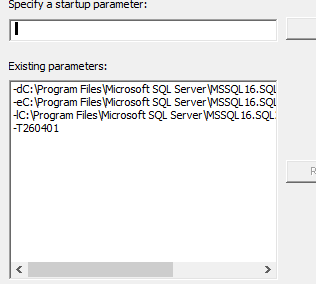
Once this is done, restart your SQL Server and the SSRS instance. This does require your SSRS server is running on the same machine as your SQL Server database to work.
Enabling Grafana in SSRS
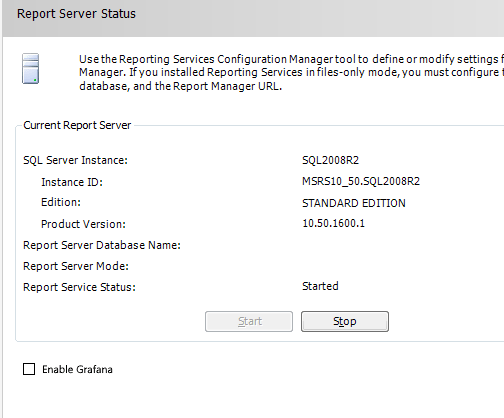
The next thing you need to do is start your Reporting Services Configuration Manager. Once you do that, on the main tab you will see your service status. At the bottom, you'll see a new checkbox that says "Enable Grafana". Click that and then stop/start your Reporting Services config.
Live Reports
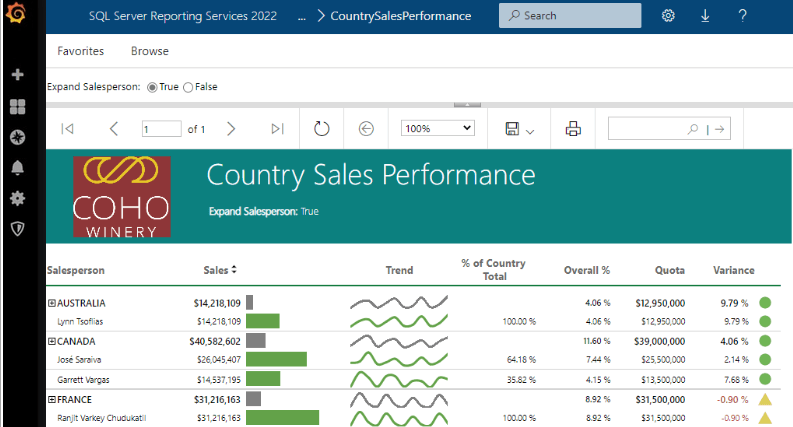
Here is a report running on my local SSRS server. You can see this is a common SSRS type of report that I've built using some of the Microsoft samples.
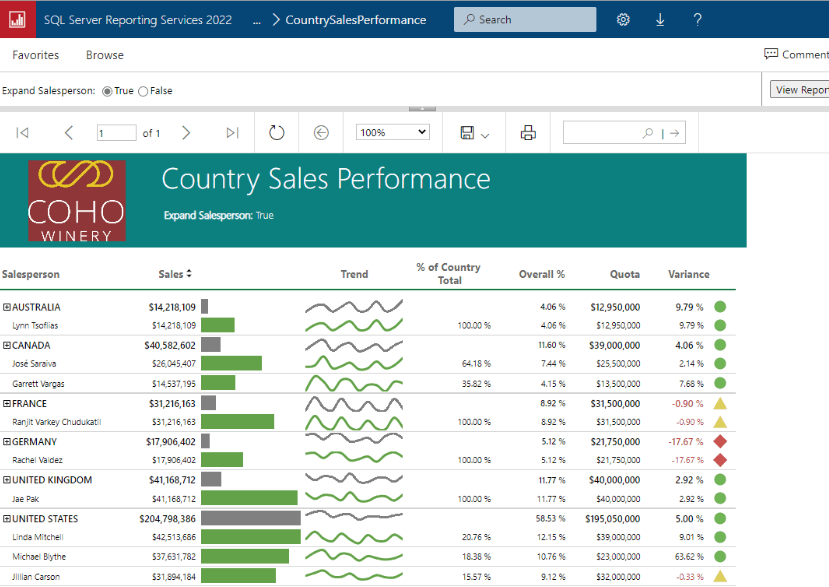
Here the same report appears once I've restarted, SSRS. Notice the Grafana sidebar.
At this point, I can use the normal Grafana configs to choose my RDL files as new visualizations that are added to the server. I can also embed these reports into dashboards to combine my SSRS data along with other data I've configured in Grafana visuals. You do have to pay attention to to sizing as the SSRS reports often want to be full screen, so you might end up rewriting some reports as less than full screen. You'll also want to check the date as today is April 1 and this is a joke.
It would be amazing if you could easily mix and match your reporting solutions, but since that might not get Microsoft any additional revenue, especially from Power BI Report Server, I doubt we'll get that choice.
Hopefully you've enjoyed this.

