

"SQL Spackle" is a collection of short articles written based on multiple requests for similar code. These short articles are NOT meant to be complete solutions. Rather, they are meant to "fill in the cracks".
--Phil McCracken
Introduction
I don’t know about you folks out there but I’m frequently called upon to perform ad-hoc analyses in SQL. It used to be that I’d just copy and paste the whole record set into Excel and do my analyses there. Of late, as my ability with SQL has grown, I became more confident to do my analyses directly in SQL, grouping and whatnot. I then just copy the summarized result set to Excel, usually to graph the final results. Clearly such things can also be done with SSRS, but Excel is easier for me.
One frequent requirement I have is to count the occurrences of some value and put that into a histogram. I found myself repeatedly and laboriously creating CASE statements to define my intervals for grouping. No more as I’ve found a better way.
Some Test Data
Let’s start with some test data, courtesy of SQL MVP Jeff Moden from his article about generating test data, where I have added some random dates in addition to the INTs and FLOATs.
DECLARE @NumberOfRows  INT
        ,@FStartValue  FLOAT
        ,@FEndValue    FLOAT
        ,@FRange       FLOAT
        ,@IStartValue  INT
        ,@IEndValue    INT
        ,@IRange       INT
        ,@DStartValue  DATETIME
        ,@DEndValue    DATETIME
        ,@DRange       INT

SELECT  @NumberOfRows = 10000
        -- Random FLOATs on the closed interval {275, 850}
        ,@FStartValue = 275
        ,@FEndValue   = 850
        ,@FRange      = @FEndValue - @FStartValue
        -- Random INTs starting at 41 and ending at 160
        ,@IStartValue = 41
        ,@IEndValue   = 160
        ,@IRange      = @IEndValue - @IStartValue + 1
        -- Example: The 30 day interval ending before midnight today
        --,@DStartValue = DATEADD(day, -30, DATEADD(day, DATEDIFF(day, 0, GETDATE()), 0))
        --,@DEndValue   = DATEADD(day, 30, DATEADD(day, -30, DATEADD(day, DATEDIFF(day, 0, GETDATE()), 0)))
        --
        -- The 60 day interval ending before midnight today
        ,@DStartValue = DATEADD(day, -60, DATEADD(day, DATEDIFF(day, 0, GETDATE()), 0))
        ,@DEndValue   = DATEADD(day, 60, @DStartValue)
        ,@DRange      = DATEDIFF(day, @DStartValue, @DEndValue)

DECLARE @MyTestTable TABLE (
  RandomInteger INT
, RandomFloat FLOAT
, RandomDate DATETIME
)

INSERT INTO @MyTestTable
SELECT TOP (@NumberOfRows)
        RandomInteger = ABS(CHECKSUM(NEWID()))  % @IRange + @IStartValue
        ,RandomFloat  = RAND(CHECKSUM(NEWID())) * @FRange + @FStartValue
        ,RandomDate   = RAND(CHECKSUM(NEWID())) * @DRange  + @DStartValue
 FROM sys.all_columns a1
  CROSS JOIN sys.all_columns a2
We’ve created three columns of interest: 1) a random FLOAT, 2) a random INTeger and 3) a random DATETIME (10,000 of each), so that we can group by intervals the frequency of occurrences. We also show an example of setting up the 30 day interval ending at midnight today (commented out). We’ll use the 60 day interval for reporting because it is a more general case for setting up our intervals (we’ll use 2 days per interval).
Charting Integer Values (Discrete Data)
First we’ll set up the intervals for our integer groupings. In this case, we’ll choose 40 intervals equally divided into 3 integers each. You need to examine the end points of your data closely, so you can set up appropriately spaced intervals. In this case, we knew what they were but you could just as easily have selected MIN(RandomInteger) into @IStartValue and MAX(RandomInteger) into @IEndValue.
DECLARE @NoIntervals INT
SET @NoIntervals = 40

;WITH SetUpIntervals AS (
    -- Anchor: Initial, placeholder interval for totals
    SELECT ID=0
         , StartInterval = CAST(NULL AS INT)
         , EndInterval   = CAST(NULL AS INT)
         , Interval      = CAST('Total' AS VARCHAR(40))
    UNION ALL
    -- Anchor: Start interval taken from @IStartValue
    SELECT ID=1
          ,StartInterval = @IStartValue
          ,EndInterval   = (@IStartValue - 1) + @IRange/@NoIntervals
          ,Interval      = CAST(CAST(@IStartValue AS VARCHAR) + ' to ' +
            CAST((@IStartValue - 1) + @IRange/@NoIntervals AS VARCHAR) AS VARCHAR(40))
    UNION ALL
    -- Recursive: Next interval starts at 1 + last EndInterval
    SELECT ID + 1
          ,1 + EndInterval
          ,EndInt
          ,CAST(CAST(1 + EndInterval AS VARCHAR) + ' to ' +
            CAST(EndInt AS VARCHAR) AS VARCHAR(40))
    FROM SetUpIntervals
    -- CROSS APPLY to only calculate EndInterval once
    CROSS APPLY (SELECT EndInterval + @IRange/@NoIntervals) x(EndInt)
    WHERE ID > 0 AND ID < @NoIntervals)
--SELECT * FROM SetupIntervals
SELECT c.Interval
     , MyIntFreq= CASE
                  WHEN MyIntFreq IS NULL THEN 0
                  ELSE MyIntFreq
       END
 FROM SetupIntervals c
LEFT JOIN (
    -- Obtain frequencies by COUNTing RandomInteger from source table by Intervals
    SELECT ID, MyIntFreq=COUNT(*)
    FROM @MyTestTable
    -- CROSS APPLY to put RandomIntegers into Intervals
    CROSS APPLY (
        SELECT ID
        FROM SetUpIntervals
        WHERE RandomInteger BETWEEN StartInterval AND EndInterval AND
            StartInterval IS NOT NULL) a
    -- Use ROLLUP to get a total row in the grouped results set
    GROUP BY ID WITH ROLLUP) b
    ON ISNULL(b.ID, 0) = c.ID
ORDER BY c.ID
As you can see, we’ve used a recursive CTE to create our intervals, start and end, along with a text string that describes the interval, which will ultimately become the x-axis label in our Excel histogram. We won’t use the total (from ROLLUP) in the histogram, but we may want to use it as a cross-check to make sure we didn’t lose anything in the interval mapping. The LEFT JOIN, along with a check for COUNT(*) being NULL, ensures that any missing data gets filled in with zero counts.
Note also the commented out statement right after the SetUpIntervals CTE, which is useful if you need to tweak your intervals and you want to check them before running a data intensive grouping.
--SELECT * FROM SetupIntervals
Run the first script and copy/paste the results set (with headers if you prefer) into Excel and then with a little Excel wizardry you can produce a really pretty histogram of your summarized results to impress your colleagues and, more importantly, your boss.

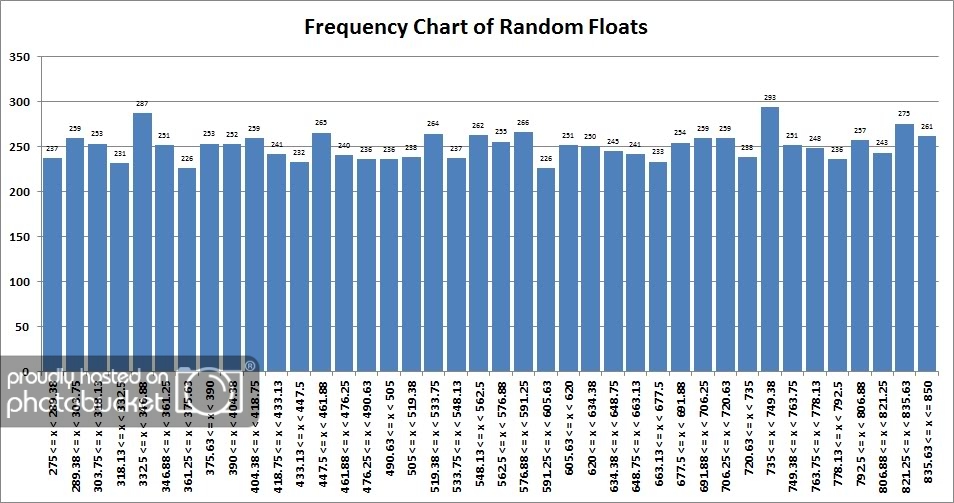
Charting Numbers with Decimals (Continuous Data)
Handling FLOATs (or MONEY or DECIMAL data types) requires a slightly different approach. It is less important to match the number of intervals against MAX and MIN values in your data, but you still need to know what these are to establish the interval endpoints. You will need to do a little auspicious rounding and a little fudging to make sure you don’t drop any values from the last interval.
SELECT @FStartValue=MIN(RandomFloat), @FEndValue=MAX(RandomFloat)
 FROM @MyTestTable

;WITH SetUpIntervals AS (
    -- Anchor: Initial, placeholder interval for totals
    SELECT ID=0
        ,StartInterval = CAST(NULL AS INT)
        ,EndInterval   = CAST(NULL AS INT)
        ,Interval      = CAST('Total' AS VARCHAR(40))
    UNION ALL
    -- Anchor: Start interval taken from @FStartValue
    SELECT ID=1
        ,StartInterval = StartInt
        ,EndInterval   = EndInt
        ,Interval=CAST(CAST(StartInt AS VARCHAR(10)) + ' <= x < ' +
            CAST(EndInt AS VARCHAR(10)) AS VARCHAR(40))
    FROM (
        SELECT StartInt=CAST(FLOOR(@FStartValue) AS FLOAT)
            ,EndInt=ROUND(FLOOR(@FStartValue) + CAST(@FRange AS FLOAT)/@NoIntervals, 2)) x
    UNION ALL
    -- Recursive: Next interval starts at last EndInterval
    SELECT ID + 1
        ,EndInterval
        ,EndInt
        ,CAST(CAST(EndInterval AS VARCHAR(10)) + ' <= x <' +
            CASE ID WHEN @NoIntervals - 1 THEN '= ' ELSE ' ' END +
            CAST(EndInt AS VARCHAR(10)) AS VARCHAR(40))
    FROM SetUpIntervals
    -- CROSS APPLY to only calculate EndInterval once (fudging endpoint on last interval)
    CROSS APPLY (
        SELECT CASE ID WHEN @NoIntervals - 1 THEN CAST(CEILING(@FEndValue) AS FLOAT)
            ELSE ROUND(EndInterval + CAST(@FRange AS FLOAT)/@NoIntervals, 2) END) x(EndInt)
    WHERE ID > 0 AND ID < @NoIntervals)
--SELECT * FROM SetupIntervals
SELECT c.Interval
     , MyFloatFreq= CASE
        WHEN MyFloatFreq IS NULL THEN 0
        ELSE MyFloatFreq
      END
 FROM SetupIntervals c
LEFT JOIN (
    -- Obtain frequencies by COUNTing RandomFloat from source table by Intervals
    SELECT ID, MyFloatFreq=COUNT(*)
    FROM @MyTestTable
    -- CROSS APPLY to put RandomFloats into Intervals
    CROSS APPLY (
        SELECT ID
        FROM SetUpIntervals
        WHERE RandomFloat >= StartInterval AND
            -- Fudge the last interval so it is inclusive (<=)
            ((ID = @NoIntervals AND RandomFloat <= EndInterval) OR
            (ID <> @NoIntervals AND RandomFloat < EndInterval))) a
    -- Use ROLLUP to get a total row in the grouped results set
    GROUP BY ID WITH ROLLUP) b
    ON ISNULL(b.ID, 0) = c.ID
 ORDER BY c.ID
Voila! After a quick copy/paste into Excel we have another really pretty histogram!
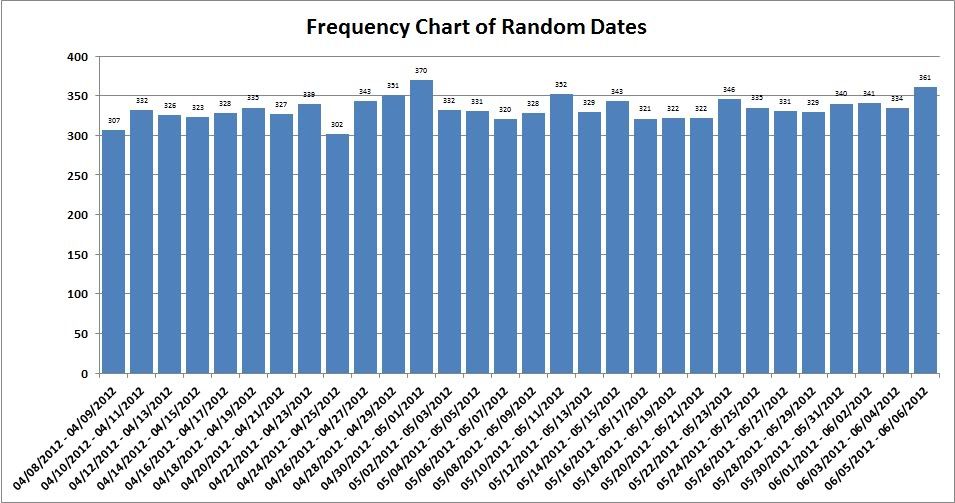
Charting Over Date Periods (Continuous Data)
Handling dates isn’t much different than the above but it does combine some of the features of both. We’ll define 30 intervals this time (2 days per interval). The main difference from FLOAT is there’s no need to fudge the endpoint (we’ll want it to be less than the end date of the final interval) and that the CASTs are to DATETIME, with CONVERT used to get the date into a format we like for the labels (mm/dd/yyyy).
SET @NoIntervals = 30

;WITH SetUpIntervals AS (
    -- Anchor: Initial, placeholder interval for totals
    SELECT ID=0
        ,StartInterval = CAST(NULL AS DATETIME)
        ,EndInterval   = CAST(NULL AS DATETIME)
        ,Interval      = CAST('Total' AS VARCHAR(40))
    UNION ALL
    -- Anchor: Start interval taken from @DStartValue
    SELECT ID=1
        ,StartInterval = @DStartValue
        ,EndInterval   = 1 + (@DStartValue - 1) + @DRange/@NoIntervals
        ,Interval=CAST(CONVERT(VARCHAR(10), @DStartValue,101) + ' - ' +
            CONVERT(VARCHAR(10), (@DStartValue - 1) + @DRange/@NoIntervals, 101) AS VARCHAR(40))
    UNION ALL
    -- Recursive: Next interval starts at last EndInterval
    SELECT ID + 1
        ,EndInterval
        ,EndInterval + @DRange/@NoIntervals
        ,CAST(CONVERT(VARCHAR(10), EndInterval, 101) + ' - ' +
            CONVERT(VARCHAR(10), EndInterval + @DRange/@NoIntervals - 1, 101) AS VARCHAR(40))
    FROM SetUpIntervals
    WHERE ID > 0 AND ID < @NoIntervals)
--SELECT * FROM SetupIntervals
SELECT c.Interval, MyDateFreq=CASE WHEN MyDateFreq IS NULL THEN 0 ELSE MyDateFreq END
 FROM SetupIntervals c
LEFT JOIN (
    -- Obtain frequencies by COUNTing RandomDate from source table by Intervals
    SELECT ID, MyDateFreq=COUNT(*)
    FROM @MyTestTable
    -- CROSS APPLY to put RandomDate into Intervals
    CROSS APPLY (
        SELECT ID
        FROM SetUpIntervals
        WHERE RandomDate >= StartInterval AND RandomDate < EndInterval) a
    -- Use ROLLUP to get a total row in the grouped results set
    GROUP BY ID WITH ROLLUP) b
    ON ISNULL(b.ID, 0) = c.ID
 ORDER BY c.ID
Once again, pasting our results into Excel we have a nicely formatted histogram over the desired date range.
Conclusion
I have successfully used these scripts across many examples including:
- Frequency charts of batch job run times across intervals of run times in seconds or minutes.
- Frequency charts showing on-demand batch jobs, either counted by interval or over a specific time period charting their run times by interval.
- Transaction counts charted over selected time periods.
- You can also use it for SUMs instead of COUNTs, and I have done this to calculate invoiced revenue over specific time periods.
I have attached an Excel workbook that provides some templates for your charting endeavors.
We hope that if you do ad-hoc reporting against your SQL databases, you’ll consider these scripts a useful addition to your toolbox. Has this SQL Spackle filled a crack?
