

Review of SQL Trace Manager
by Dale Elizabeth Corey, 6/22/2004
Introduction
Ever wanted to create you own server-side SQL Server trace without having to run internal system procedures to define the server-side trace and having to specify numbers for events and data columns? Well, SQL Trace Manager (a SQL Enterprise Manager extension snap-in)
is a convenient GUI (graphical user interface) tool that allows database administrators to create, control, and manage
server-side traces in Microsoft SQL Server. In effect, after SQL Trace Manager is installed, a Trace Folder is added to each SQL Server in Enterprise Manager . The Trace folder includes a Running folder and a Finished folder (see Figure 1).
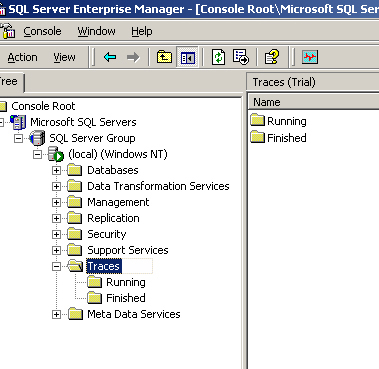
Figure 1
New traces are created by right clicking on the Traces folder in Enterprise Manager and invoking an interface (see Figure 2) similar to Microsoft SQL Server's SQL Profiler (a client-side component which incurs more overhead to define and capture events). With SQL Trace Manager's server-side capabilities, administrators can start, pause, and stop traces; schedule trace
start-up times; and analyze trace results.
 |  |  |  |
SQL Trace Manager's Interface
Figure 2
Environment
SQL Server 2000 is required as well as Enterprise Manager. The platforms specified that it will run on
are Windows 9x, Windows ME, Windows XP, Windows NT, Windows 2000, and Windows Server 2003. Minimum hardware requirements were not specified.
Installation
Installation was fast and easy. It consisted of specifying a destination location, start menu folder options, and creating desktop icon options.
Using SQL Trace Manager
To start a trace, you right click the Traces folder. You will have the option to "Drop Trace Database" or "Create a New Trace" (see Figure 3).
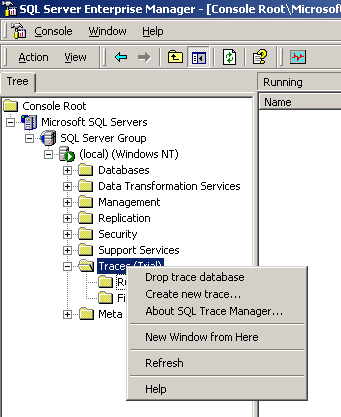
Figure 3
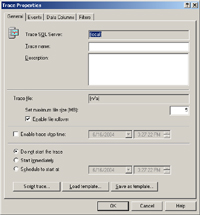
Under the General tab of the Trace Properties, you will be given the options to name the trace, provide a trace description, set the maximum file size, enable file rollover, enable trace stop time, do not start the trace, start immediately, schedule a start time, script the trace file (*.sql), load a template, or save as a template (see Figure 4).
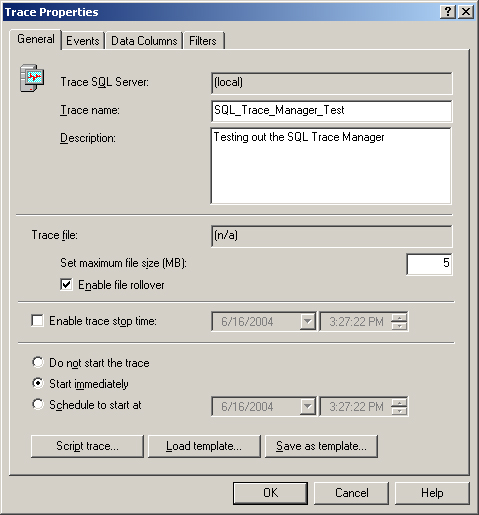
Figure 4
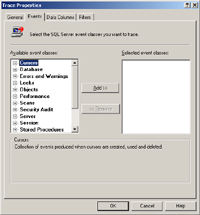
Under the Events tab of Trace Properties , you will have the option to choose an event (an action generated by SQL's server engine) and choose the event class (see Figure 5).
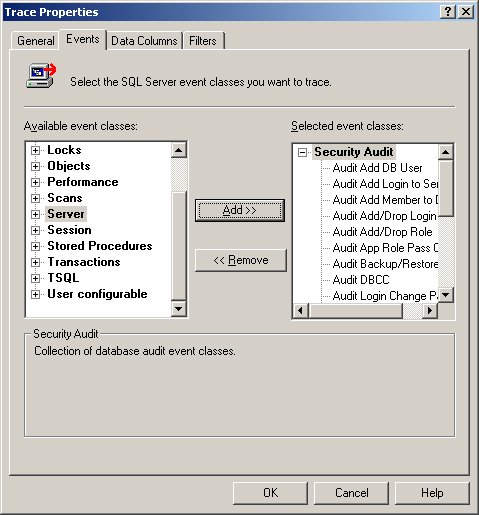
Figure 5
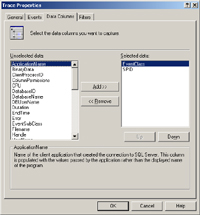
Under the Data Columns Tab of Trace Properties, you can select the data columns you want to capture (see Figure 6).
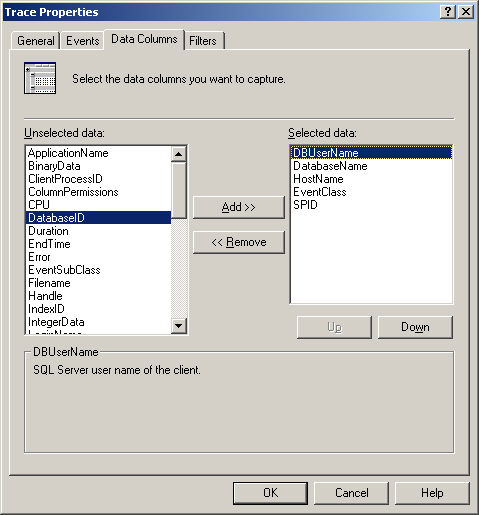
Figure 6
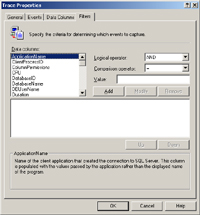
Under the Filters tab of Trace Properties, you can specify the criteria for the events begin captured (see Figure 7).
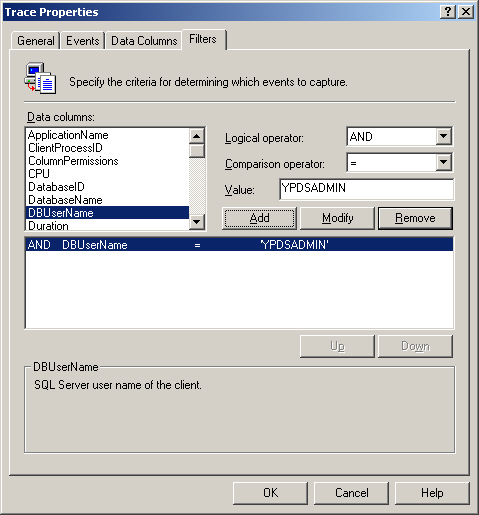
Figure 7
Running vs Finished
The “Running” subfolder displays (see Figure 8) all existing traces including traces created by SQL Trace Manager (“native” traces) and traces created by other tools (“non-native” traces). Non-native traces do not have a name; “(n/a)” is displayed as the trace name for non-native traces.
A trace may be in either paused or active (resumed) state. The trace state is indicated by the trace icon and a descriptive text in “Status” column.
![]() The trace is active
The trace is active
![]() The trace is paused
The trace is paused
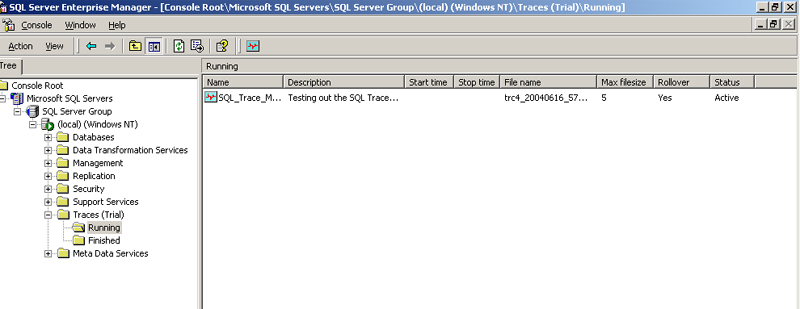
Figure 8
To start, resume, or stop a trace, click on the Start/Resume/Stop button while you are in the Running folder (see igure 9) or select one of these actions from the right-click popup menu.
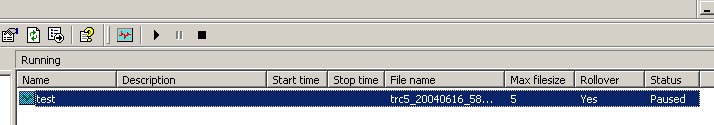
Figure 9
Starting or pausing a trace, changes the trace status only. Stopping a trace moves it from “Running” folder to “Finished” folder. When you stop a non-native trace, you are prompted to store trace information (trace events, data columns and filters) in the trace database. If you choose not to save this information, you will not be able to work with trace results using SQL Trace Manager.
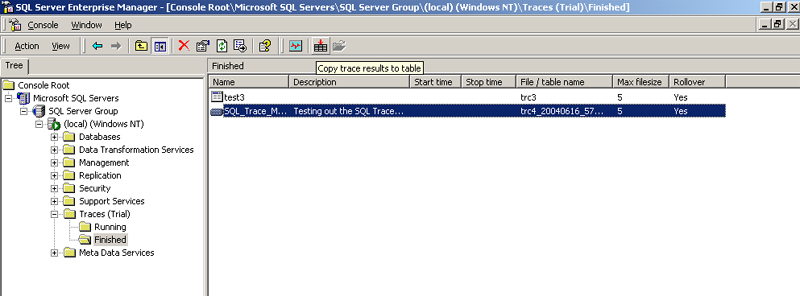
When a trace is stopped, the trace object no longer exists at the server. But the trace database keeps information about the stopped traces. Therefore, you can read and analyze trace information with SQL Trace Manager even if the trace object is gone. The stopped traces are shown in “Finished” subfolder (see Figure 10). Stopped traces cannot be resumed.
Initially, the trace result is saved as a file on the server. You can copy the trace result into a table in the trace database.
![]() The trace result is stored in a file
The trace result is stored in a file
![]() The trace result is stored in a table
The trace result is stored in a table
IMPORTANT NOTE: The trace results that are stored in tables can be opened in SQL Profiler. Simple click on the "Copy trace results to table" button on the toolbar. SQL Profiler will open when the table icon is double clicked.
Support
Support seems very limited. The Web site only allows you to provide a feedback form. The Help options with the "trial" version were very limited and many topics were left undone.
Conclusions
Server-side traces are much more efficient than using the client-side SQL Profiler tracing if you are implementing instense traces such as capturing all the event classes (over 100+) and data in those events. Server-side traces are written sequentially like the transaction log, and then, once the trace is stopped, can be converted to a table to be viewed in SQL Profiler. SQL Trace Manager makes this easy without the administrator having to know how to programmatically start a trace with the sp_trace internal procedure and using numbers to specify events and data columns. On the contrast, client-side traces writes the table as is it is happening, one row at a time. This allows the adminsitrator to actively monitor the trace. Unfortunately, because SQL Trace Manager is server-side, active monitoring is not an option.
Ratings
I will rate each of the following using a scale from 1 to 5. 5 being the best
and 1 being the worst. Comments are in the last column.
| Ease of Use | 5.0 | Very easy to install and use |
| Feature Set | 5.0 | Fully featured for server side traces |
| Value | 3.0 | Seems overpriced for options provided, especially if you are familiar with sp_trace |
| Technical Support | 2.0 | Very limited |
| Lack of Bugs | 4.5 | Needs better documentation to support the feature set |
| Documentation | 2 | Poor |
| Performance | 4.5 | Worked fine |
| Installation | 5 | Easy |
| Learning Curve | 5 | Easy |
| Overall | 4.0 |
Product Information
Web Site: http://www.mssqltracer.com/
Developer: Quantum Software Research
Pricing: US$399