Introduction
Query history and server reports are two popular extensions in Azure Data Studio. In this article, we will cover these extensions. Firstly, the Query History extension allows having the history of the queries executed. Secondly, the Server Reports extension allows having reports about the DB Space, Buffer usage, CPU utilization, Backup Growth Trend, and the Wait counts.
We will show the features of both extensions here at SQL Server Central. Enjoy them!
Requirements
- Firstly, Azure Data Studio installed.
- Secondly, SQL Server installed.
Query history
Firstly, in order to install the extension, in the ADS go to Extensions and search for the Query History extension and install it.
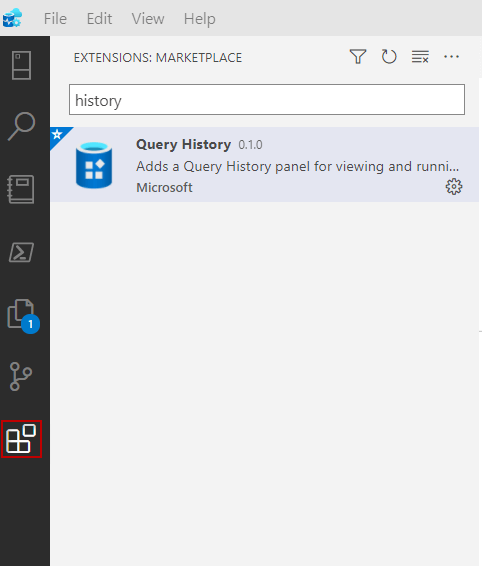 Install query history extension
Once installed in Azure Data Studio, go to the Menu and select View>Output (I tried View>Query History and it did not work, however, it could work on your side).
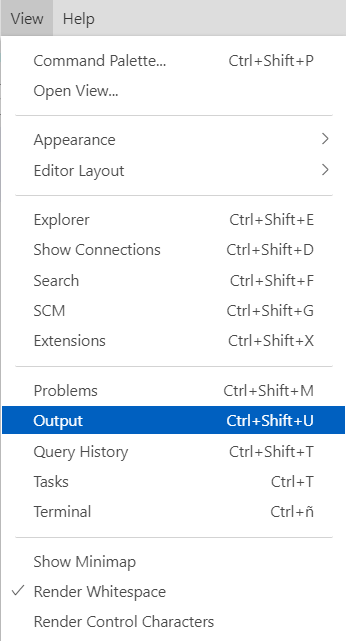 Query history menu
In the lower pane, go to the Query history tab to check the queries executed.
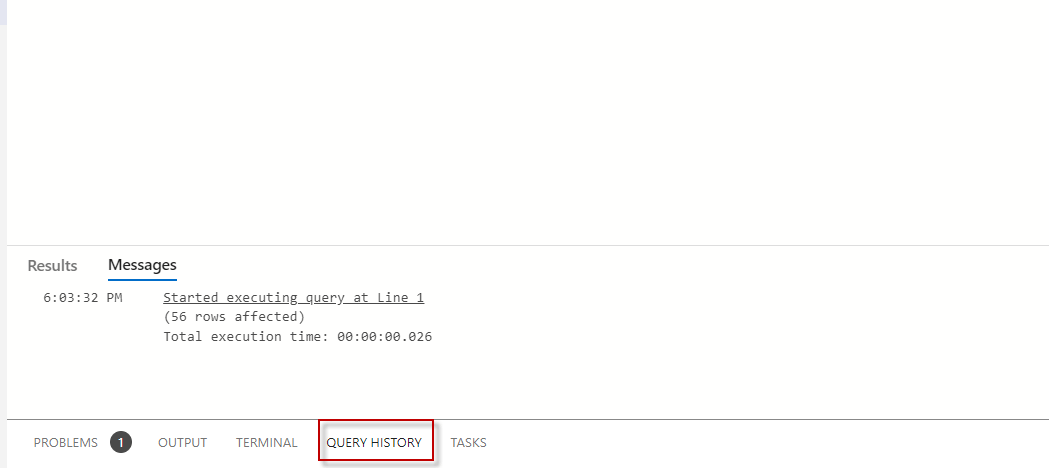 Show query history
Now, execute some queries in ADS:
sp_who

select getdate()

select * from HumanResources.Employee

select * from xtable
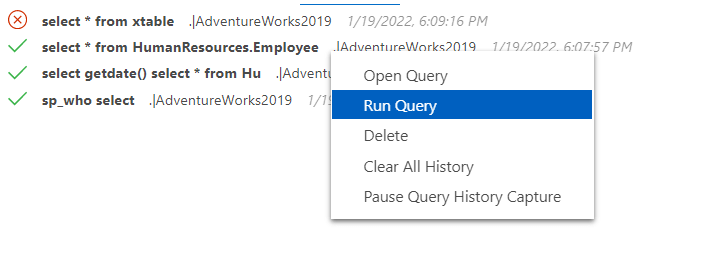
You will be able to see the queries successfully executed in green and in red with an X of the queries that failed. In addition, you will be able to see the database where it was executed as well as the date and execution time. If you right-click on the query, you have the following options on the context menu:
- Firstly, open Query opens the query to edit it.
- Secondly, Run Query runs the query again.
- Thirdly, we have the Delete option to delete the query from the query history.
- Also, we have the Clear All History option to clear all the records from the job history.
- Finally, we have the Pause Query History Capture to pause the query history capture.
Optionally, at the right of the pane, you also have the Clear All history option to clear all the query history and Pause to pause momentarily the query history.
Server Reports
The other extension that we want to show in this article is the Servers Reports. This is a cool extension to monitor the Database space usage, CPU utilization, MB used per backups, buffer usage, and more.
Firstly, to install in ADS, go to extensions and search the Server Reports and install it.

Server reports installation
Secondly, in ADS, go to Connections and select your SQL Server connection to right-click the connection and select Manage.
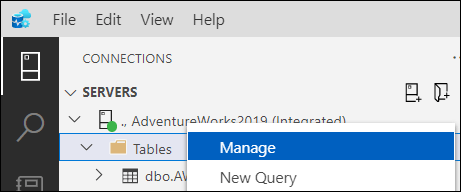 Manage SQL Server
Thirdly, click Server Reports.
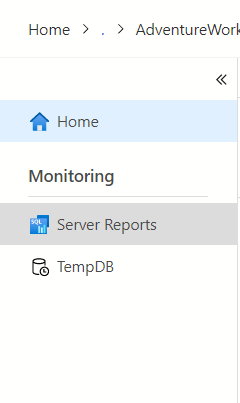 Azure Data Studio reports
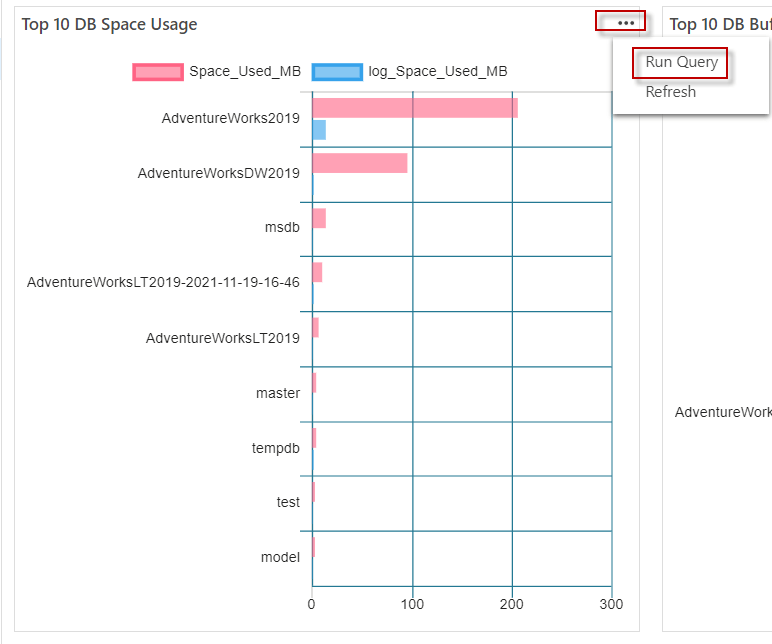
The report shows the space used. Not only does it show the data file space used, but also, the log space used per database. The report shows the top 10 databases that take more space.
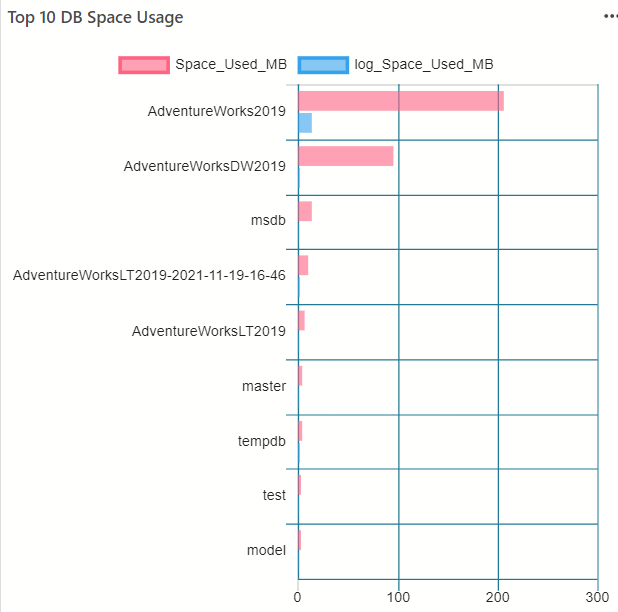 Space usage by Database
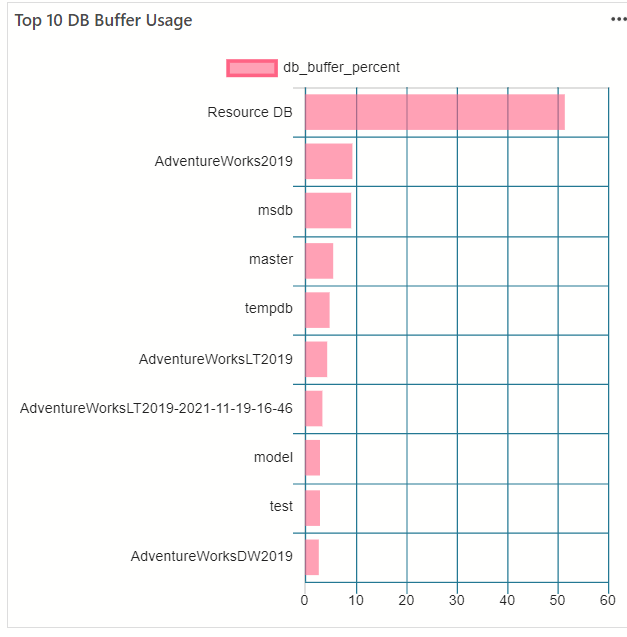
In addition, it shows the buffer usage. The buffer usage percent is a percentage related to the memory to store data pages. If there is not enough physical memory, you do not have the data in the cache and then the data is retrieved from disk which decreases the performance. If the percentage is high very often, you should consider adding more memory.
You may wonder what is the Resource DB. This is a read-only internal system database. It is not visible in SSMS and it contains system objects.
 Buffer usage per database
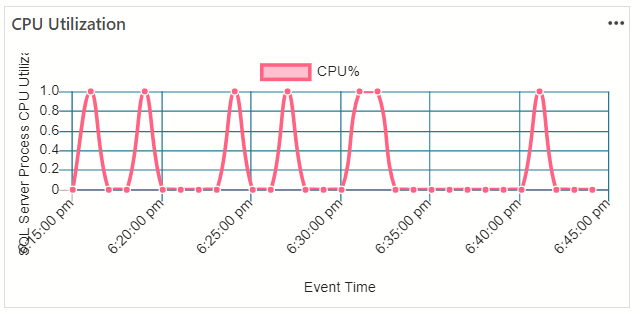
The CPU% is related to CPU usage. A high % of CPU usage means that you may need to update statistics, maybe add indexes, or enhance the design of the low-performance queries.
 SQL Server Utilization
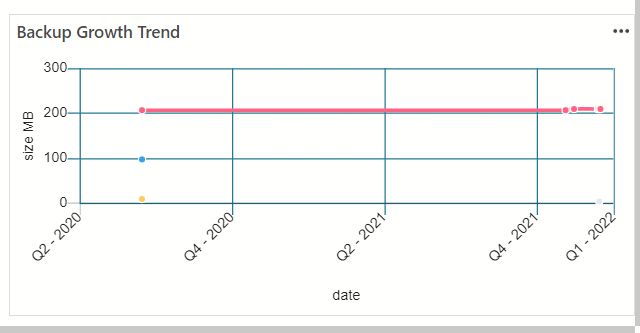
When you create backups, the memory usage increases, with this report, you can verify the size used by the backups created during time and plan if you will need more space in the long run.
 Server Reports
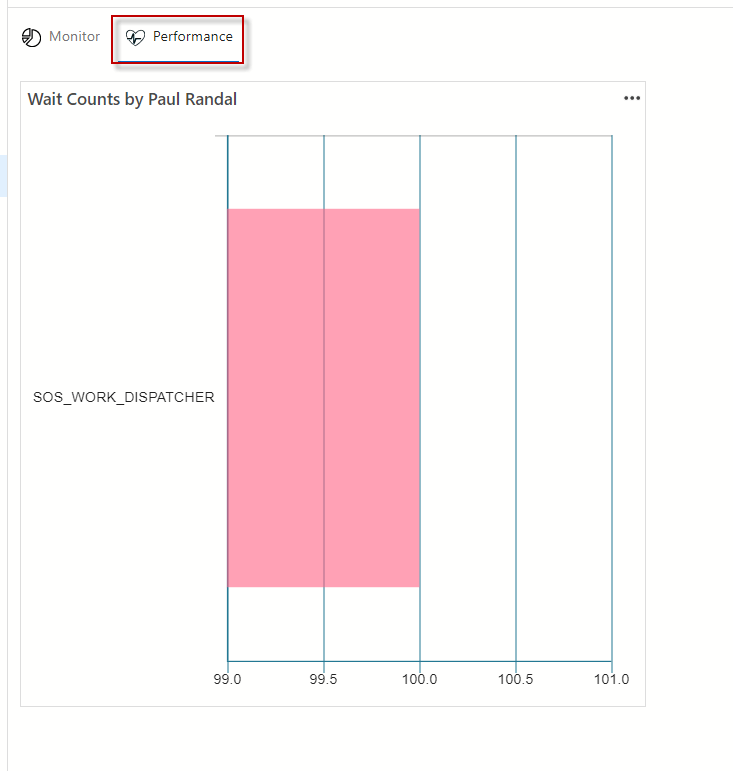
If we click the Performance tab, we will see the Wait Counts. Wait counts are related to waits of workers. The SOS_WORK_DISPATCHER occurs when an SQLOS thread is waiting for something to do. The wait starts if the thread is idle and ends when the thread has something to do.
 Wait counts by Paul Randal
We can also verify the queries used. We can use the browse button at the top right of the chart and we can use the Run Query or Refresh to see the query used and refresh the report.
 Option to run the query
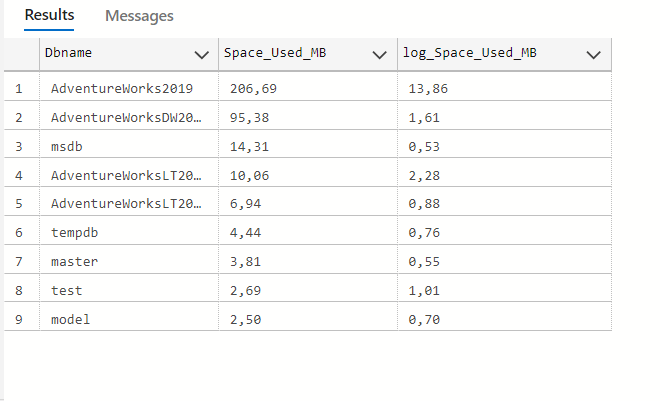 Database usage query
In addition, we can see the query used and check the system tables or views used in the query, and optionally, we could customize the queries according to our needs.
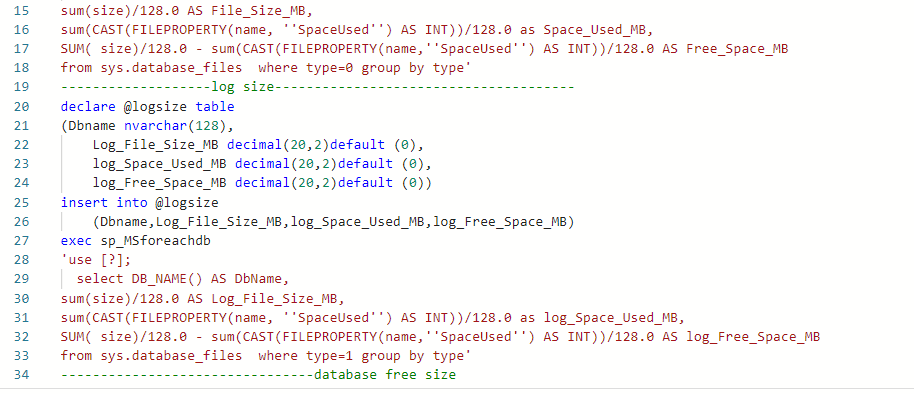 T-SQL about space used
Conclusion
In this article, we learned how to install, access, and use the Query History extension in Azure Data Studio. We also learned how to install the Server Reports extension and gather information about the database and log space used, CPU utilization, Backup space used, buffer usage, and more. If you have more questions, please write your comments.