

Introduction
In this article, we will learn how to Forecast data in Power BI. Forecasting in Power BI will help us to predict the future based on our current information. You can easily forecast in Power BI by following some simple steps.
Requirements to forecast data in Power BI
First, we need to have the Power BI Desktop installed.
Secondly, we need SQL Server installed.
Finally, we will use the Adventureworks database.
Import data
First, in Power BI press the Get data option.

Secondly, select the SQL Server database option and press Connect.

Thirdly, write the SQL Server name. In my case, I am using the local server. Press OK.

Also, in the Adventureworks database, check the Purchasing.PurchaseOrderDetail table. This is a table of the purchases made by the Adventureworks company. Next, press Load.

Visualize the data to forecast
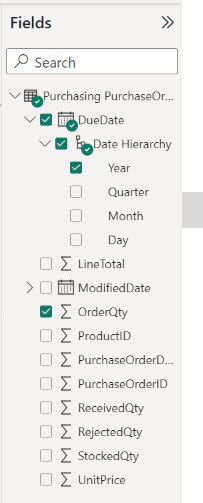
First, check the Purchasing.PurchaseOrderDetail table and the Year. Also, check the OrderQty field.
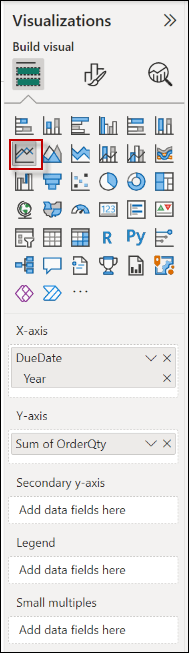
Secondly, select the Line chart. Make sure that the DueDate Year in the X-axis and the Y-axis have the Sum of OrderQty.
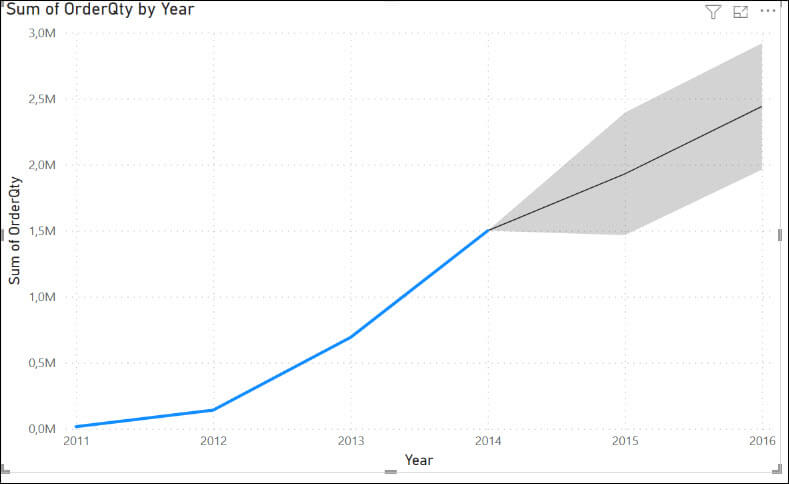
If everything is OK, the chart will look like this:
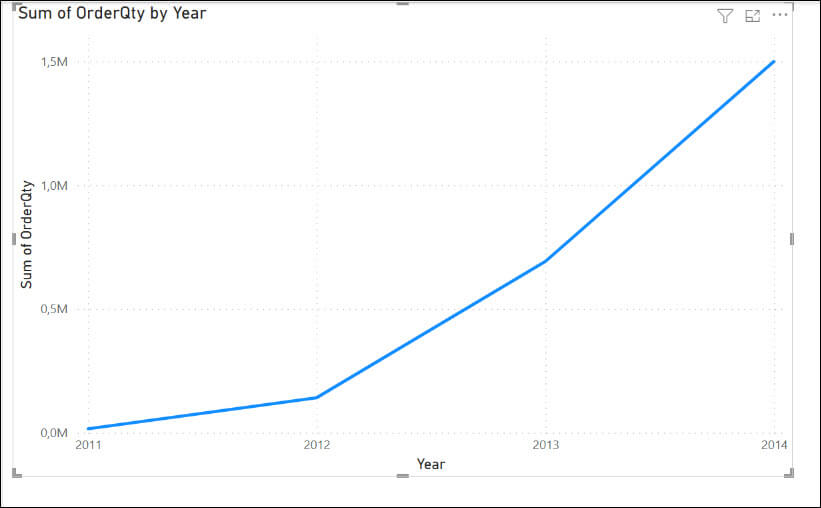
The company started in 2011 and until 2014 the sales increased to 1,5 million. In 2013, the sales were around 692K, and in 2012 140k.
Further analyses of your visual
To enable the forecast option, select add further analyses to your visual icon and then turn on the Forecast option. Note that the forecast option is not available if Power BI does not detect dates in the chart. If Power BI does not detect dates in the fields used, by the chart, you will not see the forecast option.
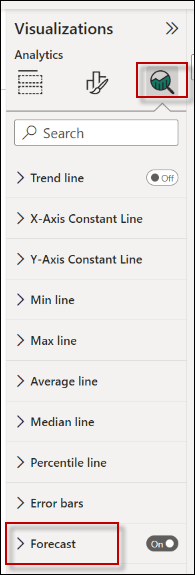
The Forecast includes the following options.
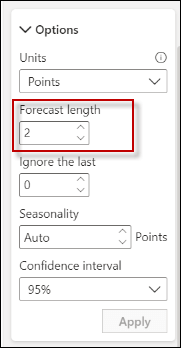
- First, we have units. Units are used to find if we want to forecast in Years, Quarters, Days or whatever option is available for the time.
- Secondly, we have Forecast Length. It is used to configure how many units ahead do we want to forecast. By default, the number is 10. In this example, we are using the Forecast length equal to 10, which means that we will forecast 10 years.
- Thirdly we have the Ignore the last option. It is useful when you think that some intervals of time should not be included in the forecast analysis because they are not representative. For example, if we had great sales before the COVID pandemic and during the pandemic, we have bad years. We think our forecast should not include the last 2 years because we are optimistic.
- Also, we have Seasonality. It is an option in Power BI. The option is used to determine some tendencies at a certain time. It will detect certain variations during the year. This option could be used to determine some patterns in the information and make some predictions about the future. For example, we can detect more sales during winter or during summer. Some valid values for seasonality are yearly, quarterly, monthly, weekly, and daily.
- Finally, we have the Confidence interval. This is a percentage used to determine how confident the value is. It is a range of values of the forecasted value. We consider this as the forecasting value with a margin of error. This margin is set by the user.

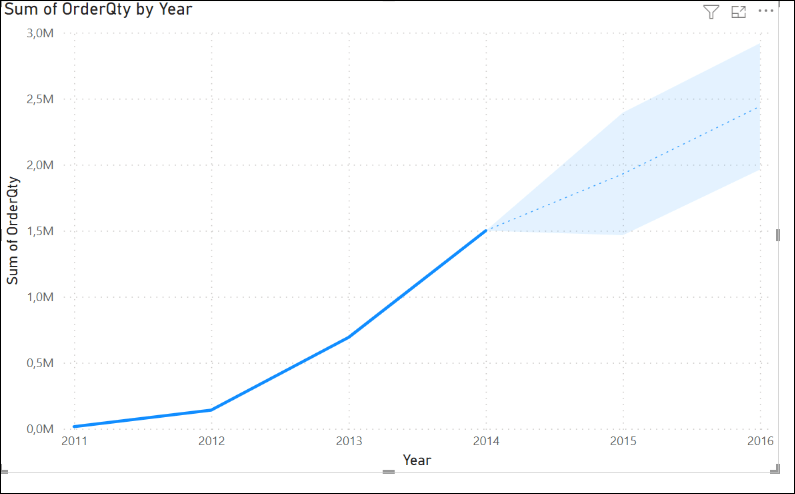
The current sales values from 2011-2014 are represented in a blue line. Also, the black line with a gray background represents the forecasting values. According to the forecast, our sales will reach 6 million in 2024.

Upper bound and Lower bound values
If you move the mouse over the lines in the chart, you will notice that the line has 3 values:
- First, you have the Forecast value which is the estimated value.
- Secondly, you have the Upper bound which is the maximum forecast value.
- Finally, you have Lower bound which is the minimum forecast value. Both, the upper bound and lower bound are determined by the Confidence interval explained previously.

Change the forecast length data in Power BI
We will show how to change the number of years, and months forecasted.
First, in order to change the prediction from 10 years to 2 years, change the Forecast length from 10 to 2
Secondly, verify the chart generated. Note that the forecasting line is shorter (it represents 2 years instead of 10).
Forecast data in Power BI – Changing the format
Follow these steps to change the forecast format in Power BI:
First, press add further analyses to your visual icon.
Secondly, look for the Forecast line.
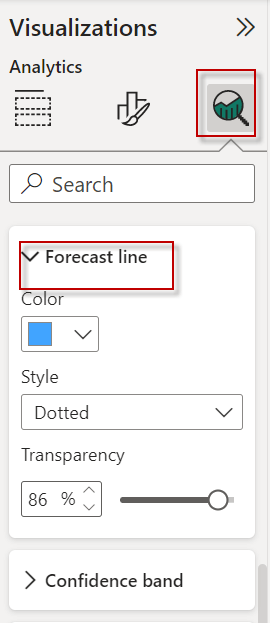
You have 3 options here:
- First, you have the color which is used to change the color of the forecast line.
- Secondly, you have a style that can be dotted, solid, or dashed.
- Finally, you can configure the transparency of the forecast colors.

In addition, you can configure the Confidence band. By default, you fill in, but you can use lines or remove the confidence band using the none option. Finally, you have the option to modify the tooltip title of the forecast value.

Forecast data in Power BI
Sometimes you need to see the values instead of watching the chart only. To check a table instead of a chart, you can follow these steps:
First, click on the More options icon.
Secondly, select the Show as a table option.
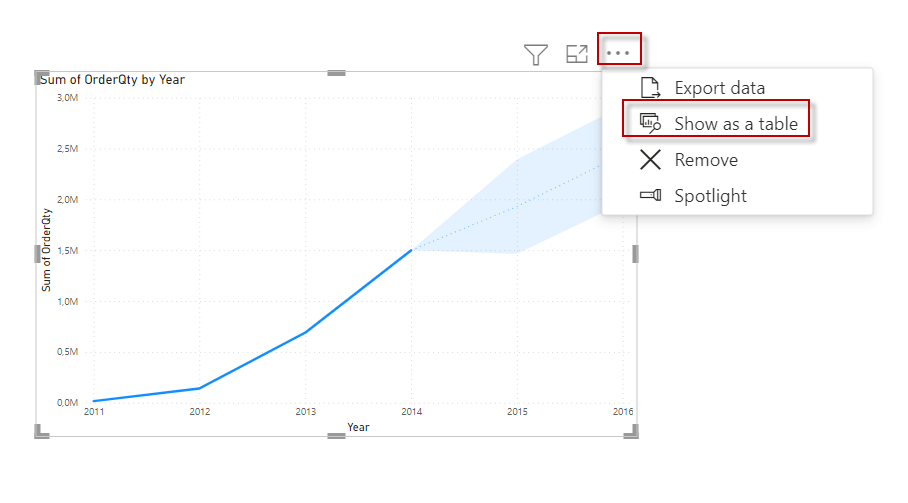
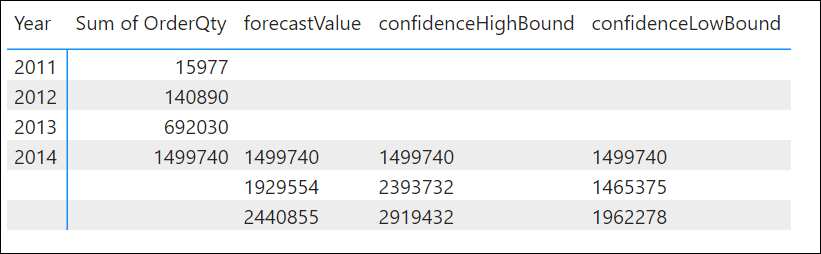
Finally, you will be able to see in a table the ForecastValue, the confidence Hight Bound and Low Bound values which were explained previously.
Conclusion
In this article, we saw how to forecast values. In our example, we predicted the order quantity values of the table purchasing.purchaseorderdetail table of the AdventureWorks database.
Also, we understood how to configure the forecast properties including the format options. Finally, we learned how to show the forecast values instead of the table.