

Introduction
In the first
part of this series, we took a look at how to bring up Query Analyzer 2000
and how to log in. We dealt with two issues: using different sets of
credentials and problems with querying linked servers. These two issues are often frustrating for developers
working with SQL Server. We left off with the promise to explore the Object Browser
and more specifically, the Transact-SQL Debugger. That's where this article
picks up.
When we open up SQL Server 2000's Query Analyzer for the first time, we can't
help but notice the Object Browser on the left side. The Object Browser is
not part of SQL Server 7.0's Query Analyzer and is our first sign that Microsoft
has added some functionality to this essential client tool. We'll discuss
the functionality provided in the Object Browser and dig into using the
Transact-SQL Debugger. Debugging tools have been missing from the standard
SQL Server client set until this latest version. Other Integrated
Development Environments (IDEs) produced by Microsoft have had at least marginal
debugging capabilities for a while now, dating back to the QuickBasic 4.0 days
of the late eighties. It's nice to see some basic but functional debugging
facilities in our bread and butter Query Analyzer.
We'll look at the following:
- The Basic Layout
- The Cost
- Scripting Existing Objects
- Scripting New Objects
- Using the Transact-SQL Debugger
The Basic Layout
When we first open up Query Analyzer, we'll see a display similar to the
following (minus the labels):
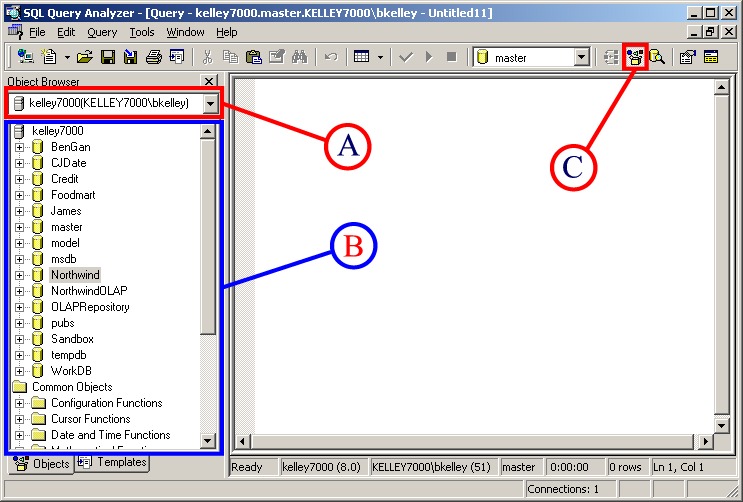
On the left hand side is a new window, the Object Browser. The Object
Browser has a drop down box (A) which contains a list of all SQL Servers
we've connected to since we've started Query Analyzer. It also has a tree view of
all our databases for the currently selected server, common functions
ranging from our @@connections to OPENXML(), as well as the various system data types (B).
If we want to turn Object Browser on or off, there's a button on the toolbar (C)
which allows us to click without going through the menus. There is a
shortcut key, F8, which does the same.
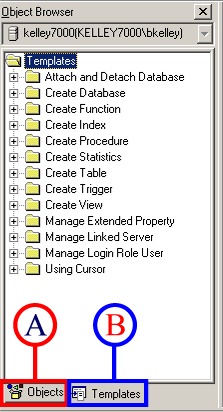
Looking at the Object Browser, we see that there are two tabs. There is
the Objects tab (A), which we've already explored a bit, and there is the
Templates tab (B), which contains quick scripting templates to help us
build Dynamic Definition Language (DDL) queries quickly and easily.
The Cost
Object Browser is an added tool to speed up our development efforts.
Microsoft has spent quite a bit of time and resources with this new piece to our
SQL Server IDE, and from outward appearances, it looks clean and usable.
But what's the cost? In order to be able to provide all this information,
surely it's got to hit the server, right? It does, and the actual cost is
expectedly low for most functions.
The Object Browser will require another connection to SQL Server. For
instance, running the following query returns two rows:
SELECT spid, program_name
FROM sysprocesses
WHERE program_name LIKE 'SQL Query Analyzer%'
One of the rows is the initial connection Query Analyzer requires. The
second is the Object Browser. Now, with respect to getting information to
populate the database list, Query Analyzer already pulls that information when
it starts up. As a result, the Object Browser doesn't need to make a
second query to get the same information. Also, it doesn't populate user
tables and the like until such time as we actually ask for the information by
expanding the appropriate categories. And when it does, it only asks for
the information it specifically requires. For instance, to get the
information on user tables within the Foodmart database, the Object Browser will
execute:
USE [Foodmart]
select id, owner = user_name(uid), name, status from [Foodmart].dbo.sysobjects where type = N'U' order by name
Object Browser queries only what it needs. It queries information only
when information is requested. The cost to use this tool for our
basic purposes is fairly negligible. It's only when we start using the
Transact-SQL Debugger will costs begin to rise. Let's talk about that a bit.
If we're stepping through a procedure (as we'll talk about later), the Object Browser
can actually lock system resources. This makes sense, as we want to
ensure that nothing changes from line to line. The whole point of
the debugger is to help isolate and control what's going on so we can figure out
what may be wrong with a particular stored procedure. As a result, the
Transact-SQL debugger should only be run in a development
environment. The last thing we want to do is impair a
production system as we try to troubleshoot why a particular stored procedure is
failing.
Scripting Existing Objects
When we deal with a lot of databases or a particular database with a lot of
objects, it can often become a chore trying to remember all the columns for a
particular table or the parameters for a selected stored procedure we want to
use. This is where the Object Browser can save quite a bit of time.
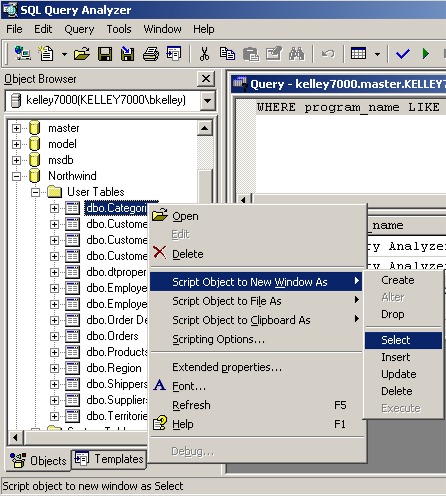
By right-clicking on the table name we need (in this case the Categories table
from the Northwind database), we can choose to script the appropriate T-SQL
command we need. In this case, I'm going to script the Select to a new
window:
Query Analyzer will create the new window and I'll find the following code
already there for me:
SELECT [CategoryID], [CategoryName], [Description], [Picture] FROM [Northwind].[dbo].[Categories]
All the columns for the Categories table are present in the query, and I can
now go in and edit the query to only return the columns I want. I could
also choose to script the object to the clipboard, and then insert the code
where I needed it. This is especially helpful if we're trying to build
stored procedures and already have some code in a window. There's no point
to scripting the object to a new window, then going through the process of
cutting or copying the code, next switching to the window where we're
building the stored procedure, and finally pasting the code we've just copied.
We can also script stored procedure execution. Not only will it script
the parameter names, but also the data type for each parameter. This
ensures we not only cover all the parameters, but also we avoid type mismatches
or unexpected type conversions. For instance, we can choose to script the
CustOrderHist stored procedure from the Northwind database:
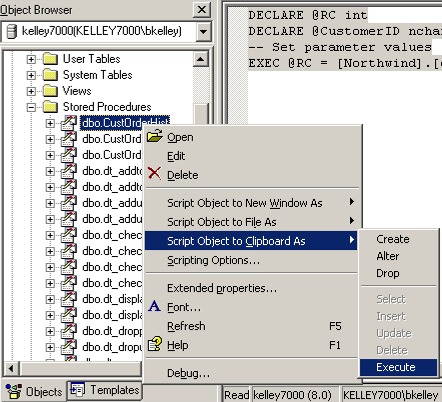
When we paste the code to Query Analyzer, we get the following:
DECLARE @RC int
DECLARE @CustomerID nchar(5)
-- Set parameter values
EXEC @RC = [Northwind].[dbo].[CustOrderHist] @CustomerID
Now, one limitation to the Object Browser is that multiple objects can't be
selected together to be scripted. So if we're looking to script tables to
join together, we'll have to script each table individually and then manually
building the join. Also, if we're looking to script database objects to
put into Visual SourceSafe or some other change management repository, the
Object Browser won't be of much help. There are better options with
Enterprise Manager or by using DMO.
Scripting New Objects
One nice addition to Query Analyzer in SQL Server 2000 is the ability to
create and use templates. Microsoft ships the basic templates for creating
standard database objects and we can choose to modify these or create our
own. If we've set up SQL Server 2000 with the default paths, we'll find
the folders containing our templates in C:\Program Files\Microsoft SQL Server\80\Tools\Templates\SQL Query Analyzer
with a folder structure that exactly matches the tree view for the Templates
tab. Here is the Create Procedure Basic Template:
-- =============================================
-- Create procedure basic template
-- =============================================
-- creating the store procedure
IF EXISTS (SELECT name
FROM sysobjects
WHERE name =
N'<procedure_name, sysname, proc_test>'
AND type
= 'P')
DROP PROCEDURE <procedure_name,
sysname, proc_test>
GO
CREATE PROCEDURE <procedure_name,
sysname, proc_test>
<@param1, sysname,
@p1> <datatype_for_param1, ,
int> = <default_value_for_param1, ,
0>,
<@param2, sysname, @p2> <datatype_for_param2, ,
int> = <default_value_for_param2, ,
0>
AS
SELECT @p1, @p2
GO
-- =============================================
-- example to execute the store procedure
-- =============================================
EXECUTE <procedure_name,
sysname, proc_test> <value_for_param1, ,
1>, <value_for_param2, ,
2>
GO
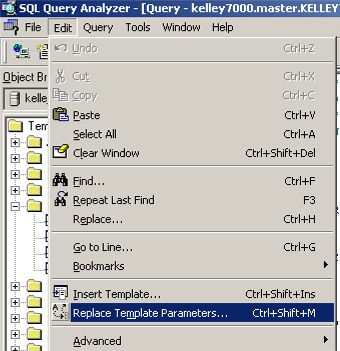
If we look closely, we see several structures of the format <parameter
name, parameter type, default value> scattered throughout the template
file. These structures can be replaced by going to the Edit
menu and selecting Replace Template Parameters or by using the
shortcut Ctrl+Shift+M.
.
When we choose to replace the template parameters, a dialog box comes up
where we can edit the parameters.
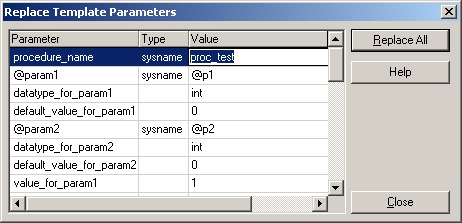
Once we click Replace All, SQL Server will take care of making
the changes for us. As a result, we can quickly build the skeleton
structure for our stored procedures and other database objects and use templates
to save on typing. Not only will this speed up our writing code, but it'll
also reduce a little on the typos.
But what if the standard template isn't enough? Where I work, stored
procedures have to be commented in a certain fashion. The Create
Procedure Basic Template doesn't have the comment structure I need. I
can edit it, or I can create my own. I chose to do the latter, adding the
comment block as so:
-- =============================================
-- Create procedure with comments
-- =============================================
-- creating the store procedure
IF EXISTS (SELECT name
FROM sysobjects
WHERE name =
N'<procedure_name, sysname, proc_test>'
AND type
= 'P')
DROP PROCEDURE <procedure_name,
sysname, proc_test>
GO
/***************************************************************************************************************
Written By : <author_name, , Brian Kelley>
Date : <create_date, smalldatetime, 01/01/2002>
Purpose : <procedure_purpose, , >
Input Params : <@param1, sysname, @p1>, <@param2, sysname, @p2>
Output Params : <@outparam1, sysname, @op1>
Updates :
***************************************************************************************************************/
CREATE PROCEDURE <procedure_name,
sysname, proc_test>
<@param1,
sysname, @p1> <datatype_for_param1, ,
int> = <default_value_for_param1, ,
0>,
<@param2, sysname, @p2> <datatype_for_param2, ,
int> = <default_value_for_param2, ,
0>
AS
SELECT @p1, @p2
GO
Having saved it as Create Procedure with Comments.tql in C:\Program Files\Microsoft SQL Server\80\Tools\Templates\SQL Query Analyzer\Create Procedure,
I can choose it like any other stored procedure template and have my comment
block with parameters that can be replaced. This will ensure every stored
procedure I create meets my organization's standards for commenting without me
having to either type in the entire comment block or find an existing stored
procedure and copying the comment block from it.
Transact-SQL Debugger:
The Transact-SQL Debugger is probably the biggest addition to SQL Server
2000's Query Analyzer. Prior to SQL Server 2000's release, I would see
postings asking if anyone knew of a good debugger for stored procedures in SQL
Server (then 7.0). With SQL Server 2000, that deficiency has been
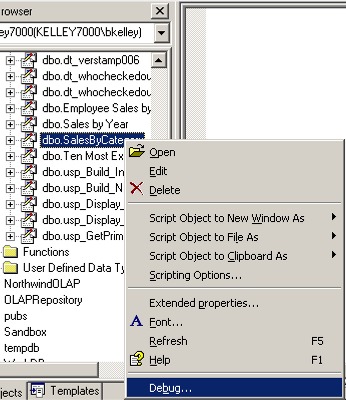
remedied, but the Transact-SQL Debugger is not readily visible. In order
to get to the debugger, we have to use the Object Browser or the Object Search
(from the Tools menu) to list the stored procedure. We then right click on it, and select Debug:
A new dialog box comes up which lists the stored procedure and allows us to
set the values of the parameters:
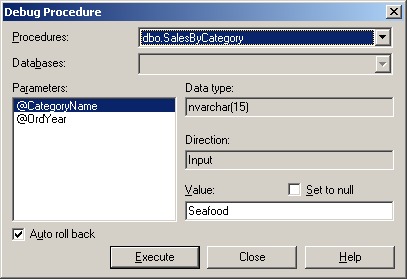
I'll enter Seafood for @CategoryName and 1999 for @OrdYear
in order to be able to trace through the stored procedure. Notice below the
parameters there is a check box for Auto roll back. This
ensure that when we are done tracing through the stored procedure, any
changes it made will be rolled back. If we want our changes to become
permanent, we'll need to uncheck this box. Once we have set our parameters
and decided upon Auto roll back, we can click Execute, and that'll take us to
the debug window:
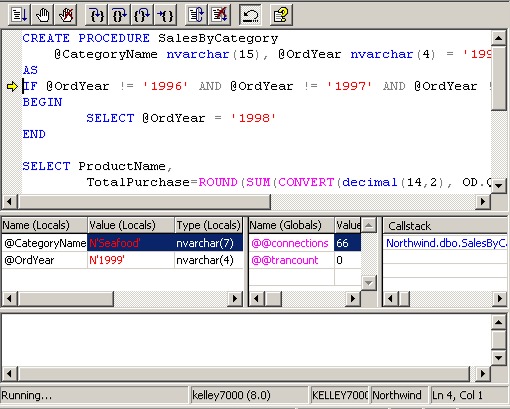
We have the code before us at the top of the debug window. Notice the
yellow arrow to the left of the code. This arrow tells us what line we're
on. Below the code we see windows where Query Analyzer is tracking both the local
and global parameters, as well as the current Callstack. Finally, at the bottom
we see the Results Text window. Notice there is an empty row in the Global
Parameters window. If we have other global parameters we want to watch (e.g.
@@IDENTITY), we can add them and track their values as we debug the stored
procedure.
In order to use the Transact-SQL Debugger, we have to be familiar with the
various commands available to us. The commands exist as both buttons on
the toolbar as well as keyboard shortcuts. Let's look at them:
| Button | Command | Purpose |
| Go (F5) | Executes the stored procedure in debug mode until either a breakpoint or the end of the stored procedure is reached. | |
| Set Breakpoint (F9) | Toggles a breakpoint on or off where the cursor currently is. A breakpoint will be marked by a red circle to the left of the line. Execution will be paused when a breakpoint is reached. | |
| Clear All Breakpoints (Ctrl+Shift+F9) | Removes all breakpoints. This will allow Go to process through the entire stored procedure. | |
| Step Into (F11) | Steps through the stored procedure line-by-line. The next line of the stored procedure will execute, and then execution will be paused. This is especially helpful if we're trying to see the procedure flow since we can follow one line at a time, at our own pace. | |
| Step Over (F10) | Also steps through the stored procedure line-by-line. The difference between Step Into and Step Over can only be seen if we make calls to other stored procedures. Using Step Into, we can step through called stored procedures line-by-line as well. However, using Step Over executes the called stored procedure in its entirety and puts us at the next line in the current stored procedure. We'd use Step Over for a called stored procedure when we know that stored procedure is correct and working properly. We don't need to go line-by-line throught it, and Step Over ensures we don't. If we're not sure about the called stored procedure, we can use Step Into to check the called stored procedure is executing as it should. | |
| Step Out (Shift+F11) | Executes the remaining lines, until a breakpoint or the end of the stored procedure is reached. If we've gone into Step Into or Step Over mode, and we no longer desire to go line by line, we use Step Out. | |
| Run To Cursor (Ctrl+F10) | This works like a breakpoint except it doesn't require us to explicitly set one. We position our cursor in the stored procedure wherever we want execution to pause, and then we use Run To Cursor. The stored procedure will execute until it reaches the line our cursor is on and then it will pause. | |
| Restart (Ctrl+Shift+F5) | Restarts the stored procedure from the beginning. Helpful if we've been stepping through and we realize we missed something. | |
| Stop Debugging (Shift+F5) | Stop Debugging sounds like it would end debug mode, but it actually means stop the current debugging step-through. We'll still remain in debug mode, which means we can start debugging again by using Go. This is useful if we need to stop debugging and we aren't planning on restarting immediately. |
The best way to get comfortable with the Transact-SQL Debugger is to
"play." This is actually true of any debugger for any IDE
whether it is part of Query Analyzer, Visual Studio, Forté for Java, or
some other product. Pick stored procedures that work perfectly well, ones
which you are very familiar with. Work with the parameters for the stored
procedures, set breakpoints, and use the various Step commands. Once
you're comfortable with that, take working stored procedures, alter them so that
still pass syntax checks, but the code does something other than what is
normally expected. Experiment with the debug commands to get to the code
that's been altered. The idea is to get comfortable with the debug
environment for the day when it'll be used on a new or relatively unfamiliar
stored procedure.
Now, for our current example, by playing with the Debugger and the SalesByCategory
stored procedure, we can choose to step through line-by-line. If we do,
we'll notice that our local parameter @OrdYear will change values from
the 1999 that we typed in to the value 1998. The reason is the
following set of code within the stored procedure:
IF @OrdYear != '1996' AND @OrdYear != '1997' AND @OrdYear != '1998'
BEGIN
SELECT @OrdYear = '1998'
END
@OrdYear isn't 1996, 1997, or 1998, and as a result the stored procedure is
going to change it! Had we not stepped through the stored procedure, we
might never have realized why we kept getting 1998 results for Seafood.
This is why the Debugger can really be of help. By going line-by-line and
watching the values for the local parameters, we can see if and when those
parameters change. This is why single step debuggers are worth the time it
takes to learn them and get comfortable with them. And once we are
comfortable with the Transact-SQL Debugger, we'll be able to use it to debug
stored procedures on SQL Server 6.5 SP2 and higher SQL Servers. As a
result, those of us running in mixed environments can leverage the Transact-SQL
Debugger across all our SQL Server platforms.
Wrap Up
In this article we talked about the Object Browser, a new feature in SQL
Server 2000's Query Analyzer. The Object Browser allows to rapidly develop
Transact-SQL code by auto-scripting for us not only existing database objects
but also by providing templates for new ones. We can script the execute of
a stored procedure, complete with all parameters, or the insert or delete on a
table, with all the columns listed for our convenience. By using templates
we can fill out predefined parameters and generate the skeleton T-SQL code for
creating a new database object. We can use the stock templates or create
our own.
We also talked about the Transact-SQL Debugger. The Transact-SQL
Debugger represents a sizeable upgrade on our debugging capabilities with
respect to stored procedures. Not only does it work against SQL Server
2000 servers, but also on any SQL Server from SQL Server 6.5 SP2 and up.
The Transact-SQL Debugger gives us the ability to go line-by-line and carefully
watch how parameters change. It allows us to set breakpoints to run to,
much like other single step debuggers. Because of these new-found
debugging capabilities, we can often save considerable time finding bugs in our
code that otherwise would be difficult to extract.
Hopefully you've found this brief synopsis of the Object Browser
helpful. In the next article we'll scale back a bit and look at how to
configure our Query Analyzer environment for our liking. We'll look at
modifying the toolbars, setting connecting settings, and defining shortcut
keys. We'll also look briefly at changing how we output result sets.
By examining the various options available to us, we can customize the Query
Analyzer for maximum use.