

Fun with sp_ExecuteSQL
When I first ran SQL Profiler against nHibernate I noticed that calls to the database were being made via sp_prepexec. in sp_prepexec and nHibernate. I did quite a bit of digging around to find out more about sp_prepexec which I wrote up in "sp_prepexec and nHibernate".
To summarise the article, until recently sp_prepexec was an undocumented stored procedure and even today very little documentation is available for it.
- It is in a family of cursor stored procs which include sp_prepare, sp_prepexec and sp_unprepare
- It should not be called directly
- It is called as part of the fundamental under-the-hood operation of ADO.NET, OLEDB operations
- Its scope is session based though any queries plans generated are global
Given its undocumented nature and a natural DBA aversion to putting undocumented system procs in production systems I asked our developers to set the nHibernate configuration switch to use sp_executesql instead.
<propertyname='prepare_sql'>false</property>
At this point a number of problems came to the fore which have been fixed as part of nHibernate V2.2
What I hope to cover here is not nHibernate but a write-up of the issues were found in the way that dynamic and parameterised SQL were called using sp_executeSQL.
Sp_executesql
The basics
Sp_executesql is fully documented both in books-online and MSDN. Its purpose is to allow queries with the same signature but different parameter values to use the same query plan.
To show an example of this run the following code
USEAdventureWorksgo DECLARE@EmployeeIDint, @Statementnvarchar(2000), @ParamDefinitionsnvarchar(2000)SET@Statement = N'SELECT * FROM HumanResources.Employee WHERE ManagerId=@ManagerID AND MaritalStatus=@MaritalStatus'SET@ParamDefinitions = N'@ManagerID INT,@MaritalStatus char(1)'execsp_executesql @statement, @ParamDefinitions,@ManagerID=21,@Maritalstatus='S'
Then run the following query
SELECTST.dbid, st.text, cp.usecounts, cp.size_in_bytes, qp.query_plan, cp.cacheobjtype, cp.objtype, cp.plan_handle, qp.numberFROMsys.dm_exec_cached_planscpCROSS APPLYsys.dm_exec_sql_text(cp.plan_handle) stCROSS APPLYsys.dm_exec_query_plan(cp.plan_handle) qpWHEREst.text like'%SELECT * FROM HumanResources.Employee WHERE ManagerId%'
What you should see in the recordset with a line containing
(@ManagerID INT,@MaritalStatus char(1))SELECT * FROM HumanResources.Employee WHERE ManagerId=@ManagerID AND MaritalStatus=@MaritalStatus
Now if we go back and change the marital status from S to M by changing the sp_executesql statement from
execsp_executesql @statement, @ParamDefinitions,@ManagerID=21,@Maritalstatus='S'
to
execsp_executesql @statement, @ParamDefinitions,@ManagerID=21,@Maritalstatus='M'
Execute the query and run our query plan statement again you will see that although sp_executesql gave us a different recordset our query plan statement still returned the same record.
In fact, as long as all we change is the parameter values sp_executeSQL will reuse this plan.
There are a couple of points to note with our query plan statement.
- Usecounts increments every time we use sp_executesql to call our statement
- Size_in_bytes tells us the size of the execution plan in memory.
The significance of these figures will become apparent later.
Digging deeper
Now let us try changing the case of the SELECT statement used by sp_executeSQL from
SET@Statement = N'SELECT * FROM HumanResources.Employee WHERE ManagerId=@ManagerID AND MaritalStatus=@MaritalStatus'
TO
SET@Statement = N'select * FROM HumanResources.Employee WHERE ManagerId=@ManagerID AND MaritalStatus=@MaritalStatus'
Running our query plan statement now reveals that we have two separate plans even though as human beings we can see the two queries are the same.
Just for the sake of completeness let us try changing the case of the parameter definitions from
SET@ParamDefinitions = N'@ManagerID INT,@MaritalStatus char(1)'
TO
SET@ParamDefinitions = N'@ManagerID INT,@MARITALSTATUS char(1)'
Again, running our query plan statement reveals that we now have 3 separate plans!
LESSON ONE: The cache is case sensitive.
For nHibernate this isn't an issue as the objects are predefined and statements always follow the same pattern. If your application developers do not use an ORM framework and call sp_executeSQL this is something to bear in mind.
What about stored procedures?
You can see that parameterised SQL is case sensitive but what about calls to stored procedures?
I ran the following T-SQL in the AdventureWorks database
USE[AdventureWorks]GO DECLARE@return_valueintEXEC@return_value = [dbo].[uspGetEmployeeManagers] @EmployeeID = 21SELECT'Return Value'= @return_valueGO
Closely followed by
USE[AdventureWorks]GO DECLARE@return_valueintEXEC@return_value = [dbo].[USPGETEMPLOYEEMANAGERS] @EmployeeID = 21SELECT'Return Value'= @return_valueGO
Using our query to have a look at the proc cache revealled the following
| dbid | text | usecounts | size_in_bytes | query_plan | cacheobjecttype | objtype |
|---|---|---|---|---|---|---|
| 9 | CREATE PROCEDURE [dbo].[uspGetEmployeeManagers] @Emp... | 2 | 122880 | <ShowPlanXML xmlns="http://schemas.microsoft.com... | Compiled Plan | Proc |
Here you can see that the case in which the stored proc is called has no bearing on the number of entries in the proc cache.
Variable length parameters
Let us try adding in a variable length parameter into the statement we use with sp_executeSQL
DECLARE@EmployeeIDint, @Statementnvarchar(2000), @ParamDefinitionsnvarchar(2000)SET@Statement = N'select * FROM HumanResources.Employee WHERE ManagerId=@ManagerID AND MaritalStatus=@MaritalStatus AND Title=@Title'SET@ParamDefinitions = N'@ManagerID INT,@MaritalStatus char(1),@Title nvarchar(50)'execsp_executesql @statement, @ParamDefinitions,@ManagerID=21,@Maritalstatus='S',@Title='Production Supervisor - WC60'
Execute the script then change the definition of @Title from nvarchar(50) to nvarchar(40) and re-execute it
SET@ParamDefinitions = N'@ManagerID INT,@MaritalStatus char(1),@Title nvarchar(40)'execsp_executesql @statement, @ParamDefinitions,@ManagerID=21,@Maritalstatus='S',@Title='Production Supervisor - WC60'
If we run our query plan statement we will see two separate entries for our query.
LESSON TWO: A separate query plan will result if parameter sizes differ for what is essentially the same query.
Prior to nHibernate V2.2 this was a problem because nHibernate sized the parameters to the contents of the value being passed to it.
- @FirstName = 'JIM' would be passed as NVARCHAR(3)
- @FirstName = 'DAVE' would be passed as NVARCHAR(4)
Why is this a problem?
Take a look at the variable length fields in the Adventureworks.Person.Address table.
- AddressLine1
- AddressLine2
- City
- PostalCode
Running the query below tells us that there are 1,320 possible variations of lengths for combinations of those fields in the table.
SELECTLEN(AddressLine1)ASAd1Length, LEN(AddressLine2)ASAd2Length, LEN(city)ASCityLength, LEN(PostalCode)ASPostalLengthFROMPerson.AddressGROUP BYLEN(AddressLine1), LEN(AddressLine2) , LEN(city) , LEN(PostalCode)
A parameterised INSERT statement is 25K so factor in the variability and our 25K query plan is now 25K x 1,320 = 33MB!
That is one query against one table!
Adventureworks is a small sample database with 71 tables so considering the different combinations of variable length fields for each table and the number of different queries that are to be run across the database you can soon see why the our proc cache starts to balloon into the GB range!
There is another problem associated with varying parameter sizes for what is essentially the same query.
Whenever a new query is run it has to pass through the cost based optimisation process. A simplified illustration of this process is shown by the diagram below.
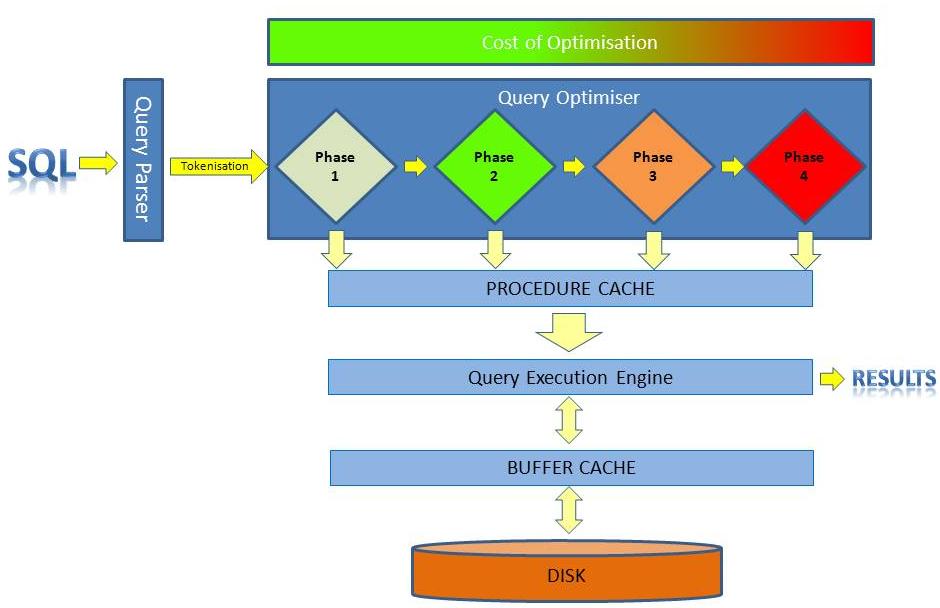
This is a phased process so if the query cost falls below the threshold for stage one then it that plan will be cached and executed.
If it is exceeds the threshold for simple optimisation then it is passed to the 2nd phase optimisation and if it can be optimised within the limits of the 2nd phase then again, its plan is cached and the query executed.
There is a 3rd and 4th phase and obviously each phase gets progressively more expensive. A colleague mentioned that he had seen a complex query take 17 seconds just to go through the optimisation process.
Most of the queries I have seen coming out of nHibernate are relatively straight forward and have had a modest cost but you still have the overhead of compiling the query prior to execution.
Why do we care about memory taken to story query plans?
I have often asked the question as to what is the optimum memory for a SQL Server instance and the answer always seems to be "as much as you can afford".
At this point it is a good idea to take a look at what SQL Server uses its memory for. The principal items are as follows
Memory | Comment |
|---|---|
Data cache known as the buffer pool | Ideally we need enough memory to hold the active data portion of our database in memory. Being able to retrieve data from memory is absolutely key to giving good performance. |
Query cache known as the proc cache | If the proc cache bloat gets out of hand then pages will be "stolen" from the buffer pool to allocate to the proc cache. |
Connections | 94KB + (3 x network package size - typically 4096KB) Clearly we would need a very high number of users for connection memory to pose a problem. What those connections actually do in terms of querying is another matter, particularly if they are running heavy weight queries bringing back loads of data. |
Locks | 64 bytes 32 bytes per owner. Lock escalation is a trade-off between concurrency and memory usage. Lock escalation occurs when 5,000 or more locks occur on an object. If it didn't occur then the risk is that the amount of memory used to maintain those locks would start to eat into the memory available for the buffer pool. |
http://msdn.microsoft.com/en-us/library/aa337559.aspx
Obviously memory is consumed by the operating system, CLR functions, full text index service, SSIS processes and a whole range of other things.
Problems with 64 Bit SQL Server
If you get proc cache bloat on a 32 bit server then to a certain extent this gets masked by the fact that the proc cache can't stray into AWE memory. Effectively it is constrained to a 2GB maximum.
Switch to 64 Bit however and such constraints vanish and it will continue to grow as much as it needs to until it starts to eat into the buffer pool.
When this happens your server will start to show symptoms of coming under memory pressure.
- Increased paging to disk
- Increased IO
- Decreased performance
- Increased demand on CPU
- …etc
What affect does query complexity have on the proc cache?
Data can stay in the buffer cache until the allocated memory is needed for newer data. If your server has more memory than there is data then it is conceivable that the data will remain in the buffer cache until the SQL Server service is restarted.
Query plans age out of the cache eventually based on an algorithm that checks when they were last used and how complex the plan was.
- The more costly a query was to compile the longer it will stay in the proc cache
- If the query is reused then it will stay in the proc cache.
If you run a query on your development box tonight, check the existence of the execution plan and come back the next day then it will be gone by the morning.
Internally SQL Server is constantly cycling through the proc cache aging the items in the cache until they qualify for removal.
To summarise it all...
- For parameterised SQL the proc cache is case sensitive
- Any change in one or more parameters means the parameterised SQL is treated as a different
- When moving from 32 Bit to 64 Bit SQL Server it is wise to inspect the proc cache to see what demands are being made on it i.e. will the elimination of the 2GB limit affect your system.
- Query plans will age out of the proc cache according to a time based algorithm. If you have dynamic SQL and/or parameterised SQL with parameter lengths that vary depending on their contents rather than their intent then the cache will be eaten faster than it can age out.

